***Last / Change / Volume data in this table is the closing quote data***
Symbol/Exchange
Company Name
Industry Group |
PRICE |
CHANGE
(%Change) |
Day High |
Volume
(% DAV)
(% 50 day avg vol) |
52 Wk Hi
% From Hi |
Featured
Date |
Price
Featured |
Pivot Featured |
|
Max Buy |
AIXG
-
NASDAQ
Aixtron Se
ELECTRONICS - Semiconductor Equipment andamp; Mate
|
$40.69
|
+0.65
1.62% |
$40.81
|
110,182
41.01% of 50 DAV
50 DAV is 268,700
|
$44.96
-9.50%
|
4/5/2011
|
$44.14
|
PP = $44.64
|
|
MB = $46.87
|
Most Recent Note - 5/9/2011 5:33:35 PM
G - A rally above its 50 DMA line would help its outlook, technically. Recently struggling below that important short-term average near prior chart lows in the $38 area defining near-term support. More damaging losses would raise greater concerns. It faces overhead supply up through the $45 level.
>>> The latest Featured Stock Update with an annotated graph appeared on 5/6/2011. Click here.
View all notes |
Alert me of new notes |
CANSLIM.net Company Profile |
SEC |
Zacks Reports |
StockTalk |
News |
Chart |
Request a new note
C
A N
S L
I M


|
BIDU
-
NASDAQ
Baidu Inc Ads
INTERNET - Internet Information Providers
|
$142.24
|
-0.38
-0.27% |
$143.69
|
5,426,923
70.98% of 50 DAV
50 DAV is 7,645,500
|
$156.04
-8.84%
|
3/17/2011
|
$121.97
|
PP = $131.73
|
|
MB = $138.32
|
Most Recent Note - 5/9/2011 5:36:08 PM
G - Posted a 3rd consecutive gain on ever quieter volume today. Halted its slide just above its 50 DMA line after recent losses on heavy volume marked worrisome distribution. Prior high near $131 defines additional support to watch below its short-term average.
>>> The latest Featured Stock Update with an annotated graph appeared on 5/9/2011. Click here.
View all notes |
Alert me of new notes |
CANSLIM.net Company Profile |
SEC |
Zacks Reports |
StockTalk |
News |
Chart |
Request a new note
C
A N
S L
I M
|
CMG
-
NYSE
Chipotle Mexican Grill
LEISURE - Restaurants
|
$269.85
|
+3.44
1.29% |
$269.98
|
506,025
44.37% of 50 DAV
50 DAV is 1,140,500
|
$289.35
-6.74%
|
4/1/2011
|
$274.00
|
PP = $275.10
|
|
MB = $288.86
|
Most Recent Note - 5/9/2011 5:38:22 PM
G - Small loss on light volume today. Recently found support near its 50 DMA line after it negated its latest technical breakout.
>>> The latest Featured Stock Update with an annotated graph appeared on 4/13/2011. Click here.
View all notes |
Alert me of new notes |
CANSLIM.net Company Profile |
SEC |
Zacks Reports |
StockTalk |
News |
Chart |
Request a new note
C
A N
S L
I M
|
CTSH
-
NASDAQ
Cognizant Tech Sol Cl A
COMPUTER SOFTWARE and SERVICES - Business Software and Services
|
$78.46
|
+1.04
1.34% |
$78.53
|
1,694,890
68.32% of 50 DAV
50 DAV is 2,480,800
|
$83.48
-6.01%
|
2/7/2011
|
$75.09
|
PP = $76.46
|
|
MB = $80.28
|
Most Recent Note - 5/9/2011 5:22:15 PM
G - Small gain on light volume today, but a rally above its 50 DMA line is needed to help its outlook. A 5/03/11 gap down violating its 50 DMA line triggered a technical sell signal following earnings news. Increased earnings +34% on +43% sales revenues for the quarter ended March 31, 2011 versus the year ago period.
>>> The latest Featured Stock Update with an annotated graph appeared on 4/15/2011. Click here.
View all notes |
Alert me of new notes |
CANSLIM.net Company Profile |
SEC |
Zacks Reports |
StockTalk |
News |
Chart |
Request a new note
C
A N
S L
I M
|
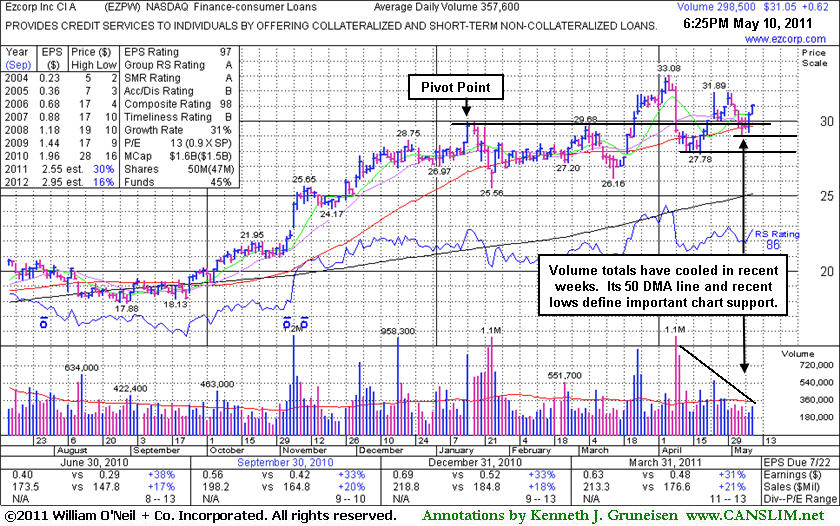
EZPW
-
NASDAQ
Ezcorp Inc Cl A
SPECIALTY RETAIL - Specialty Retail, Other
|
$31.05
|
+0.62
2.04% |
$31.06
|
298,534
83.48% of 50 DAV
50 DAV is 357,600
|
$33.08
-6.14%
|
2/18/2011
|
$27.94
|
PP = $30.04
|
|
MB = $31.54
|
 Most Recent Note - 5/10/2011 5:01:50 PM
G - Volume totals have been cooling in recent weeks while it has not formed a sound new base pattern. Its 50 DMA line and recent lows define important nearby chart support levels to watch where technical violations would raise more serious concerns.
>>> The latest Featured Stock Update with an annotated graph appeared on 5/10/2011. Click here.
View all notes |
Alert me of new notes |
CANSLIM.net Company Profile |
SEC |
Zacks Reports |
StockTalk |
News |
Chart |
Request a new note
C
A N
S L
I M
|
Symbol/Exchange
Company Name
Industry Group |
PRICE |
CHANGE
(%Change) |
Day High |
Volume
(% DAV)
(% 50 day avg vol) |
52 Wk Hi
% From Hi |
Featured
Date |
Price
Featured |
Pivot Featured |
|
Max Buy |
FOSL
-
NASDAQ
Fossil Inc
CONSUMER DURABLES - Recreational Goods, Other
|
$105.97
|
+11.97
12.73% |
$107.27
|
3,992,985
475.19% of 50 DAV
50 DAV is 840,300
|
$96.99
9.26%
|
2/1/2011
|
$73.30
|
PP = $74.44
|
|
MB = $78.16
|
Most Recent Note - 5/10/2011 12:20:32 PM
G - Gapped up today for a considerable volume-driven gain and new all-time high after reporting +62% earnings on +37% sales revenues for the quarter ended March 31, 2011 versus the year ago period. As previously noted - "It could produce more climactic gains, but it is extended from any sound base."
>>> The latest Featured Stock Update with an annotated graph appeared on 5/2/2011. Click here.
View all notes |
Alert me of new notes |
CANSLIM.net Company Profile |
SEC |
Zacks Reports |
StockTalk |
News |
Chart |
Request a new note
C
A N
S L
I M
|
HMSY
-
NASDAQ
H M S Holdings Corp
COMPUTER SOFTWARE and SERVICES - Healthcare Information Service
|
$78.42
|
+0.55
0.71% |
$78.80
|
101,824
57.72% of 50 DAV
50 DAV is 176,400
|
$84.82
-7.55%
|
11/19/2010
|
$61.89
|
PP = $63.01
|
|
MB = $66.16
|
Most Recent Note - 5/9/2011 4:23:10 PM
G - Closed near the high end of its intra-day range today with a solid gain on above average volume. A subsequent rebound above its 50 DMA line (now $79.94) would help its outlook, but that short-term average may now act as resistance.
>>> The latest Featured Stock Update with an annotated graph appeared on 4/26/2011. Click here.
View all notes |
Alert me of new notes |
CANSLIM.net Company Profile |
SEC |
Zacks Reports |
StockTalk |
News |
Chart |
Request a new note
C
A N
S L
I M
|
HS
-
NYSE
Healthspring Inc
HEALTH SERVICES - Health Care Plans
|
$43.84
|
+0.63
1.46% |
$43.98
|
663,185
73.26% of 50 DAV
50 DAV is 905,200
|
$44.47
-1.42%
|
3/22/2011
|
$38.29
|
PP = $38.85
|
|
MB = $40.79
|
Most Recent Note - 5/6/2011 1:29:00 PM
G - Gapped up today and hit a new 52-week high following a positive reversal on the prior session after gapping down and slumping toward prior highs. Its 50 DMA line defines important chart support.
>>> The latest Featured Stock Update with an annotated graph appeared on 4/21/2011. Click here.
View all notes |
Alert me of new notes |
CANSLIM.net Company Profile |
SEC |
Zacks Reports |
StockTalk |
News |
Chart |
Request a new note
C
A N
S L
I M
|
INFA
-
NASDAQ
Informatica Corp
COMPUTER SOFTWARE and SERVICES - Business Software and Services
|
$53.59
|
+0.82
1.55% |
$53.91
|
780,857
75.42% of 50 DAV
50 DAV is 1,035,400
|
$56.49
-5.13%
|
3/24/2011
|
$50.04
|
PP = $49.86
|
|
MB = $52.35
|
Most Recent Note - 5/6/2011 1:36:02 PM
G - Up today without great volume conviction, halting its slide after 4 consecutive losses indicative of mild distributional pressure. Prior highs in the $49 area and its 50 DMA line define important support to watch.
>>> The latest Featured Stock Update with an annotated graph appeared on 4/27/2011. Click here.
View all notes |
Alert me of new notes |
CANSLIM.net Company Profile |
SEC |
Zacks Reports |
StockTalk |
News |
Chart |
Request a new note
C
A N
S L
I M
|
LULU
-
NASDAQ
Lululemon Athletica
MANUFACTURING - Textile Manufacturing
|
$98.89
|
-0.10
-0.10% |
$101.14
|
1,293,945
58.25% of 50 DAV
50 DAV is 2,221,400
|
$102.83
-3.83%
|
3/28/2011
|
$68.11
|
PP = $85.38
|
|
MB = $89.65
|
Most Recent Note - 5/9/2011 4:11:05 PM
G - Up today for a considerable gain on lighter than average volume and it closed near the session high. This high-ranked Retail-Apparel firm has been noted as extended from any sound base pattern. Prior highs and its 50 DMA line in the $85 area define important chart support to watch.
>>> The latest Featured Stock Update with an annotated graph appeared on 5/3/2011. Click here.
View all notes |
Alert me of new notes |
CANSLIM.net Company Profile |
SEC |
Zacks Reports |
StockTalk |
News |
Chart |
Request a new note
C
A N
S L
I M
|
Symbol/Exchange
Company Name
Industry Group |
PRICE |
CHANGE
(%Change) |
Day High |
Volume
(% DAV)
(% 50 day avg vol) |
52 Wk Hi
% From Hi |
Featured
Date |
Price
Featured |
Pivot Featured |
|
Max Buy |
MG
-
NYSE
Mistras Group Inc
DIVERSIFIED SERVICES - Bulding and Faci;ity Management Services
|
$17.53
|
+0.34
1.98% |
$17.53
|
165,643
92.33% of 50 DAV
50 DAV is 179,400
|
$18.46
-5.04%
|
3/15/2011
|
$15.48
|
PP = $15.90
|
|
MB = $16.70
|
Most Recent Note - 5/10/2011 4:52:15 PM
G - Up today with lighter than average volume for its 3rd consecutive gain since completing a new Public Offering. The prompt repair of its 50 DMA violation technically improved its outlook, however it has not formed a sound base pattern.
>>> The latest Featured Stock Update with an annotated graph appeared on 4/12/2011. Click here.
View all notes |
Alert me of new notes |
CANSLIM.net Company Profile |
SEC |
Zacks Reports |
StockTalk |
News |
Chart |
Request a new note
C
A N
S L
I M
|
MWIV
-
NASDAQ
M W I Veterinary Supply
HEALTH SERVICES - Medical Instruments and; Supplies
|
$82.56
|
-0.44
-0.53% |
$83.52
|
99,203
98.61% of 50 DAV
50 DAV is 100,600
|
$86.99
-5.09%
|
11/4/2010
|
$61.79
|
PP = $59.60
|
|
MB = $62.58
|
Most Recent Note - 5/9/2011 4:29:50 PM
G - Holding its ground near its all-time high. Extended from any sound base pattern now, its 50 DMA line defines important support to watch. Reported earnings +34% on +28% sales for the quarter ended March 31st.
>>> The latest Featured Stock Update with an annotated graph appeared on 5/5/2011. Click here.
View all notes |
Alert me of new notes |
CANSLIM.net Company Profile |
SEC |
Zacks Reports |
StockTalk |
News |
Chart |
Request a new note
C
A N
S L
I M
|
OPEN
-
NASDAQ
Opentable Inc
INTERNET - Internet Software and Services
|
$96.47
|
+2.17
2.30% |
$97.20
|
2,113,596
155.59% of 50 DAV
50 DAV is 1,358,400
|
$118.66
-18.70%
|
3/17/2011
|
$90.71
|
PP = $96.07
|
|
MB = $100.87
|
Most Recent Note - 5/10/2011 4:46:07 PM
Up today with above average volume for its third small gain marked by above average volume since a damaging gap down on 5/04/11 violating its 50 DMA line. That important short-term average may now act as resistance. It will be dropped from the Featured Stocks list tonight based on the recent technical damage noted.
>>> The latest Featured Stock Update with an annotated graph appeared on 4/25/2011. Click here.
View all notes |
Alert me of new notes |
CANSLIM.net Company Profile |
SEC |
Zacks Reports |
StockTalk |
News |
Chart |
Request a new note
C
A N
S L
I M
|
PAY
-
NYSE
Verifone Systems Inc
COMPUTER HARDWARE - Transaction Automation Systems
|
$51.86
|
+1.78
3.55% |
$51.86
|
1,712,099
68.67% of 50 DAV
50 DAV is 2,493,200
|
$58.88
-11.92%
|
4/29/2011
|
$54.73
|
PP = $58.98
|
|
MB = $61.93
|
Most Recent Note - 5/10/2011 4:21:16 PM
G - Technically, its 50 DMA line may now act as resistance. Up with lighter than average volume for the third session in a row. Subsequent gains above its short-term average would help its outlook.
>>> The latest Featured Stock Update with an annotated graph appeared on 5/4/2011. Click here.
View all notes |
Alert me of new notes |
CANSLIM.net Company Profile |
SEC |
Zacks Reports |
StockTalk |
News |
Chart |
Request a new note
C
A N
S L
I M
|
PCLN
-
NASDAQ
Priceline.Com Inc
INTERNET - Internet Software and Services
|
$528.50
|
-0.70
-0.13% |
$531.92
|
1,246,987
106.95% of 50 DAV
50 DAV is 1,166,000
|
$561.88
-5.94%
|
1/3/2011
|
$399.55
|
PP = $428.20
|
|
MB = $449.61
|
Most Recent Note - 5/9/2011 5:40:05 PM
G - Gain today halted its slide after a down week with damaging distributional losses. Its 50 DMA line defines important support to watch. Reported earnings +56% on +38% sales revenues fore the quarter ended March 31, 2011 versus the year ago period.
>>> The latest Featured Stock Update with an annotated graph appeared on 4/20/2011. Click here.
View all notes |
Alert me of new notes |
CANSLIM.net Company Profile |
SEC |
Zacks Reports |
StockTalk |
News |
Chart |
Request a new note
C
A N
S L
I M
|
Symbol/Exchange
Company Name
Industry Group |
PRICE |
CHANGE
(%Change) |
Day High |
Volume
(% DAV)
(% 50 day avg vol) |
52 Wk Hi
% From Hi |
Featured
Date |
Price
Featured |
Pivot Featured |
|
Max Buy |
RAX
-
NYSE
Rackspace Hosting Inc
INTERNET - Internet Software and; Services
|
$44.73
|
+1.46
3.37% |
$44.91
|
2,842,114
175.76% of 50 DAV
50 DAV is 1,617,000
|
$46.50
-3.80%
|
3/16/2011
|
$36.28
|
PP = $40.72
|
|
MB = $42.76
|
Most Recent Note - 5/10/2011 4:34:57 PM
G - Finished near the session high today with a gain on heavy volume after a gap down following a report that earnings rose +43% on +29% higher volume for the quarter ended March 31, 2011 versus the year ago period. It is above its "max buy" level and technically too extended from a proper buy point under the fact-based system. Important support to watch is at prior highs near $40 and its 50 DMA line, where violations would trigger technical sell signals.
>>> The latest Featured Stock Update with an annotated graph appeared on 4/18/2011. Click here.
View all notes |
Alert me of new notes |
CANSLIM.net Company Profile |
SEC |
Zacks Reports |
StockTalk |
News |
Chart |
Request a new note
C
A N
S L
I M
|
TIBX
-
NASDAQ
Tibco Software Inc
COMPUTER SOFTWARE and SERVICES - Business Software and Services
|
$30.50
|
+0.85
2.87% |
$30.70
|
2,662,059
103.39% of 50 DAV
50 DAV is 2,574,700
|
$30.45
0.16%
|
3/18/2011
|
$23.88
|
PP = $26.04
|
|
MB = $27.34
|
Most Recent Note - 5/10/2011 4:38:51 PM
G - Up today on near average volume for a new all-time high, technically getting more extended from a sound base pattern. Its 50 DMA line and recent chart low ($27.17) define important chart support to watch where violations may trigger sell signals.
>>> The latest Featured Stock Update with an annotated graph appeared on 4/14/2011. Click here.
View all notes |
Alert me of new notes |
CANSLIM.net Company Profile |
SEC |
Zacks Reports |
StockTalk |
News |
Chart |
Request a new note
C
A N
S L
I M
|
ULTA
-
NASDAQ
Ulta Salon Cosm & Frag
SPECIALTY RETAIL - Specialty Retail, Other
|
$55.05
|
+0.48
0.88% |
$55.44
|
371,469
61.26% of 50 DAV
50 DAV is 606,400
|
$55.70
-1.17%
|
1/6/2011
|
$36.12
|
PP = $37.34
|
|
MB = $39.21
|
Most Recent Note - 5/6/2011 1:32:57 PM
G - Hit another new all-time high today, getting more extended from any sound base pattern. Its 50 DMA line defines chart support to watch well above prior highs.
>>> The latest Featured Stock Update with an annotated graph appeared on 4/28/2011. Click here.
View all notes |
Alert me of new notes |
CANSLIM.net Company Profile |
SEC |
Zacks Reports |
StockTalk |
News |
Chart |
Request a new note
C
A N
S L
I M
|