You are not logged in.
This means you
CAN ONLY VIEW reports that were published prior to Tuesday, March 25, 2025.
You
MUST UPGRADE YOUR MEMBERSHIP if you want to see any current reports.
AFTER MARKET UPDATE - MONDAY, MAY 9TH, 2011
Previous After Market Report Next After Market Report >>>
|
|
|
|
DOW |
+45.94 |
12,684.68 |
+0.36% |
|
Volume |
778,483,200 |
-24% |
|
Volume |
1,613,213,530 |
-19% |
|
NASDAQ |
+15.69 |
2,843.25 |
+0.55% |
|
Advancers |
2,101 |
67% |
|
Advancers |
1,712 |
63% |
|
S&P 500 |
+6.09 |
1,346.29 |
+0.45% |
|
Decliners |
929 |
29% |
|
Decliners |
907 |
33% |
|
Russell 2000 |
+9.46 |
842.80 |
+1.14% |
|
52 Wk Highs |
120 |
|
|
52 Wk Highs |
81 |
|
|
S&P 600 |
+4.17 |
448.31 |
+0.94% |
|
52 Wk Lows |
17 |
|
|
52 Wk Lows |
39 |
|
|
 |
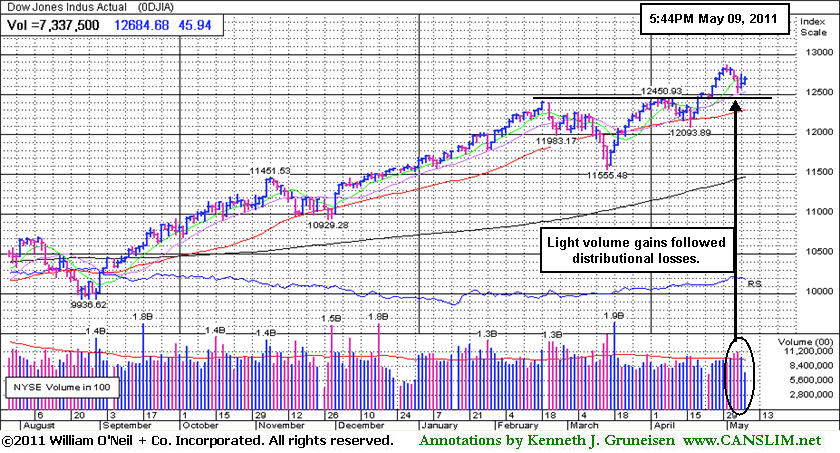
Major Averages Rise With Positive Breadth On Lighter Volume
Kenneth J. Gruneisen - Passed the CAN SLIM® Master's Exam
Rising commodities led to a light-volume advance on Monday. Advancing issues beat decliners by more than 2-1 on the NYSE and by nearly 2-1 on the Nasdaq exchange. Volume was reported lighter than the prior session total on the NYSE and on the Nasdaq exchange, suggesting that institutional investors were not aggressively accumulating stocks. New 52-week highs outnumbered new 52-week lows on the NYSE and on the Nasdaq exchange. There were 44 high-ranked companies from the CANSLIM.net Leaders List that made new 52-week highs and appeared on the CANSLIM.net BreakOuts Page, up from the total of 43 on the prior session. On the Featured Stocks Page there were gains from 17 of 18 the high-ranked market leaders currently listed.
Concerns about European debt were rekindled after Standard & Poor's lowered Greece's credit rating. Energy and mining stocks recovered some of last week's steep losses. Marathon Oil (MRO +5.3%) posted a solid gain as crude oil rallied above $102 a barrel to halt its five-day losing streak. Silver rebounded from its worst weekly slump in 35 years and gold rose on speculation investors will return to commodity markets.
Financial stocks were laggards as Citigroup (C -2.3%) slumped after completing a reverse 1-for-10 stock split. Food distributor Sysco Corporation (SYY +10.7%) spiked higher after revenue topped forecasts. Dollar Thrifty Automotive Group Inc. (DTG +13.8%) after Hertz Global Holdings, Inc. (HTZ -1.01%) boosted its bid for the car-rental company.
The May 2011 issue of CANSLIM.net News includes a comprehensive summary of market action, leading industry groups, the most action-worthy leaders, and more. Only upgraded members can access CANSLIM.net News.
PICTURED: The Dow Jones Industrial Average posted a gain on lighter volume today following distributional losses on higher volume last week.
|
 Kenneth J. Gruneisen started out as a licensed stockbroker in August 1987, a couple of months prior to the historic stock market crash that took the Dow Jones Industrial Average down -22.6% in a single day. He has published daily fact-based fundamental and technical analysis on high-ranked stocks online for two decades. Through FACTBASEDINVESTING.COM, Kenneth provides educational articles, news, market commentary, and other information regarding proven investment systems that work in good times and bad.
Comments contained in the body of this report are technical opinions only and are not necessarily those of Gruneisen Growth Corp. The material herein has been obtained from sources believed to be reliable and accurate, however, its accuracy and completeness cannot be guaranteed. Our firm, employees, and customers may effect transactions, including transactions contrary to any recommendation herein, or have positions in the securities mentioned herein or options with respect thereto. Any recommendation contained in this report may not be suitable for all investors and it is not to be deemed an offer or solicitation on our part with respect to the purchase or sale of any securities. |
|
 |
Commodity-Linked Groups and Heathcare Shares Rose
Kenneth J. Gruneisen - Passed the CAN SLIM® Master's Exam
Commodity-linked groups posted gains as the Gold & Silver Index ($XAU +2.15%), Oil Services Index ($OSX +2.15%), and Integrated Oil Index ($XOI +1.61%) rebounded from last week's losses. Financial shares continued to act as laggards and the Bank Index ($BKX -0.35%) and Broker/Dealer Index ($XBD -0.26%) ended with small losses. Meanwhile, the Healthcare Index ($HMO +1.11%) rallied and the Retail Index ($RLX +0.32%) posted a modest gain. The Semiconductor Index ($SOX -0.29%) sputtered lower while the Internet Index ($IIX +0.66%), Networking Index ($NWX +1.30%), and Biotechnology Index ($BTK +1.53%) led the tech sector higher.
Charts courtesy www.stockcharts.com
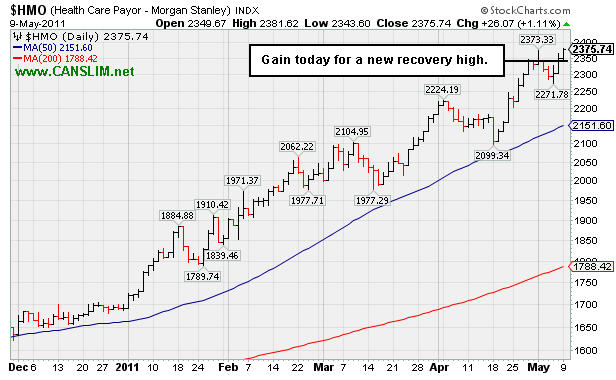
PICTURED: The Healthcare Index ($HMO +1.11%) posted a gain for a new recovery high.
| Oil Services |
$OSX |
266.93 |
+5.61 |
+2.15% |
+8.90% |
| Healthcare |
$HMO |
2,375.74 |
+26.07 |
+1.11% |
+40.41% |
| Integrated Oil |
$XOI |
1,329.20 |
+21.11 |
+1.61% |
+9.56% |
| Semiconductor |
$SOX |
442.36 |
-1.30 |
-0.29% |
+7.42% |
| Networking |
$NWX |
330.30 |
+4.23 |
+1.30% |
+17.73% |
| Internet |
$IIX |
323.29 |
+2.13 |
+0.66% |
+5.06% |
| Broker/Dealer |
$XBD |
118.66 |
-0.31 |
-0.26% |
-2.34% |
| Retail |
$RLX |
539.37 |
+1.72 |
+0.32% |
+6.10% |
| Gold & Silver |
$XAU |
206.53 |
+4.34 |
+2.15% |
-8.85% |
| Bank |
$BKX |
50.55 |
-0.18 |
-0.35% |
-3.18% |
| Biotech |
$BTK |
1,494.37 |
+22.57 |
+1.53% |
+15.16% |
|
|
|
 |
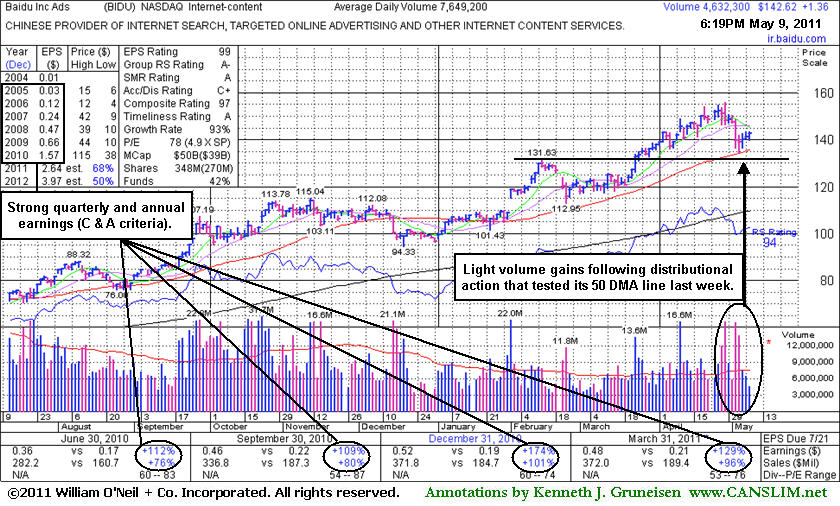
Quiet Gains Following Damaging Distributional Losses
Kenneth J. Gruneisen - Passed the CAN SLIM® Master's Exam
Baidu Inc. (BIDU +$1.36 or +0.96% to $142.62) posted a 3rd consecutive gain today on ever-quieter volume since halting its slide just above its 50-day moving average (DMA) line. Recent losses on heavy volume marked worrisome "distribution" that suggests institutional selling is becoming a greater concern. Prior high near $131 defines additional support to watch below its short-term average, and violations of its 50 DMA line and most recent chart lows could trigger technical sell signals. Since its last appearance in this FSU section on April 7th with an annotated graph under the headline, "Reassuring Signs Still Bode Well After Latest Breakout ", it rallied from $139.10 to a new all-time high of $156.04.
This company has maintained very strong quarterly and annual earnings (C and A criteria) history. Fundamentally, it is reassuring when its sales revenues and earnings increases have been impressive in the 4 most recent quarterly comparisons, solidly above the +25% guideline, and its latest quarter ended March 31, 2011 showed earnings +129% on +96% sales revenues versus the year ago period. Return On Equity reported at 55% also helps, as that is well above the 17% minimum guideline. The number of top-rated funds owning its shares rose from 835 in Mar '10 to to 1,062 in Mar '11, so investors have a reassuring sign concerning the I criteria.
|
|
|
Color Codes Explained :
Y - Better candidates highlighted by our
staff of experts.
G - Previously featured
in past reports as yellow but may no longer be buyable under the
guidelines.
***Last / Change / Volume data in this table is the closing quote data***
Symbol/Exchange
Company Name
Industry Group |
PRICE |
CHANGE
(%Change) |
Day High |
Volume
(% DAV)
(% 50 day avg vol) |
52 Wk Hi
% From Hi |
Featured
Date |
Price
Featured |
Pivot Featured |
|
Max Buy |
AIXG
-
NASDAQ
Aixtron Se
ELECTRONICS - Semiconductor Equipment andamp; Mate
|
$40.04
|
+0.24
0.60% |
$40.33
|
271,466
102.13% of 50 DAV
50 DAV is 265,800
|
$44.96
-10.94%
|
4/5/2011
|
$44.14
|
PP = $44.64
|
|
MB = $46.87
|
 Most Recent Note - 5/9/2011 5:33:35 PM
G - A rally above its 50 DMA line would help its outlook, technically. Recently struggling below that important short-term average near prior chart lows in the $38 area defining near-term support. More damaging losses would raise greater concerns. It faces overhead supply up through the $45 level.
>>> The latest Featured Stock Update with an annotated graph appeared on 5/6/2011. Click here.
View all notes |
Alert me of new notes |
CANSLIM.net Company Profile |
SEC |
Zacks Reports |
StockTalk |
News |
Chart |
Request a new note
C
A N
S L
I M


|
BIDU
-
NASDAQ
Baidu Inc Ads
INTERNET - Internet Information Providers
|
$142.62
|
+1.36
0.96% |
$143.33
|
4,636,280
60.61% of 50 DAV
50 DAV is 7,649,200
|
$156.04
-8.60%
|
3/17/2011
|
$121.97
|
PP = $131.73
|
|
MB = $138.32
|
Most Recent Note - 5/9/2011 5:36:08 PM
G - Posted a 3rd consecutive gain on ever quieter volume today. Halted its slide just above its 50 DMA line after recent losses on heavy volume marked worrisome distribution. Prior high near $131 defines additional support to watch below its short-term average.
>>> The latest Featured Stock Update with an annotated graph appeared on 5/9/2011. Click here.
View all notes |
Alert me of new notes |
CANSLIM.net Company Profile |
SEC |
Zacks Reports |
StockTalk |
News |
Chart |
Request a new note
C
A N
S L
I M
|
CMG
-
NYSE
Chipotle Mexican Grill
LEISURE - Restaurants
|
$266.41
|
-1.69
-0.63% |
$268.82
|
651,080
56.90% of 50 DAV
50 DAV is 1,144,200
|
$289.35
-7.93%
|
4/1/2011
|
$274.00
|
PP = $275.10
|
|
MB = $288.86
|
Most Recent Note - 5/9/2011 5:38:22 PM
G - Small loss on light volume today. Recently found support near its 50 DMA line after it negated its latest technical breakout.
>>> The latest Featured Stock Update with an annotated graph appeared on 4/13/2011. Click here.
View all notes |
Alert me of new notes |
CANSLIM.net Company Profile |
SEC |
Zacks Reports |
StockTalk |
News |
Chart |
Request a new note
C
A N
S L
I M
|
CTSH
-
NASDAQ
Cognizant Tech Sol Cl A
COMPUTER SOFTWARE and SERVICES - Business Software and Services
|
$77.42
|
+0.65
0.85% |
$78.00
|
1,416,035
56.87% of 50 DAV
50 DAV is 2,489,800
|
$83.48
-7.26%
|
2/7/2011
|
$75.09
|
PP = $76.46
|
|
MB = $80.28
|
Most Recent Note - 5/9/2011 5:22:15 PM
G - Small gain on light volume today, but a rally above its 50 DMA line is needed to help its outlook. A 5/03/11 gap down violating its 50 DMA line triggered a technical sell signal following earnings news. Increased earnings +34% on +43% sales revenues for the quarter ended March 31, 2011 versus the year ago period.
>>> The latest Featured Stock Update with an annotated graph appeared on 4/15/2011. Click here.
View all notes |
Alert me of new notes |
CANSLIM.net Company Profile |
SEC |
Zacks Reports |
StockTalk |
News |
Chart |
Request a new note
C
A N
S L
I M
|
EZPW
-
NASDAQ
Ezcorp Inc Cl A
SPECIALTY RETAIL - Specialty Retail, Other
|
$30.43
|
+0.81
2.73% |
$30.60
|
236,897
66.10% of 50 DAV
50 DAV is 358,400
|
$33.08
-8.01%
|
2/18/2011
|
$27.94
|
PP = $30.04
|
|
MB = $31.54
|
Most Recent Note - 5/9/2011 4:16:26 PM
G - Rallied up from its 50 DMA line today with a gain on lighter than average volume. After negating its recent breakout it has not formed a sound new base pattern.
>>> The latest Featured Stock Update with an annotated graph appeared on 4/11/2011. Click here.
View all notes |
Alert me of new notes |
CANSLIM.net Company Profile |
SEC |
Zacks Reports |
StockTalk |
News |
Chart |
Request a new note
C
A N
S L
I M
|
Symbol/Exchange
Company Name
Industry Group |
PRICE |
CHANGE
(%Change) |
Day High |
Volume
(% DAV)
(% 50 day avg vol) |
52 Wk Hi
% From Hi |
Featured
Date |
Price
Featured |
Pivot Featured |
|
Max Buy |
FOSL
-
NASDAQ
Fossil Inc
CONSUMER DURABLES - Recreational Goods, Other
|
$94.00
|
+0.88
0.95% |
$95.20
|
973,251
115.14% of 50 DAV
50 DAV is 845,300
|
$96.99
-3.08%
|
2/1/2011
|
$73.30
|
PP = $74.44
|
|
MB = $78.16
|
Most Recent Note - 5/9/2011 4:18:51 PM
G - Small gain today with above average volume. It could produce more climactic gains, but it is extended from any sound base. Consolidating above its 50 DMA line and prior chart highs defining support.
>>> The latest Featured Stock Update with an annotated graph appeared on 5/2/2011. Click here.
View all notes |
Alert me of new notes |
CANSLIM.net Company Profile |
SEC |
Zacks Reports |
StockTalk |
News |
Chart |
Request a new note
C
A N
S L
I M
|
HMSY
-
NASDAQ
H M S Holdings Corp
COMPUTER SOFTWARE and SERVICES - Healthcare Information Service
|
$77.87
|
+2.08
2.74% |
$78.36
|
290,005
166.29% of 50 DAV
50 DAV is 174,400
|
$84.82
-8.19%
|
11/19/2010
|
$61.89
|
PP = $63.01
|
|
MB = $66.16
|
Most Recent Note - 5/9/2011 4:23:10 PM
G - Closed near the high end of its intra-day range today with a solid gain on above average volume. A subsequent rebound above its 50 DMA line (now $79.94) would help its outlook, but that short-term average may now act as resistance.
>>> The latest Featured Stock Update with an annotated graph appeared on 4/26/2011. Click here.
View all notes |
Alert me of new notes |
CANSLIM.net Company Profile |
SEC |
Zacks Reports |
StockTalk |
News |
Chart |
Request a new note
C
A N
S L
I M
|
HS
-
NYSE
Healthspring Inc
HEALTH SERVICES - Health Care Plans
|
$43.21
|
+0.05
0.12% |
$43.29
|
487,812
53.69% of 50 DAV
50 DAV is 908,600
|
$44.47
-2.83%
|
3/22/2011
|
$38.29
|
PP = $38.85
|
|
MB = $40.79
|
Most Recent Note - 5/6/2011 1:29:00 PM
G - Gapped up today and hit a new 52-week high following a positive reversal on the prior session after gapping down and slumping toward prior highs. Its 50 DMA line defines important chart support.
>>> The latest Featured Stock Update with an annotated graph appeared on 4/21/2011. Click here.
View all notes |
Alert me of new notes |
CANSLIM.net Company Profile |
SEC |
Zacks Reports |
StockTalk |
News |
Chart |
Request a new note
C
A N
S L
I M
|
INFA
-
NASDAQ
Informatica Corp
COMPUTER SOFTWARE and SERVICES - Business Software and Services
|
$52.77
|
+0.34
0.65% |
$53.34
|
738,914
70.97% of 50 DAV
50 DAV is 1,041,200
|
$56.49
-6.59%
|
3/24/2011
|
$50.04
|
PP = $49.86
|
|
MB = $52.35
|
Most Recent Note - 5/6/2011 1:36:02 PM
G - Up today without great volume conviction, halting its slide after 4 consecutive losses indicative of mild distributional pressure. Prior highs in the $49 area and its 50 DMA line define important support to watch.
>>> The latest Featured Stock Update with an annotated graph appeared on 4/27/2011. Click here.
View all notes |
Alert me of new notes |
CANSLIM.net Company Profile |
SEC |
Zacks Reports |
StockTalk |
News |
Chart |
Request a new note
C
A N
S L
I M
|
LULU
-
NASDAQ
Lululemon Athletica
MANUFACTURING - Textile Manufacturing
|
$98.99
|
+4.04
4.25% |
$99.00
|
1,458,714
65.55% of 50 DAV
50 DAV is 2,225,300
|
$102.83
-3.73%
|
3/28/2011
|
$68.11
|
PP = $85.38
|
|
MB = $89.65
|
Most Recent Note - 5/9/2011 4:11:05 PM
G - Up today for a considerable gain on lighter than average volume and it closed near the session high. This high-ranked Retail-Apparel firm has been noted as extended from any sound base pattern. Prior highs and its 50 DMA line in the $85 area define important chart support to watch.
>>> The latest Featured Stock Update with an annotated graph appeared on 5/3/2011. Click here.
View all notes |
Alert me of new notes |
CANSLIM.net Company Profile |
SEC |
Zacks Reports |
StockTalk |
News |
Chart |
Request a new note
C
A N
S L
I M
|
Symbol/Exchange
Company Name
Industry Group |
PRICE |
CHANGE
(%Change) |
Day High |
Volume
(% DAV)
(% 50 day avg vol) |
52 Wk Hi
% From Hi |
Featured
Date |
Price
Featured |
Pivot Featured |
|
Max Buy |
MG
-
NYSE
Mistras Group Inc
DIVERSIFIED SERVICES - Bulding and Faci;ity Management Services
|
$17.19
|
+0.18
1.06% |
$17.40
|
193,493
109.50% of 50 DAV
50 DAV is 176,700
|
$18.46
-6.88%
|
3/15/2011
|
$15.48
|
PP = $15.90
|
|
MB = $16.70
|
Most Recent Note - 5/6/2011 1:26:34 PM
G - Gapped up today after pricing a new Public Offering at $16.00, repairing a 50 DMA violation that was noted earlier this week, helping its outlook improve.
>>> The latest Featured Stock Update with an annotated graph appeared on 4/12/2011. Click here.
View all notes |
Alert me of new notes |
CANSLIM.net Company Profile |
SEC |
Zacks Reports |
StockTalk |
News |
Chart |
Request a new note
C
A N
S L
I M
|
MWIV
-
NASDAQ
M W I Veterinary Supply
HEALTH SERVICES - Medical Instruments and; Supplies
|
$83.00
|
+1.80
2.22% |
$83.63
|
73,869
72.85% of 50 DAV
50 DAV is 101,400
|
$86.99
-4.59%
|
11/4/2010
|
$61.79
|
PP = $59.60
|
|
MB = $62.58
|
Most Recent Note - 5/9/2011 4:29:50 PM
G - Holding its ground near its all-time high. Extended from any sound base pattern now, its 50 DMA line defines important support to watch. Reported earnings +34% on +28% sales for the quarter ended March 31st.
>>> The latest Featured Stock Update with an annotated graph appeared on 5/5/2011. Click here.
View all notes |
Alert me of new notes |
CANSLIM.net Company Profile |
SEC |
Zacks Reports |
StockTalk |
News |
Chart |
Request a new note
C
A N
S L
I M
|
OPEN
-
NASDAQ
Opentable Inc
INTERNET - Internet Software and Services
|
$94.30
|
+3.60
3.97% |
$94.60
|
1,714,515
127.83% of 50 DAV
50 DAV is 1,341,200
|
$118.66
-20.53%
|
3/17/2011
|
$90.71
|
PP = $96.07
|
|
MB = $100.87
|
Most Recent Note - 5/9/2011 4:14:30 PM
G - Gain today with above average volume. Damaging violations of its 50 DMA line and recent lows with a noted gap down on 5/04/11 triggered technical sell signals. Reported earnings +87% on +59% sales revenues for the quarter ended March 31, 2011 versus the year ago period.
>>> The latest Featured Stock Update with an annotated graph appeared on 4/25/2011. Click here.
View all notes |
Alert me of new notes |
CANSLIM.net Company Profile |
SEC |
Zacks Reports |
StockTalk |
News |
Chart |
Request a new note
C
A N
S L
I M
|
PAY
-
NYSE
Verifone Systems Inc
COMPUTER HARDWARE - Transaction Automation Systems
|
$50.08
|
+0.29
0.58% |
$50.45
|
1,590,593
63.78% of 50 DAV
50 DAV is 2,493,900
|
$58.88
-14.95%
|
4/29/2011
|
$54.73
|
PP = $58.98
|
|
MB = $61.93
|
Most Recent Note - 5/6/2011 4:16:56 PM
G - Small gain today on lighter volume after halting its slide on the prior session. Damaging volume-driven losses this week violated its 50 DMA line and prior lows triggering technical sell signals. See the latest FSU analysis for more details and a new annotated graph.
>>> The latest Featured Stock Update with an annotated graph appeared on 5/4/2011. Click here.
View all notes |
Alert me of new notes |
CANSLIM.net Company Profile |
SEC |
Zacks Reports |
StockTalk |
News |
Chart |
Request a new note
C
A N
S L
I M
|
PCLN
-
NASDAQ
Priceline.Com Inc
INTERNET - Internet Software and Services
|
$529.20
|
+10.17
1.96% |
$532.00
|
1,230,004
105.49% of 50 DAV
50 DAV is 1,166,000
|
$561.88
-5.82%
|
1/3/2011
|
$399.55
|
PP = $428.20
|
|
MB = $449.61
|
Most Recent Note - 5/9/2011 5:40:05 PM
G - Gain today halted its slide after a down week with damaging distributional losses. Its 50 DMA line defines important support to watch. Reported earnings +56% on +38% sales revenues fore the quarter ended March 31, 2011 versus the year ago period.
>>> The latest Featured Stock Update with an annotated graph appeared on 4/20/2011. Click here.
View all notes |
Alert me of new notes |
CANSLIM.net Company Profile |
SEC |
Zacks Reports |
StockTalk |
News |
Chart |
Request a new note
C
A N
S L
I M
|
Symbol/Exchange
Company Name
Industry Group |
PRICE |
CHANGE
(%Change) |
Day High |
Volume
(% DAV)
(% 50 day avg vol) |
52 Wk Hi
% From Hi |
Featured
Date |
Price
Featured |
Pivot Featured |
|
Max Buy |
RAX
-
NYSE
Rackspace Hosting Inc
INTERNET - Internet Software and; Services
|
$43.27
|
+0.64
1.50% |
$43.75
|
1,705,980
105.99% of 50 DAV
50 DAV is 1,609,600
|
$46.50
-6.94%
|
3/16/2011
|
$36.28
|
PP = $40.72
|
|
MB = $42.76
|
Most Recent Note - 5/6/2011 5:30:26 PM
G - Gains on lighter than average volume halted its slide above support at prior highs near $40 and its 50 DMA line. Due to report earnings news after the close on Monday, May 9th.
>>> The latest Featured Stock Update with an annotated graph appeared on 4/18/2011. Click here.
View all notes |
Alert me of new notes |
CANSLIM.net Company Profile |
SEC |
Zacks Reports |
StockTalk |
News |
Chart |
Request a new note
C
A N
S L
I M
|
TIBX
-
NASDAQ
Tibco Software Inc
COMPUTER SOFTWARE and SERVICES - Business Software and Services
|
$29.65
|
+0.91
3.17% |
$30.26
|
3,375,652
133.24% of 50 DAV
50 DAV is 2,533,600
|
$30.45
-2.63%
|
3/18/2011
|
$23.88
|
PP = $26.04
|
|
MB = $27.34
|
Most Recent Note - 5/9/2011 12:28:15 PM
G - Gain today has it challenging its all-time high after last week's streak of mild distributional losses. Prior highs and its 50 DMA line define important chart support near the $26 level.
>>> The latest Featured Stock Update with an annotated graph appeared on 4/14/2011. Click here.
View all notes |
Alert me of new notes |
CANSLIM.net Company Profile |
SEC |
Zacks Reports |
StockTalk |
News |
Chart |
Request a new note
C
A N
S L
I M
|
ULTA
-
NASDAQ
Ulta Salon Cosm & Frag
SPECIALTY RETAIL - Specialty Retail, Other
|
$54.57
|
+0.80
1.49% |
$54.82
|
224,230
36.77% of 50 DAV
50 DAV is 609,900
|
$55.70
-2.03%
|
1/6/2011
|
$36.12
|
PP = $37.34
|
|
MB = $39.21
|
Most Recent Note - 5/6/2011 1:32:57 PM
G - Hit another new all-time high today, getting more extended from any sound base pattern. Its 50 DMA line defines chart support to watch well above prior highs.
>>> The latest Featured Stock Update with an annotated graph appeared on 4/28/2011. Click here.
View all notes |
Alert me of new notes |
CANSLIM.net Company Profile |
SEC |
Zacks Reports |
StockTalk |
News |
Chart |
Request a new note
C
A N
S L
I M
|
|
|
|
THESE ARE NOT BUY RECOMMENDATIONS!
Comments contained in the body of this report are technical
opinions only. The material herein has been obtained
from sources believed to be reliable and accurate, however,
its accuracy and completeness cannot be guaranteed.
This site is not an investment advisor, hence it does
not endorse or recommend any securities or other investments.
Any recommendation contained in this report may not
be suitable for all investors and it is not to be deemed
an offer or solicitation on our part with respect to
the purchase or sale of any securities. All trademarks,
service marks and trade names appearing in this report
are the property of their respective owners, and are
likewise used for identification purposes only.
This report is a service available
only to active Paid Premium Members.
You may opt-out of receiving report notifications
at any time. Questions or comments may be submitted
by writing to Premium Membership Services 665 S.E. 10 Street, Suite 201 Deerfield Beach, FL 33441-5634 or by calling 1-800-965-8307
or 954-785-1121.
|
|
|

