You are not logged in.
This means you
CAN ONLY VIEW reports that were published prior to Tuesday, April 15, 2025.
You
MUST UPGRADE YOUR MEMBERSHIP if you want to see any current reports.
AFTER MARKET UPDATE - FRIDAY, MAY 6TH, 2011
Previous After Market Report Next After Market Report >>>
|
|
|
|
DOW |
+54.57 |
12,638.74 |
+0.43% |
|
Volume |
1,026,809,970 |
-9% |
|
Volume |
1,986,513,540 |
-8% |
|
NASDAQ |
+12.84 |
2,827.56 |
+0.46% |
|
Advancers |
1,992 |
64% |
|
Advancers |
1,550 |
57% |
|
S&P 500 |
+5.10 |
1,340.20 |
+0.38% |
|
Decliners |
1,017 |
33% |
|
Decliners |
1,024 |
38% |
|
Russell 2000 |
+4.10 |
833.34 |
+0.49% |
|
52 Wk Highs |
133 |
|
|
52 Wk Highs |
68 |
|
|
S&P 600 |
+1.82 |
444.14 |
+0.41% |
|
52 Wk Lows |
15 |
|
|
52 Wk Lows |
36 |
|
|
 |
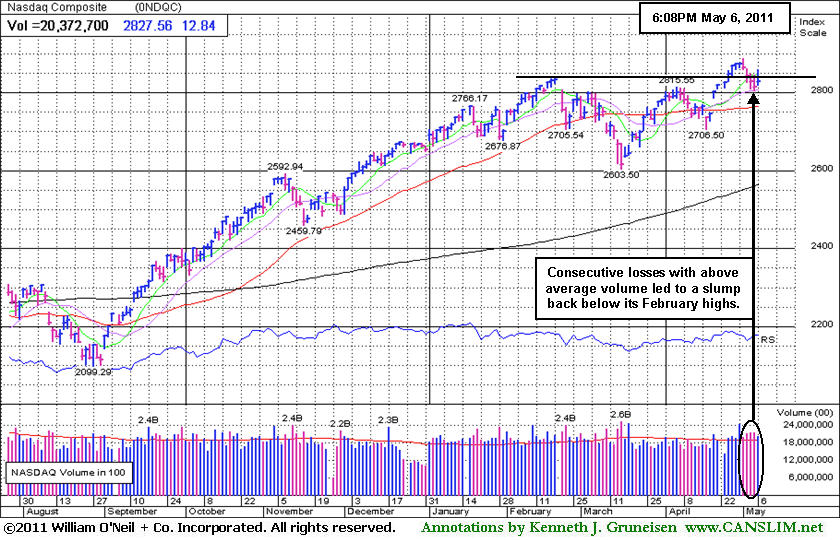
Indices Rebound With Lighter Volume Conviction Behind Gains
Kenneth J. Gruneisen - Passed the CAN SLIM® Master's Exam
For the week, the Dow Jones Industrial Average lost -1.3%, the S&P 500 Index fell -1.7%, and the Nasdaq Composite Index was down -1.6%. On Friday advancing issues beat decliners by nearly 2-1 on the NYSE and by 3-2 on the Nasdaq exchange. Volume was reported lighter than the prior session total on the NYSE and on the Nasdaq exchange, suggesting that institutional investors were not aggressively accumulating stocks. New 52-week highs outnumbered new 52-week lows on the NYSE and on the Nasdaq exchange. There were 43 high-ranked companies from the CANSLIM.net Leaders List that made new 52-week highs and appeared on the CANSLIM.net BreakOuts Page, up from the total of 29 on the prior session. On the Featured Stocks Page there were gains from 14 of 18 the high-ranked market leaders currently listed. Recent commentaries have repeatedly observed, "New set-ups with strong characteristics and fresh breakouts from high-ranked leaders have been scarce in recent weeks, even while the major averages have rallied."
A better-than-expected jobs report lifted the stock market today. American employers added more jobs than forecast in April, a sign the economy is weathering the impact of higher fuel prices. Non-farm payrolls expanded 244,000, the biggest gain in almost a year. Analysts had been looking for an increase of 185,000. The unemployment rate rose to 9.0% from 8.8% in March as more people tried to find work.
European debt concerns re-emerged during the afternoon. A report that Greece may leave the euro zone appeared to rattle investors. The euro lost more ground against the dollar, and the price of oil closed below $98 per barrel.
Industrial companies were market leaders. Kraft Foods inc (KFT +2.07%) rose after serving up better-than-expected earnings.
The newspaper has described the conditions concerning the M criteria as an "uptrend under pressure" after recent market weakness. This does not mean to run out and sell every stock you own, however, when the market is under pressure, it is not considered the best time to be entering new positions. Pundits have said that valuations are an increasing concern after last week's rally lifted the benchmark S&P 500 Index close to a three-year high. Last week the Nasdaq Composite Index had finally topped its October 2007 high. The S&P Mid-Cap 400 Index and S&P Small-Cap 600 Index both are consolidating after having rallied to all-time highs.
The May 2011 issue of CANSLIM.net News was just released! CANSLIM.net News includes a comprehensive summary of market action, leading industry groups, the most action-worthy leaders, and more. Only upgraded members can access CANSLIM.net News.
PICTURED: The Nasdaq Composite Index posted a gain on Friday with lighter (still above average) volume after consecutive losses with above average volume this week led to a slump back below its February highs.
|
 Kenneth J. Gruneisen started out as a licensed stockbroker in August 1987, a couple of months prior to the historic stock market crash that took the Dow Jones Industrial Average down -22.6% in a single day. He has published daily fact-based fundamental and technical analysis on high-ranked stocks online for two decades. Through FACTBASEDINVESTING.COM, Kenneth provides educational articles, news, market commentary, and other information regarding proven investment systems that work in good times and bad.
Comments contained in the body of this report are technical opinions only and are not necessarily those of Gruneisen Growth Corp. The material herein has been obtained from sources believed to be reliable and accurate, however, its accuracy and completeness cannot be guaranteed. Our firm, employees, and customers may effect transactions, including transactions contrary to any recommendation herein, or have positions in the securities mentioned herein or options with respect thereto. Any recommendation contained in this report may not be suitable for all investors and it is not to be deemed an offer or solicitation on our part with respect to the purchase or sale of any securities. |
|
 |
Medical-Related Issues Led Gainers
Kenneth J. Gruneisen - Passed the CAN SLIM® Master's Exam
The Healthcare Index ($HMO +2.07%) and Biotechnology Index ($BTK +2.08%) were standout gainers on Friday. The Broker/Dealer Index ($XBD +0.80%) and Bank Index ($BKX +0.20%) posted small gains, meanwhile the Retail Index ($RLX -0.41%) was a negative influence on the major averages. The tech sector was mixed as the Networking Index ($NWX -0.53%) edged lower, yet the Semiconductor Index ($SOX +0.75%) posted a gain and Internet Index ($IIX +0.13%) inched higher. Commodity-linked areas had a quiet day after a sliding sharply for the week as the Oil Services Index ($OSX -0.21%) inched lower and the Integrated Oil Index ($XOI +0.49%) and Gold & Silver Index ($XAU +0.30%) posted small gains.
Charts courtesy www.stockcharts.com
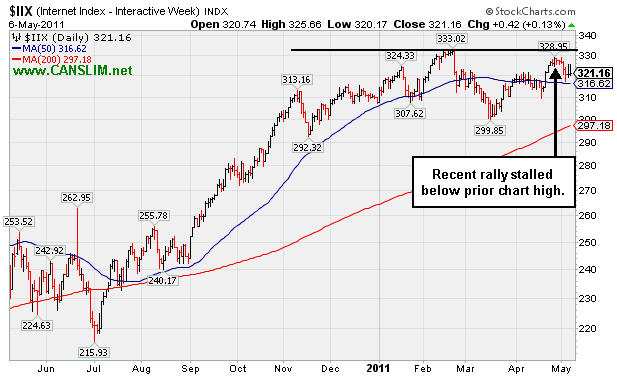
PICTURED: The Internet Index ($IIX +0.13%) reecently stalled below a prior chart high. It is still in healthy shape above its 50-day moving average (DMA) line.
| Oil Services |
$OSX |
261.32 |
-0.56 |
-0.21% |
+6.61% |
| Healthcare |
$HMO |
2,349.67 |
+47.67 |
+2.07% |
+38.87% |
| Integrated Oil |
$XOI |
1,308.09 |
+6.40 |
+0.49% |
+7.82% |
| Semiconductor |
$SOX |
443.66 |
+3.31 |
+0.75% |
+7.73% |
| Networking |
$NWX |
326.07 |
-1.74 |
-0.53% |
+16.22% |
| Internet |
$IIX |
321.16 |
+0.42 |
+0.13% |
+4.36% |
| Broker/Dealer |
$XBD |
118.98 |
+0.95 |
+0.80% |
-2.09% |
| Retail |
$RLX |
537.65 |
-2.24 |
-0.41% |
+5.76% |
| Gold & Silver |
$XAU |
202.19 |
+0.61 |
+0.30% |
-10.76% |
| Bank |
$BKX |
50.73 |
+0.10 |
+0.20% |
-2.83% |
| Biotech |
$BTK |
1,471.80 |
+30.00 |
+2.08% |
+13.42% |
|
|
|
 |
Relative Strength Waning; Breakout Never Materialized
Kenneth J. Gruneisen - Passed the CAN SLIM® Master's Exam
Aixtron Se (AIXG +$0.43 or +1.09% to $39.80) posted a gain on lighter volume today and ended in the lower part of its intra-day range following the prior session's gap down and loss on heavier volume. While sputtering below its 50-day moving (DMA) line, prior chart lows in the $38 area define support to watch. More damaging losses would raise greater concerns. Meanwhile, it faces overhead supply up through the $45 level that may hinder its progress. Since its last appearance in this FSU section on 4/05/11 with an annotated graph under the headline, "German Semiconductor Equipment Firm Perched at High", it failed to produce the necessary volume-driven gains above its pivot point to trigger a proper technical buy signal. As we have often reminded folks, disciplined investors watch for proof of institutional buying demand and avoid the urge to get in "early".
Its Accumulation/Distribution rating has slumped to a D and its Relative Strength rank has slumped to 72, below the 80+ guideline for buy candidates. It is perched -11.5% off its 52-week high and trading near prior lows in the $38 area defining important support well above its 200 DMA line. Prior mid-day reports noted - "This German firm is a high-ranked Electronics - Semiconductor Equipment company that has shown impressive earnings growth in recent years. Quarterly sales and earnings results in recent comparisons have been strong enough to satisfy the C criteria but showing sequential deceleration. Consensus earnings estimates calling for FY '11 earnings to grow by only +4% are also cause for some concern."

|
|
|
Color Codes Explained :
Y - Better candidates highlighted by our
staff of experts.
G - Previously featured
in past reports as yellow but may no longer be buyable under the
guidelines.
***Last / Change / Volume data in this table is the closing quote data***
Symbol/Exchange
Company Name
Industry Group |
PRICE |
CHANGE
(%Change) |
Day High |
Volume
(% DAV)
(% 50 day avg vol) |
52 Wk Hi
% From Hi |
Featured
Date |
Price
Featured |
Pivot Featured |
|
Max Buy |
AIXG
-
NASDAQ
Aixtron Se
ELECTRONICS - Semiconductor Equipment andamp; Mate
|
$39.80
|
+0.43
1.09% |
$40.81
|
220,322
83.33% of 50 DAV
50 DAV is 264,400
|
$44.96
-11.48%
|
4/5/2011
|
$44.14
|
PP = $44.64
|
|
MB = $46.87
|
Most Recent Note - 5/5/2011 6:34:41 PM
G - Gapped down today for a loss on even heavier volume, slumping further below its 50 DMA line and finishing near prior chart lows in the $38 area defining support. More damaging losses would raise greater concerns. It faces overhead supply up through the $45 level.
>>> The latest Featured Stock Update with an annotated graph appeared on 5/6/2011. Click here.
View all notes |
Alert me of new notes |
CANSLIM.net Company Profile |
SEC |
Zacks Reports |
StockTalk |
News |
Chart |
Request a new note
C
A N
S L
I M


|
BIDU
-
NASDAQ
Baidu Inc Ads
INTERNET - Internet Information Providers
|
$141.26
|
+1.07
0.76% |
$143.51
|
6,627,466
86.61% of 50 DAV
50 DAV is 7,652,500
|
$156.04
-9.47%
|
3/17/2011
|
$121.97
|
PP = $131.73
|
|
MB = $138.32
|
Most Recent Note - 5/5/2011 6:36:16 PM
G - Gain on very quiet volume today halted its slide just above its 50 DMA line today. Recent losses on heavy volume marked worrisome distributional action while pulling back. Prior high near $131 defines additional support to watch below its short-term average.
>>> The latest Featured Stock Update with an annotated graph appeared on 4/7/2011. Click here.
View all notes |
Alert me of new notes |
CANSLIM.net Company Profile |
SEC |
Zacks Reports |
StockTalk |
News |
Chart |
Request a new note
C
A N
S L
I M
|
CMG
-
NYSE
Chipotle Mexican Grill
LEISURE - Restaurants
|
$268.10
|
+2.33
0.88% |
$272.46
|
851,353
74.19% of 50 DAV
50 DAV is 1,147,500
|
$289.35
-7.34%
|
4/1/2011
|
$274.00
|
PP = $275.10
|
|
MB = $288.86
|
Most Recent Note - 5/5/2011 6:37:46 PM
G - Gain on light volume today after a positive reversal on 5/04/11 near its 50 DMA line. It recently negated its latest technical breakout, and it is now perched -8% off its 52-week high.
>>> The latest Featured Stock Update with an annotated graph appeared on 4/13/2011. Click here.
View all notes |
Alert me of new notes |
CANSLIM.net Company Profile |
SEC |
Zacks Reports |
StockTalk |
News |
Chart |
Request a new note
C
A N
S L
I M
|
CTSH
-
NASDAQ
Cognizant Tech Sol Cl A
COMPUTER SOFTWARE and SERVICES - Business Software and Services
|
$76.77
|
+0.25
0.33% |
$78.29
|
3,411,944
137.60% of 50 DAV
50 DAV is 2,479,600
|
$83.48
-8.04%
|
2/7/2011
|
$75.09
|
PP = $76.46
|
|
MB = $80.28
|
Most Recent Note - 5/4/2011 8:09:39 PM
G - Small loss on above average volume today after a 5/03/11 gap down violating its 50 DMA line triggered a technical sell signal following earnings news. Increased earnings +34% on +43% sales revenues for the quarter ended March 31, 2011 versus the year ago period.
>>> The latest Featured Stock Update with an annotated graph appeared on 4/15/2011. Click here.
View all notes |
Alert me of new notes |
CANSLIM.net Company Profile |
SEC |
Zacks Reports |
StockTalk |
News |
Chart |
Request a new note
C
A N
S L
I M
|
EZPW
-
NASDAQ
Ezcorp Inc Cl A
SPECIALTY RETAIL - Specialty Retail, Other
|
$29.62
|
-0.04
-0.13% |
$30.26
|
203,336
55.95% of 50 DAV
50 DAV is 363,400
|
$33.08
-10.46%
|
2/18/2011
|
$27.94
|
PP = $30.04
|
|
MB = $31.54
|
Most Recent Note - 5/4/2011 2:17:46 PM
G - Slumping near its 50 DMA line again. After negating its recent breakout it has not formed a sound new base pattern.
>>> The latest Featured Stock Update with an annotated graph appeared on 4/11/2011. Click here.
View all notes |
Alert me of new notes |
CANSLIM.net Company Profile |
SEC |
Zacks Reports |
StockTalk |
News |
Chart |
Request a new note
C
A N
S L
I M
|
Symbol/Exchange
Company Name
Industry Group |
PRICE |
CHANGE
(%Change) |
Day High |
Volume
(% DAV)
(% 50 day avg vol) |
52 Wk Hi
% From Hi |
Featured
Date |
Price
Featured |
Pivot Featured |
|
Max Buy |
FOSL
-
NASDAQ
Fossil Inc
CONSUMER DURABLES - Recreational Goods, Other
|
$93.12
|
+0.01
0.01% |
$95.23
|
599,726
70.33% of 50 DAV
50 DAV is 852,700
|
$96.99
-3.99%
|
2/1/2011
|
$73.30
|
PP = $74.44
|
|
MB = $78.16
|
Most Recent Note - 5/4/2011 2:27:32 PM
G - It could produce more climactic gains, but it is extended from any sound base. It is consolidating in a healthy manner above its 50 DMA line and prior chart highs defining support. See latest FSU analysis for more details and a new annotated graph.
>>> The latest Featured Stock Update with an annotated graph appeared on 5/2/2011. Click here.
View all notes |
Alert me of new notes |
CANSLIM.net Company Profile |
SEC |
Zacks Reports |
StockTalk |
News |
Chart |
Request a new note
C
A N
S L
I M
|
HMSY
-
NASDAQ
H M S Holdings Corp
COMPUTER SOFTWARE and SERVICES - Healthcare Information Service
|
$75.79
|
+0.34
0.45% |
$76.12
|
200,725
115.09% of 50 DAV
50 DAV is 174,400
|
$84.82
-10.65%
|
11/19/2010
|
$61.89
|
PP = $63.01
|
|
MB = $66.16
|
Most Recent Note - 5/4/2011 8:16:06 PM
G - Closed in the lower half of its intra-day range today with a 4th consecutive loss with above average volume Violated its 50 DMA line last week with a loss on heavy volume triggering a technical sell signal. Reported earnings +26% on +27% sales revenues for the quarter ended March 31, 2011 versus the year ago period.
>>> The latest Featured Stock Update with an annotated graph appeared on 4/26/2011. Click here.
View all notes |
Alert me of new notes |
CANSLIM.net Company Profile |
SEC |
Zacks Reports |
StockTalk |
News |
Chart |
Request a new note
C
A N
S L
I M
|
HS
-
NYSE
Healthspring Inc
HEALTH SERVICES - Health Care Plans
|
$43.16
|
+1.07
2.54% |
$44.47
|
998,306
110.32% of 50 DAV
50 DAV is 904,900
|
$44.37
-2.73%
|
3/22/2011
|
$38.29
|
PP = $38.85
|
|
MB = $40.79
|
 Most Recent Note - 5/6/2011 1:29:00 PM
G - Gapped up today and hit a new 52-week high following a positive reversal on the prior session after gapping down and slumping toward prior highs. Its 50 DMA line defines important chart support.
>>> The latest Featured Stock Update with an annotated graph appeared on 4/21/2011. Click here.
View all notes |
Alert me of new notes |
CANSLIM.net Company Profile |
SEC |
Zacks Reports |
StockTalk |
News |
Chart |
Request a new note
C
A N
S L
I M
|
INFA
-
NASDAQ
Informatica Corp
COMPUTER SOFTWARE and SERVICES - Business Software and Services
|
$52.43
|
+0.90
1.75% |
$53.34
|
763,754
73.06% of 50 DAV
50 DAV is 1,045,400
|
$56.49
-7.19%
|
3/24/2011
|
$50.04
|
PP = $49.86
|
|
MB = $52.35
|
Most Recent Note - 5/6/2011 1:36:02 PM
G - Up today without great volume conviction, halting its slide after 4 consecutive losses indicative of mild distributional pressure. Prior highs in the $49 area and its 50 DMA line define important support to watch.
>>> The latest Featured Stock Update with an annotated graph appeared on 4/27/2011. Click here.
View all notes |
Alert me of new notes |
CANSLIM.net Company Profile |
SEC |
Zacks Reports |
StockTalk |
News |
Chart |
Request a new note
C
A N
S L
I M
|
LULU
-
NASDAQ
Lululemon Athletica
MANUFACTURING - Textile Manufacturing
|
$94.95
|
+0.96
1.02% |
$96.93
|
946,545
42.01% of 50 DAV
50 DAV is 2,253,400
|
$102.83
-7.66%
|
3/28/2011
|
$68.11
|
PP = $85.38
|
|
MB = $89.65
|
Most Recent Note - 5/6/2011 5:34:09 PM
G - Small gains on lighter volume closed the week following a bout of mild distributional pressure. This high-ranked Retail-Apparel firm has been noted as extended from any sound base pattern. Prior highs and its 50 DMA line in the $85 area define important chart support to watch.
>>> The latest Featured Stock Update with an annotated graph appeared on 5/3/2011. Click here.
View all notes |
Alert me of new notes |
CANSLIM.net Company Profile |
SEC |
Zacks Reports |
StockTalk |
News |
Chart |
Request a new note
C
A N
S L
I M
|
Symbol/Exchange
Company Name
Industry Group |
PRICE |
CHANGE
(%Change) |
Day High |
Volume
(% DAV)
(% 50 day avg vol) |
52 Wk Hi
% From Hi |
Featured
Date |
Price
Featured |
Pivot Featured |
|
Max Buy |
MG
-
NYSE
Mistras Group Inc
DIVERSIFIED SERVICES - Bulding and Faci;ity Management Services
|
$17.01
|
+1.01
6.31% |
$17.25
|
2,023,461
1,453.64% of 50 DAV
50 DAV is 139,200
|
$18.46
-7.85%
|
3/15/2011
|
$15.48
|
PP = $15.90
|
|
MB = $16.70
|
Most Recent Note - 5/6/2011 1:26:34 PM
G - Gapped up today after pricing a new Public Offering at $16.00, repairing a 50 DMA violation that was noted earlier this week, helping its outlook improve.
>>> The latest Featured Stock Update with an annotated graph appeared on 4/12/2011. Click here.
View all notes |
Alert me of new notes |
CANSLIM.net Company Profile |
SEC |
Zacks Reports |
StockTalk |
News |
Chart |
Request a new note
C
A N
S L
I M
|
MWIV
-
NASDAQ
M W I Veterinary Supply
HEALTH SERVICES - Medical Instruments and; Supplies
|
$81.20
|
-0.78
-0.95% |
$84.60
|
118,669
117.49% of 50 DAV
50 DAV is 101,000
|
$86.99
-6.66%
|
11/4/2010
|
$61.79
|
PP = $59.60
|
|
MB = $62.58
|
Most Recent Note - 5/5/2011 6:44:07 PM
G - Hit a new all-time high today but closed in the lower half of its intra-day range. Reported earnings +34% on +28% sales for the quarter ended March 31st. Extended from any sound base pattern now. Its 50 DMA line defines important support to watch. See the latest FSU analysis for more details and a new annotated graph.
>>> The latest Featured Stock Update with an annotated graph appeared on 5/5/2011. Click here.
View all notes |
Alert me of new notes |
CANSLIM.net Company Profile |
SEC |
Zacks Reports |
StockTalk |
News |
Chart |
Request a new note
C
A N
S L
I M
|
OPEN
-
NASDAQ
Opentable Inc
INTERNET - Internet Software and Services
|
$90.70
|
-0.28
-0.31% |
$93.00
|
1,046,491
77.74% of 50 DAV
50 DAV is 1,346,200
|
$118.66
-23.56%
|
3/17/2011
|
$90.71
|
PP = $96.07
|
|
MB = $100.87
|
Most Recent Note - 5/5/2011 6:47:18 PM
G - Held its ground today after damaging violations of its 50 DMA line and recent lows triggered technical sell signals. Reported earnings +87% on +59% sales revenues for the quarter ended March 31, 2011 versus the year ago period.
>>> The latest Featured Stock Update with an annotated graph appeared on 4/25/2011. Click here.
View all notes |
Alert me of new notes |
CANSLIM.net Company Profile |
SEC |
Zacks Reports |
StockTalk |
News |
Chart |
Request a new note
C
A N
S L
I M
|
PAY
-
NYSE
Verifone Systems Inc
COMPUTER HARDWARE - Transaction Automation Systems
|
$49.79
|
+0.69
1.41% |
$50.76
|
1,407,192
56.31% of 50 DAV
50 DAV is 2,498,900
|
$58.88
-15.44%
|
4/29/2011
|
$54.73
|
PP = $58.98
|
|
MB = $61.93
|
Most Recent Note - 5/6/2011 4:16:56 PM
G - Small gain today on lighter volume after halting its slide on the prior session. Damaging volume-driven losses this week violated its 50 DMA line and prior lows triggering technical sell signals. See the latest FSU analysis for more details and a new annotated graph.
>>> The latest Featured Stock Update with an annotated graph appeared on 5/4/2011. Click here.
View all notes |
Alert me of new notes |
CANSLIM.net Company Profile |
SEC |
Zacks Reports |
StockTalk |
News |
Chart |
Request a new note
C
A N
S L
I M
|
PCLN
-
NASDAQ
Priceline.Com Inc
INTERNET - Internet Software and Services
|
$519.03
|
-14.94
-2.80% |
$540.93
|
3,351,869
282.10% of 50 DAV
50 DAV is 1,188,200
|
$561.88
-7.63%
|
1/3/2011
|
$399.55
|
PP = $428.20
|
|
MB = $449.61
|
Most Recent Note - 5/6/2011 4:24:49 PM
G - Down today with nearly 3 times average volume, capping a down week with a damaging distributional loss. Its 50 DMA line defines important support to watch. Reported earnings +56% on +38% sales revenues fore the quarter ended March 31, 2011 versus the year ago period.
>>> The latest Featured Stock Update with an annotated graph appeared on 4/20/2011. Click here.
View all notes |
Alert me of new notes |
CANSLIM.net Company Profile |
SEC |
Zacks Reports |
StockTalk |
News |
Chart |
Request a new note
C
A N
S L
I M
|
Symbol/Exchange
Company Name
Industry Group |
PRICE |
CHANGE
(%Change) |
Day High |
Volume
(% DAV)
(% 50 day avg vol) |
52 Wk Hi
% From Hi |
Featured
Date |
Price
Featured |
Pivot Featured |
|
Max Buy |
RAX
-
NYSE
Rackspace Hosting Inc
INTERNET - Internet Software and; Services
|
$42.63
|
+0.58
1.38% |
$43.25
|
1,322,951
82.13% of 50 DAV
50 DAV is 1,610,800
|
$46.50
-8.31%
|
3/16/2011
|
$36.28
|
PP = $40.72
|
|
MB = $42.76
|
Most Recent Note - 5/6/2011 5:30:26 PM
G - Gains on lighter than average volume halted its slide above support at prior highs near $40 and its 50 DMA line. Due to report earnings news after the close on Monday, May 9th.
>>> The latest Featured Stock Update with an annotated graph appeared on 4/18/2011. Click here.
View all notes |
Alert me of new notes |
CANSLIM.net Company Profile |
SEC |
Zacks Reports |
StockTalk |
News |
Chart |
Request a new note
C
A N
S L
I M
|
TIBX
-
NASDAQ
Tibco Software Inc
COMPUTER SOFTWARE and SERVICES - Business Software and Services
|
$28.74
|
+1.18
4.28% |
$28.94
|
2,677,826
104.43% of 50 DAV
50 DAV is 2,564,300
|
$30.45
-5.62%
|
3/18/2011
|
$23.88
|
PP = $26.04
|
|
MB = $27.34
|
Most Recent Note - 5/6/2011 1:31:33 PM
G - Gapped up today after pulling back from its all-time high with 4 consecutive losses. Prior highs and its 50 DMA line define important chart support near the $26 level.
>>> The latest Featured Stock Update with an annotated graph appeared on 4/14/2011. Click here.
View all notes |
Alert me of new notes |
CANSLIM.net Company Profile |
SEC |
Zacks Reports |
StockTalk |
News |
Chart |
Request a new note
C
A N
S L
I M
|
ULTA
-
NASDAQ
Ulta Salon Cosm & Frag
SPECIALTY RETAIL - Specialty Retail, Other
|
$53.77
|
+0.64
1.20% |
$55.70
|
602,928
99.05% of 50 DAV
50 DAV is 608,700
|
$54.22
-0.83%
|
1/6/2011
|
$36.12
|
PP = $37.34
|
|
MB = $39.21
|
Most Recent Note - 5/6/2011 1:32:57 PM
G - Hit another new all-time high today, getting more extended from any sound base pattern. Its 50 DMA line defines chart support to watch well above prior highs.
>>> The latest Featured Stock Update with an annotated graph appeared on 4/28/2011. Click here.
View all notes |
Alert me of new notes |
CANSLIM.net Company Profile |
SEC |
Zacks Reports |
StockTalk |
News |
Chart |
Request a new note
C
A N
S L
I M
|
|
|
|
THESE ARE NOT BUY RECOMMENDATIONS!
Comments contained in the body of this report are technical
opinions only. The material herein has been obtained
from sources believed to be reliable and accurate, however,
its accuracy and completeness cannot be guaranteed.
This site is not an investment advisor, hence it does
not endorse or recommend any securities or other investments.
Any recommendation contained in this report may not
be suitable for all investors and it is not to be deemed
an offer or solicitation on our part with respect to
the purchase or sale of any securities. All trademarks,
service marks and trade names appearing in this report
are the property of their respective owners, and are
likewise used for identification purposes only.
This report is a service available
only to active Paid Premium Members.
You may opt-out of receiving report notifications
at any time. Questions or comments may be submitted
by writing to Premium Membership Services 665 S.E. 10 Street, Suite 201 Deerfield Beach, FL 33441-5634 or by calling 1-800-965-8307
or 954-785-1121.
|
|
|

