You are not logged in.
This means you
CAN ONLY VIEW reports that were published prior to Monday, April 14, 2025.
You
MUST UPGRADE YOUR MEMBERSHIP if you want to see any current reports.
AFTER MARKET UPDATE - THURSDAY, MAY 8TH, 2014
Previous After Market Report Next After Market Report >>>
|
|
|
|
DOW |
+32.43 |
16,550.97 |
+0.20% |
|
Volume |
678,951,540 |
-9% |
|
Volume |
2,256,413,930 |
-2% |
|
NASDAQ |
-16.17 |
4,051.50 |
-0.40% |
|
Advancers |
1,284 |
40% |
|
Advancers |
952 |
33% |
|
S&P 500 |
-2.58 |
1,875.63 |
-0.14% |
|
Decliners |
1,787 |
56% |
|
Decliners |
1,879 |
65% |
|
Russell 2000 |
-11.12 |
1,097.43 |
-1.00% |
|
52 Wk Highs |
153 |
|
|
52 Wk Highs |
54 |
|
|
S&P 600 |
-5.32 |
637.59 |
-0.83% |
|
52 Wk Lows |
49 |
|
|
52 Wk Lows |
142 |
|
|
 |
Breadth Negative After Major Averages Erased Early Gains
Kenneth J. Gruneisen - Passed the CAN SLIM® Master's Exam
Stocks gave up early gains to finish little changed on Thursday's session. The volume was reported lighter than the prior session totals on the NYSE and on the Nasdaq exchange. Breadth was negative as decliners led advancers by a 3-2 margin on the NYSE and 2-1 on the Nasdaq exchange. There were 36 high-ranked companies from the CANSLIM.net Leaders List that made new 52-week highs and appeared on the CANSLIM.net BreakOuts Page, up from the total of 31 stocks on the prior session. New 52-week highs outnumbered new 52-week lows on the NYSE while new lows outnumbered new highs on the Nasdaq exchange. There were gains for 2 of the 6 high-ranked companies currently included on the Featured Stocks Page. For the Market (M criteria) to earn the label of returning to a "confirmed uptrend" gains from at least one of the major averages into new high territory would be a welcome reassurance. Then, new buying efforts should be selective and only focused in stocks meeting all key criteria of the fact-based investment system. Keep in mind that any sustained and meaningful market advance requires leadership - a healthy crop of stocks hitting new 52-week highs.
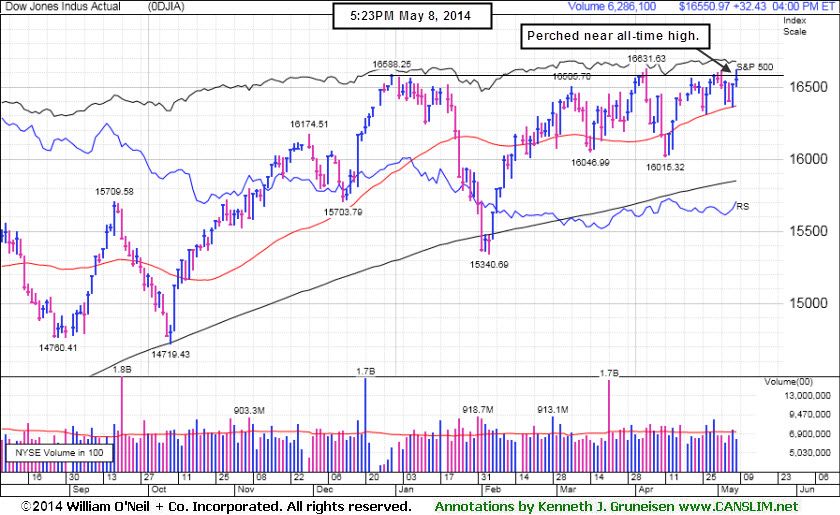 The Dow, which rose as many as 104 points, closed up 32 at 16550. The S&P 500 attempted to reach its all-time high before ending down 3 points to 1,875. The NASDAQ extended its retreat to a third day, declining 16 points to 4,051.
Investors weighed the latest earnings releases. Keurig Green Mountain (GMCR +13%) rallied after posting positive quarterly results. Shares of Tesla (TSLA -11.3%) as its guidance disappointed some analysts.
On the economic front, weekly jobless claims unexpectedly fell 26,000 to 319,000. Central bank policy was also in focus today. The European Central Bank left its benchmark interest rate unchanged and Fed Chairwoman Janet Yellen testified before the Senate banking committee on the economic outlook.
Energy and utilities were the worst performing groups on the session. Transocean (RIG -4.3%) after providing a cautious outlook. Shares of Exelon (EXC -0.76%). Over in tech, Facebook (FB -1.1%). Telecom was the best performing sector. CenturyLink (CTL +6.4%) on its positive earnings and guidance.
Treasuries were mostly higher. The 10-year was up fractionally to yield 2.61%.
The CANSLIM.net Featured Stocks Page shows the most action-worthy candidates and their latest notes and a Headline Link directs members to the latest detailed analysis with data-packed graphs annotated by a Certified expert along with links to additional resources. The Premium Member Homepage includes "dynamic archives" to all prior pay reports published. Watch for an announcement via email concerning the next WEBCAST.
PICTURED: The Dow Jones Industrial Average is perched near its all-time high, consolidating above its 50-day moving average (DMA) line.
|
 Kenneth J. Gruneisen started out as a licensed stockbroker in August 1987, a couple of months prior to the historic stock market crash that took the Dow Jones Industrial Average down -22.6% in a single day. He has published daily fact-based fundamental and technical analysis on high-ranked stocks online for two decades. Through FACTBASEDINVESTING.COM, Kenneth provides educational articles, news, market commentary, and other information regarding proven investment systems that work in good times and bad.
Comments contained in the body of this report are technical opinions only and are not necessarily those of Gruneisen Growth Corp. The material herein has been obtained from sources believed to be reliable and accurate, however, its accuracy and completeness cannot be guaranteed. Our firm, employees, and customers may effect transactions, including transactions contrary to any recommendation herein, or have positions in the securities mentioned herein or options with respect thereto. Any recommendation contained in this report may not be suitable for all investors and it is not to be deemed an offer or solicitation on our part with respect to the purchase or sale of any securities. |
|
 |
Biotech, Broker/Dealer, and Energy-Related Groups Fell
Kenneth J. Gruneisen - Passed the CAN SLIM® Master's Exam
The Broker/Dealer Index ($XBD -1.22%) fell while the Bank Index ($BKX +0.15%) eked out a tiny gain and the Retail Index ($RLX -0.02%) finished flat. The Biotechnology Index ($BTK -1.85%) dragged the tech sector lower while the Networking Index ($NWX -0.11%) was little changed, yet the Semiconductor Index ($SOX +0.67%) posted a modest gain. Energy-related shares were a negative influence as the Oil Services Index ($OSX -1.42%) and the Integrated Oil Index ($XOI -0.92%) both fell. The Gold & Silver Index ($XAU -0.13%) finished slightly in the red.
Charts courtesy www.stockcharts.com
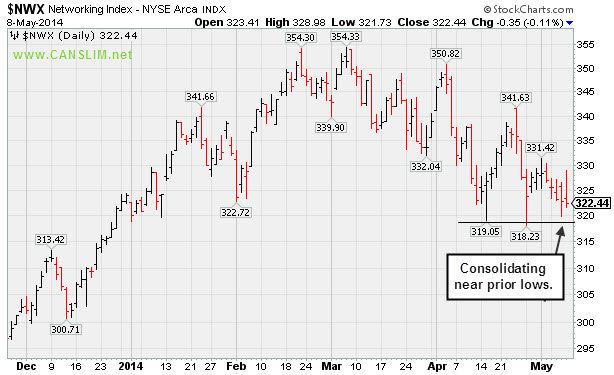
PICTURED: The Networking Index ($NWX -0.11%) is consolidating near prior lows.
| Oil Services |
$OSX |
292.15 |
-4.22 |
-1.42% |
+3.96% |
| Integrated Oil |
$XOI |
1,619.36 |
-15.11 |
-0.92% |
+7.73% |
| Semiconductor |
$SOX |
577.83 |
+3.84 |
+0.67% |
+8.00% |
| Networking |
$NWX |
322.44 |
-0.35 |
-0.11% |
-0.46% |
| Broker/Dealer |
$XBD |
151.63 |
-1.87 |
-1.22% |
-5.56% |
| Retail |
$RLX |
837.08 |
-0.17 |
-0.02% |
-10.93% |
| Gold & Silver |
$XAU |
89.91 |
-0.12 |
-0.13% |
+6.84% |
| Bank |
$BKX |
68.04 |
+0.10 |
+0.15% |
-1.76% |
| Biotech |
$BTK |
2,451.96 |
-46.15 |
-1.85% |
+5.21% |
|
|
|
 |
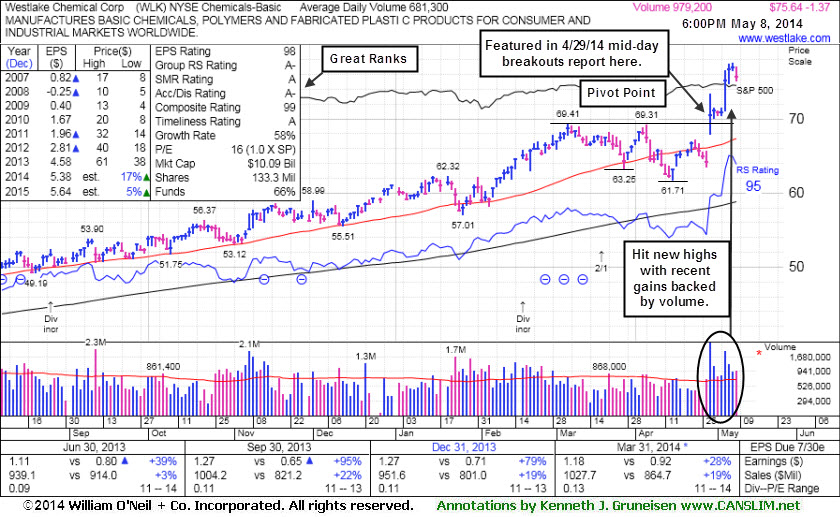
Extended From Base Following Volume Driven Gains
Kenneth J. Gruneisen - Passed the CAN SLIM® Master's Exam
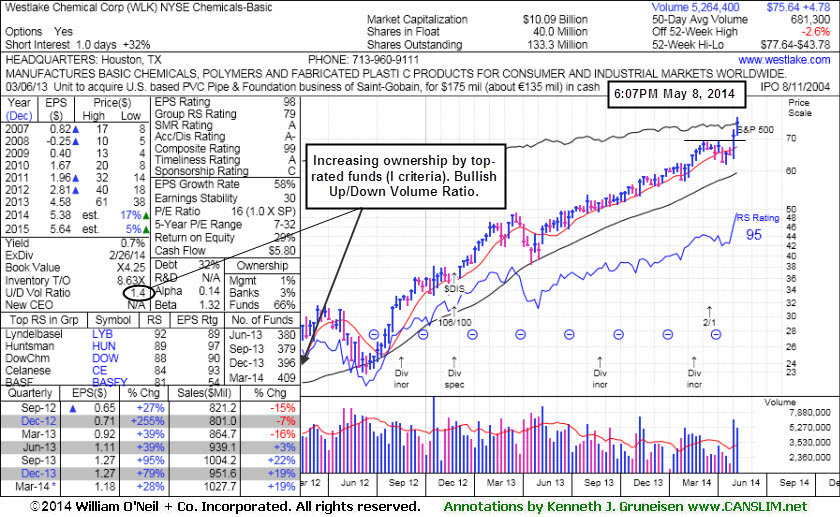
Westlake Chemical Corp (WLK -$1.37 or +-1.78% to $75.64) is perched near its 52-week high after rallying above its "max buy" level with a recent spurt of volume-driven gains. Prior highs in the $69 area define near-term support to watch. It reported +28% earnings on +19% sales for the Mar '14 quarter, and it has earned great ranks as its quarterly earnings increases have been above the +25% minimum (C criteria).
Its annual earnings growth rate (A criteria) has also been strong after a downturn in FY '08 and '09. The number of top-rated funds owning its shares rose from 381 in Sep '13 to 409 in Mar '14, a reassuring trend concerning the I criteria. The Chemicals - Basic industry group has seen its Group Relative Strength rating rise from 65 to 79 since last shown in this FSU section on 4/29/14 with annotated graphs under the headline, "Technical Breakout From Double Bottom Base Pattern". Strong action and leadership from others in the group is a reassuring sign concerning the L criteria.
The company was highlighted in yellow at $72.79 with pivot point cited based on its 4/04/14 high in the 4/29/14 mid-day report (read here). The plastics maker separated its ethylene assets into a tax-advantaged partnership in which it plans to sell shares to the public. It gapped up for a considerable volume-driven gain and a new 52-week high, rallying from a "double bottom" base. While the stock's bullish action triggered a technical buy signal, members were cautioned that 3 out of 4 stocks tend to move in the same direction of the major averages (M criteria).
|
|
|
Color Codes Explained :
Y - Better candidates highlighted by our
staff of experts.
G - Previously featured
in past reports as yellow but may no longer be buyable under the
guidelines.
***Last / Change / Volume data in this table is the closing quote data***
Symbol/Exchange
Company Name
Industry Group |
PRICE |
CHANGE
(%Change) |
Day High |
Volume
(% DAV)
(% 50 day avg vol) |
52 Wk Hi
% From Hi |
Featured
Date |
Price
Featured |
Pivot Featured |
|
Max Buy |
EQM
-
NYSE
E Q T Midstream Partners
ENERGY - Oil and Gas Pipelines
|
$76.06
|
+0.17
0.22% |
$76.08
|
200,785
89.64% of 50 DAV
50 DAV is 224,000
|
$78.67
-3.32%
|
12/12/2013
|
$53.17
|
PP = $56.51
|
|
MB = $59.34
|
Most Recent Note - 5/6/2014 6:21:27 PM
G - Still hovering near its all-time high. Completed a new Public Offering of 10.75 Million common units on 5/01/14. Fundamental concerns remain. Its 50 DMA line ($70.27) defines near-term support where a violation may trigger a technical sell signal.
>>> FEATURED STOCK ARTICLE : Stength Contiunues; Earnings Below +25% Minimum Guideline for a 2nd Quarter - 4/28/2014
View all notes |
Set NEW NOTE alert |
CANSLIM.net Company Profile |
SEC
News |
Chart |
Request a new note
C
A N
S L
I M


|
GNRC
-
NYSE
Generac Hldgs Inc
Electrical-Power/Equipmt
|
$51.25
|
-2.28
-4.26% |
$53.65
|
801,760
120.38% of 50 DAV
50 DAV is 666,000
|
$62.50
-18.00%
|
2/14/2014
|
$56.50
|
PP = $57.39
|
|
MB = $60.26
|
 Most Recent Note - 5/8/2014 5:30:06 PM
It will be dropped from the Featured Stocks list tonight due to technical and fundamental deterioration. Reported earnings -40% on -14% sales for the Mar '14 quarter raising fundamental concerns, and it violated support at its 50 DMA line on 5/01/14 with a volume-driven loss triggering technical sell signals..
>>> FEATURED STOCK ARTICLE : Fundamental and Technical Deterioration Raised Concerns - 5/5/2014
View all notes |
Set NEW NOTE alert |
CANSLIM.net Company Profile |
SEC
News |
Chart |
Request a new note
C
A N
S L
I M
|
ICON
-
NASDAQ
Iconix Brand Group Inc
CONSUMER NON-DURABLES - Textile - Apparel Footwear
|
$41.22
|
-0.75
-1.79% |
$42.25
|
588,674
101.67% of 50 DAV
50 DAV is 579,000
|
$43.34
-4.89%
|
4/30/2014
|
$42.50
|
PP = $42.57
|
|
MB = $44.70
|
Most Recent Note - 5/7/2014 5:44:42 PM
Y - Halted its slide today after 4 consecutive small losses. Confirming gains with above average volume could trigger a new (or add-on) technical buy signal. See the latest FSU analysis for more details and new annotated graphs.
>>> FEATURED STOCK ARTICLE : Stalled After Hitting a New 52-Week High - 5/7/2014
View all notes |
Set NEW NOTE alert |
CANSLIM.net Company Profile |
SEC
News |
Chart |
Request a new note
C
A N
S L
I M
|
PSIX
-
NASDAQ
Power Solutions Intl Inc
Machinery-Gen Industrial
|
$78.44
|
-2.99
-3.67% |
$84.25
|
98,411
127.81% of 50 DAV
50 DAV is 77,000
|
$88.96
-11.83%
|
5/6/2014
|
$86.46
|
PP = $87.50
|
|
MB = $91.88
|
Most Recent Note - 5/8/2014 6:28:06 PM
Y - Pulled back near its 50 DMA line today and finished near the session low with a loss on higher volume indicating distributional pressure. There was a "negative reversal" on the prior session after touching a new 52-week high Gains above the pivot point backed by at least +40% above average volume may trigger a new (or add-on) technical buy signal. A 50 DMA line violation would raise concerns and trigger a technical sell signal.
>>> FEATURED STOCK ARTICLE : Hitting New 52-Week High and New Pivot Point Cited - 5/6/2014
View all notes |
Set NEW NOTE alert |
CANSLIM.net Company Profile |
SEC
News |
Chart |
Request a new note
C
A N
S L
I M
|
TRN
-
NYSE
Trinity Industries Inc
TRANSPORTATION - Railroads
|
$78.32
|
+0.16
0.20% |
$79.87
|
1,706,445
135.97% of 50 DAV
50 DAV is 1,255,000
|
$78.91
-0.75%
|
4/30/2014
|
$75.57
|
PP = $76.05
|
|
MB = $79.85
|
Most Recent Note - 5/6/2014 6:25:19 PM
Y - Hit another new 52-week high with today's gain above its pivot point backed by +86% above average volume while approaching its "max buy" level. Prior highs in the $75-76 area define near-term support to watch on pullbacks.
>>> FEATURED STOCK ARTICLE : Finished Near Session Lows After Encountering Distributional Pressure - 4/30/2014
View all notes |
Set NEW NOTE alert |
CANSLIM.net Company Profile |
SEC
News |
Chart |
Request a new note
C
A N
S L
I M
|
Symbol/Exchange
Company Name
Industry Group |
PRICE |
CHANGE
(%Change) |
Day High |
Volume
(% DAV)
(% 50 day avg vol) |
52 Wk Hi
% From Hi |
Featured
Date |
Price
Featured |
Pivot Featured |
|
Max Buy |
WLK
-
NYSE
Westlake Chemical Corp
CHEMICALS - Specialty Chemicals
|
$75.64
|
-1.37
-1.78% |
$77.15
|
979,295
143.80% of 50 DAV
50 DAV is 681,000
|
$77.64
-2.58%
|
4/29/2014
|
$72.79
|
PP = $69.31
|
|
MB = $72.78
|
Most Recent Note - 5/8/2014 6:29:39 PM
G - Pulled back from its 52-week high today after 4 consecutive gains. Prior highs in the $69 area define near-term support to watch. Reported +28% earnings on +19% sales for the Mar '14 quarter.
>>> FEATURED STOCK ARTICLE : Extended From Base Following Volume Driven Gains - 5/8/2014
View all notes |
Set NEW NOTE alert |
CANSLIM.net Company Profile |
SEC
News |
Chart |
Request a new note
C
A N
S L
I M
|
|
|
|
THESE ARE NOT BUY RECOMMENDATIONS!
Comments contained in the body of this report are technical
opinions only. The material herein has been obtained
from sources believed to be reliable and accurate, however,
its accuracy and completeness cannot be guaranteed.
This site is not an investment advisor, hence it does
not endorse or recommend any securities or other investments.
Any recommendation contained in this report may not
be suitable for all investors and it is not to be deemed
an offer or solicitation on our part with respect to
the purchase or sale of any securities. All trademarks,
service marks and trade names appearing in this report
are the property of their respective owners, and are
likewise used for identification purposes only.
This report is a service available
only to active Paid Premium Members.
You may opt-out of receiving report notifications
at any time. Questions or comments may be submitted
by writing to Premium Membership Services 665 S.E. 10 Street, Suite 201 Deerfield Beach, FL 33441-5634 or by calling 1-800-965-8307
or 954-785-1121.
|
|
|

