You are not logged in.
This means you
CAN ONLY VIEW reports that were published prior to Monday, April 14, 2025.
You
MUST UPGRADE YOUR MEMBERSHIP if you want to see any current reports.
AFTER MARKET UPDATE - WEDNESDAY, MAY 8TH, 2013
Previous After Market Report Next After Market Report >>>
|
|
|
|
DOW |
+48.92 |
15,105.12 |
+0.32% |
|
Volume |
730,016,800 |
+15% |
|
Volume |
1,671,656,010 |
+1% |
|
NASDAQ |
+16.64 |
3,413.27 |
+0.49% |
|
Advancers |
1,975 |
63% |
|
Advancers |
1,428 |
55% |
|
S&P 500 |
+6.73 |
1,632.69 |
+0.41% |
|
Decliners |
1,026 |
33% |
|
Decliners |
1,027 |
40% |
|
Russell 2000 |
+2.59 |
970.41 |
+0.27% |
|
52 Wk Highs |
490 |
|
|
52 Wk Highs |
234 |
|
|
S&P 600 |
+2.26 |
545.33 |
+0.42% |
|
52 Wk Lows |
8 |
|
|
52 Wk Lows |
21 |
|
|
 |
Major Averages Rally Further Into Record High Ground
Kenneth J. Gruneisen - Passed the CAN SLIM® Master's Exam
The volume totals were reported higher than the prior session totals on the NYSE and on the Nasdaq exchange indicating an increase in institutional buying interest. Breadth was positive as advancers led decliners by nearly 2-1 on the NYSE and 7-5 on the Nasdaq exchange. There were 99 high-ranked companies from the CANSLIM.net Leaders List making new 52-week highs and appearing on the CANSLIM.net BreakOuts Page, up from the prior session total of 90 stocks. New 52-week highs totals expanded and solidly outnumbered new 52-week lows on both the NYSE and the Nasdaq exchange. There were gains for 10 of the 13 high-ranked companies currently included on the Featured Stocks Page.
The major averages traded higher into new high territory with gains attributed to Wednesday's generally positive earnings. Shares of Whole Foods (WFM +10.12%) rallied after quarterly results beat estimates and the grocer increased its full-year guidance. Video game maker Electronic Arts Inc (EA +17.11% ) spiked higher as profits topped analyst projections. While there were no major U.S. economic releases, the market did receive encouraging data from Asia and Europe. China reported exports rose more than expected in April while Germany's industrial production increased for a second straight month in March.
Materials were among the best performing groups in the session. Cliffs Natural Resources (CLF +8.53% ) extended its winning streak to a fourth day. Freeport McMoRan Copper & Gold Inc (FCX +2.66%) shares were higher as metal prices advanced. Tech was higher with Cognizant Technology Solutions Corp (CTSH +5.04%) and Yahoo! Inc (YHOO +1.30%) posting gains. Utilities were the worst performing group with American Electric Power Co Inc (AEP -0.91%) down.
The market (M criteria) saw an expansion in leadership (stocks hitting new 52-week highs) that reassured investors a confirmed uptrend is at hand. Watch for new stocks featured in the CANSLIM.net Mid-Day BreakOuts Report. Action-worthy leaders are covered on an ongoing basis with the latest notes and additional resource links included on the Featured Stocks Page. Watch for an announcement via email concerning the next WEBCAST. The webcast will also be available via an updated link highlighted at the top of the Premium Member Homepage.
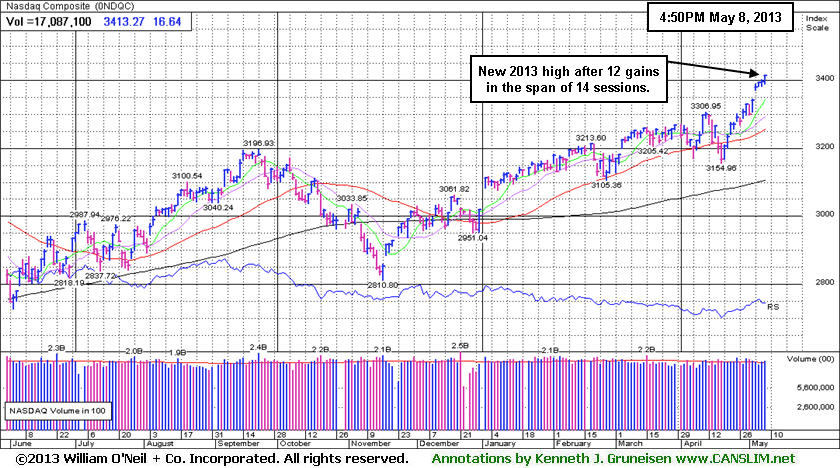
PICTURED: The Nasdaq Composite Index climbed to its best level in 12 years and hit a new 2013 high after tallying 12 gains in the span of 14 sessions. The indices' rally to new highs confirmed the market's uptrend which means odds are favorable for new buying efforts in stocks meeting all of the fact-based investment system's key criteria.
|
 Kenneth J. Gruneisen started out as a licensed stockbroker in August 1987, a couple of months prior to the historic stock market crash that took the Dow Jones Industrial Average down -22.6% in a single day. He has published daily fact-based fundamental and technical analysis on high-ranked stocks online for two decades. Through FACTBASEDINVESTING.COM, Kenneth provides educational articles, news, market commentary, and other information regarding proven investment systems that work in good times and bad.
Comments contained in the body of this report are technical opinions only and are not necessarily those of Gruneisen Growth Corp. The material herein has been obtained from sources believed to be reliable and accurate, however, its accuracy and completeness cannot be guaranteed. Our firm, employees, and customers may effect transactions, including transactions contrary to any recommendation herein, or have positions in the securities mentioned herein or options with respect thereto. Any recommendation contained in this report may not be suitable for all investors and it is not to be deemed an offer or solicitation on our part with respect to the purchase or sale of any securities. |
|
 |
Defensive, Retail, Financial, and Tech Groups Posted Gains
Kenneth J. Gruneisen - Passed the CAN SLIM® Master's Exam
Defensive groups were Wednesday's best gainers as the Gold & Silver Index ($XAU +5.05%) outpaced the Healthcare Index ($HMO +1.70%). The Retail Index ($RLX +0.51%) and financial groups also were positive influences on the major averages as the Bank Index ($BKX +0.81%) and the Broker/Dealer Index ($XBD +0.51%) rose. The Networking Index ($NWX +1.25%) and the Semiconductor Index ($SOX +1.29%) led the tech sector higher while the Internet Index ($IIX +0.42%) and the Biotechnology Index ($BTK +0.50%) posted smaller gains. The Oil Services Index ($OSX +0.46%) also had a positive bias while the Integrated Oil Index ($XOI +0.04%) ended flat.
Charts courtesy www.stockcharts.com
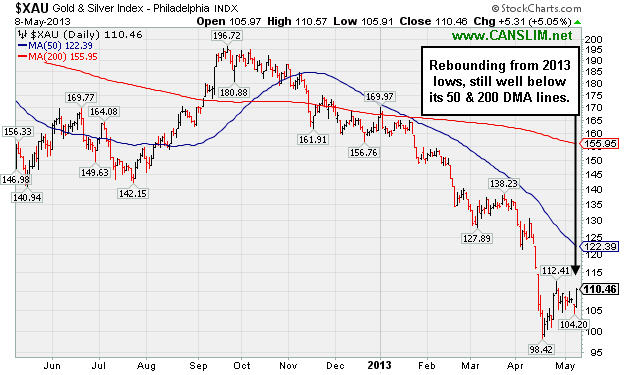
PICTURED: The Gold & Silver Index ($XAU +5.05%) was a standout gainer while rebounding from its 2013 lows, yet it remains well below its 50-day and 200-day moving average (DMA) lines.
| Oil Services |
$OSX |
260.89 |
+1.19 |
+0.46% |
+18.50% |
| Healthcare |
$HMO |
3,058.52 |
+51.20 |
+1.70% |
+21.65% |
| Integrated Oil |
$XOI |
1,394.95 |
+0.56 |
+0.04% |
+12.33% |
| Semiconductor |
$SOX |
459.47 |
+5.85 |
+1.29% |
+19.63% |
| Networking |
$NWX |
232.58 |
+2.87 |
+1.25% |
+2.66% |
| Internet |
$IIX |
373.00 |
+1.55 |
+0.42% |
+14.07% |
| Broker/Dealer |
$XBD |
117.57 |
+0.60 |
+0.51% |
+24.63% |
| Retail |
$RLX |
769.75 |
+3.94 |
+0.51% |
+17.87% |
| Gold & Silver |
$XAU |
110.46 |
+5.31 |
+5.05% |
-33.30% |
| Bank |
$BKX |
58.75 |
+0.47 |
+0.81% |
+14.57% |
| Biotech |
$BTK |
1,945.50 |
+9.65 |
+0.50% |
+25.76% |
|
|
|
 |
5th Consecutive Gain And Best Ever Finish
Kenneth J. Gruneisen - Passed the CAN SLIM® Master's Exam
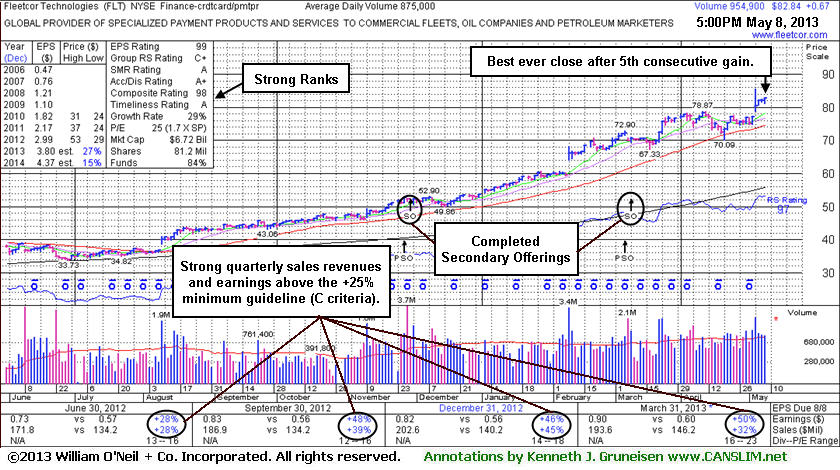
FleetCor Technologies, Inc. (FLT +$0.67 or +0.82% to $82.84) finished at its best-ever close after a 5th consecutive gain, getting more extended from any sound base pattern. It reported earnings +50% on +32% sales for the Mar '13 quarter, marking its 5th consecutive quarterly comparison with earnings above the +25% guideline (C criteria). Its 50-day moving average (DMA) line acted as support after last shown in this FSU section on 4/15/13 with an annotated graph under the headline, "Distributional Action Followed Latest Breakout After Little Progress". Any subsequent violations of the 50 DMA line or recent low ($70.09) would raise serious concerns and trigger worrisome technical sell signals.
The company completed another Secondary Offering on 3/08/13 after a streak of volume-driven gains into new high territory. On 3/14/12, 6/11/12, and 11/29/12 it priced Secondary Offerings and it was previously noted, "Such offerings often are a short-term hindrance to upward price progress yet typically result in broader institutional ownership interest."
The number of top-rated funds owning its shares rose from 193 in Mar '12 to 340 in Mar '13, a reassuring sign concerning the I criteria. Its current Up/Down Volume Ratio of 1.7 is also an unbiased indication that its shares have been under accumulation over the past 50 days. The company hails from the Finance - Credit Card Payment Processing group which currently has a mediocre 48 Group Relative Strength Rating, however impressive strength and leadership from a couple of other firms in the same industry group is considered sufficient reassurance concerning the L criteria.
|
|
|
Color Codes Explained :
Y - Better candidates highlighted by our
staff of experts.
G - Previously featured
in past reports as yellow but may no longer be buyable under the
guidelines.
***Last / Change / Volume data in this table is the closing quote data***
Symbol/Exchange
Company Name
Industry Group |
PRICE |
CHANGE
(%Change) |
Day High |
Volume
(% DAV)
(% 50 day avg vol) |
52 Wk Hi
% From Hi |
Featured
Date |
Price
Featured |
Pivot Featured |
|
Max Buy |
AMBA
-
NASDAQ
Ambarella Inc
ELECTRONICS - Semiconductor - Specialized
|
$13.79
|
+0.02
0.15% |
$13.92
|
281,076
56.26% of 50 DAV
50 DAV is 499,600
|
$16.00
-13.81%
|
5/6/2013
|
$15.31
|
PP = $16.10
|
|
MB = $16.91
|
Most Recent Note - 5/7/2013 10:11:09 AM
Y - Pulling back today with volume running at an above average pace. May spend more time basing as it was noted that it faces resistance due to overhead supply up through the $16 level. Found encouraging support at its 50 DMA line and flashed above average volume behind recent gains while building on a new base. Volume-driven gains above the new pivot point are needed to trigger a new technical buy signal. See the latest FSU analysis for more details and a new annotated graph.
>>> The latest Featured Stock Update with an annotated graph appeared on 5/6/2013. Click here.
View all notes |
Alert me of new notes |
CANSLIM.net Company Profile |
SEC |
Zacks Reports |
StockTalk |
News |
Chart |
Request a new note
C
A N
S L
I M


|
CELG
-
NASDAQ
Celgene Corp
DRUGS - Drug Manufacturers - Major
|
$122.74
|
+1.08
0.88% |
$124.10
|
2,860,731
89.04% of 50 DAV
50 DAV is 3,212,900
|
$128.52
-4.50%
|
3/27/2013
|
$113.24
|
PP = $115.54
|
|
MB = $121.32
|
Most Recent Note - 5/6/2013 6:33:38 PM
G - Found support at its 50 DMA line as it managed a positive reversal on 5/02/13. That session's low ($114.05) defines important near-term support below its short-term average. It is extended from any sound base pattern.
>>> The latest Featured Stock Update with an annotated graph appeared on 4/19/2013. Click here.
View all notes |
Alert me of new notes |
CANSLIM.net Company Profile |
SEC |
Zacks Reports |
StockTalk |
News |
Chart |
Request a new note
C
A N
S L
I M
|
CMCSA
-
NASDAQ
Comcast Corp Cl A
MEDIA - CATV Systems
|
$43.28
|
+0.23
0.52% |
$43.36
|
7,180,433
58.92% of 50 DAV
50 DAV is 12,186,300
|
$43.25
0.06%
|
12/3/2012
|
$37.08
|
PP = $38.06
|
|
MB = $39.96
|
Most Recent Note - 5/6/2013 11:41:09 AM
G - Reported earnings +13% on +3% sales revenues for the Mar '13 quarter, the 2nd consecutive quarterly comparison with earnings well below the +25% minimum guideline (C criteria). Despite fundamental concerns repeatedly noted it has found recent support near its 50 DMA line and is perched at its 52-week high.
>>> The latest Featured Stock Update with an annotated graph appeared on 4/16/2013. Click here.
View all notes |
Alert me of new notes |
CANSLIM.net Company Profile |
SEC |
Zacks Reports |
StockTalk |
News |
Chart |
Request a new note
C
A N
S L
I M
|
EQM
-
NYSE
E Q T Midstream Partners
ENERGY - Oil and Gas Pipelines
|
$47.40
|
+0.23
0.49% |
$48.50
|
125,246
156.17% of 50 DAV
50 DAV is 80,200
|
$48.40
-2.07%
|
4/25/2013
|
$40.16
|
PP = $40.84
|
|
MB = $42.88
|
 Most Recent Note - 5/8/2013 5:25:55 PM
G - Hovering near its 52-week high with above average volume behind today's gain. Prior highs in the $40 area define initial support to watch above its 50 DMA line on pullbacks.
>>> The latest Featured Stock Update with an annotated graph appeared on 4/25/2013. Click here.
View all notes |
Alert me of new notes |
CANSLIM.net Company Profile |
SEC |
Zacks Reports |
StockTalk |
News |
Chart |
Request a new note
C
A N
S L
I M
|
FLT
-
NYSE
Fleetcor Technologies
DIVERSIFIED SERVICES - Business/Management Services
|
$82.84
|
+0.67
0.82% |
$82.91
|
954,962
109.14% of 50 DAV
50 DAV is 875,000
|
$85.56
-3.18%
|
3/21/2013
|
$71.14
|
PP = $73.00
|
|
MB = $76.65
|
Most Recent Note - 5/8/2013 5:23:16 PM
G - Posted a 5th consecutive gain with above average volume for a best ever close, getting more extended from any sound base pattern. Its 50 DMA line and recent low ($70.09) define near-term support where violations would raise more serious concerns and trigger worrisome technical sell signals. See the latest FSU analysis for more details and a new annotated graph.
>>> The latest Featured Stock Update with an annotated graph appeared on 5/8/2013. Click here.
View all notes |
Alert me of new notes |
CANSLIM.net Company Profile |
SEC |
Zacks Reports |
StockTalk |
News |
Chart |
Request a new note
C
A N
S L
I M
|
Symbol/Exchange
Company Name
Industry Group |
PRICE |
CHANGE
(%Change) |
Day High |
Volume
(% DAV)
(% 50 day avg vol) |
52 Wk Hi
% From Hi |
Featured
Date |
Price
Featured |
Pivot Featured |
|
Max Buy |
LNKD
-
NYSE
Linkedin Corp Class A
INTERNET - Internet Information Providers
|
$177.15
|
-3.50
-1.94% |
$182.55
|
2,916,659
123.38% of 50 DAV
50 DAV is 2,363,900
|
$202.91
-12.70%
|
4/12/2013
|
$182.69
|
PP = $184.25
|
|
MB = $193.46
|
Most Recent Note - 5/6/2013 6:38:26 PM
G - Held its ground today near its 50 DMA line. Gapped down on 5/03/13 undercutting prior highs in the $184 area with heavy volume behind a damaging loss. Reported earnings +200% on +72% sales revenues for the Mar '13 quarter.
>>> The latest Featured Stock Update with an annotated graph appeared on 4/29/2013. Click here.
View all notes |
Alert me of new notes |
CANSLIM.net Company Profile |
SEC |
Zacks Reports |
StockTalk |
News |
Chart |
Request a new note
C
A N
S L
I M
|
MRLN
-
NASDAQ
Marlin Business Services
DIVERSIFIED SERVICES - Rental and Leasing Services
|
$24.99
|
-0.81
-3.14% |
$25.66
|
9,409
35.51% of 50 DAV
50 DAV is 26,500
|
$25.97
-3.77%
|
3/15/2013
|
$22.29
|
PP = $23.18
|
|
MB = $24.34
|
Most Recent Note - 5/8/2013 5:24:24 PM
G - Pulled back on below average volume yet it remains above its "max buy" level. No resistance remains due to overhead supply. Prior highs in the $23 area define support to watch on pullbacks.
>>> The latest Featured Stock Update with an annotated graph appeared on 5/2/2013. Click here.
View all notes |
Alert me of new notes |
CANSLIM.net Company Profile |
SEC |
Zacks Reports |
StockTalk |
News |
Chart |
Request a new note
C
A N
S L
I M
|
N
-
NYSE
Netsuite Inc
DIVERSIFIED SERVICES - Business/Management Services
|
$89.83
|
+0.03
0.03% |
$90.24
|
362,696
97.89% of 50 DAV
50 DAV is 370,500
|
$91.02
-1.31%
|
12/12/2012
|
$64.75
|
PP = $67.12
|
|
MB = $70.48
|
Most Recent Note - 5/3/2013 6:22:48 PM
G - Hit another new all-time high with today's gain. Its 50 DMA line defines important near-term support to watch. Reported earnings -33% on +32% sales revenues for the Mar '13 quarter, marking a 2nd consecutive quarterly comparison with earnings below the +25% minimum guideline (C criteria).
>>> The latest Featured Stock Update with an annotated graph appeared on 4/22/2013. Click here.
View all notes |
Alert me of new notes |
CANSLIM.net Company Profile |
SEC |
Zacks Reports |
StockTalk |
News |
Chart |
Request a new note
C
A N
S L
I M
|
NSM
-
NYSE
Nationstar Mtg Hldgs Inc
FINANCIAL SERVICES - Credit Services
|
$40.75
|
+0.76
1.90% |
$41.01
|
1,752,784
163.81% of 50 DAV
50 DAV is 1,070,000
|
$42.24
-3.53%
|
5/7/2013
|
$39.71
|
PP = $42.34
|
|
MB = $44.46
|
Most Recent Note - 5/7/2013 6:03:30 PM
Y - Highlighted in yellow with annotated daily graph and a new pivot point cited based on its 2/15/13 high plus 10 cents in the earlier mid-day report (read here). Fundamentals remain favorable with respect to the C and A criteria. See the latest FSU analysis for more details and an annotated weekly graph.
>>> The latest Featured Stock Update with an annotated graph appeared on 5/7/2013. Click here.
View all notes |
Alert me of new notes |
CANSLIM.net Company Profile |
SEC |
Zacks Reports |
StockTalk |
News |
Chart |
Request a new note
C
A N
S L
I M
|
PRAA
-
NASDAQ
Portfolio Recovery Assoc
DIVERSIFIED SERVICES - Business/Management Services
|
$142.55
|
+0.79
0.56% |
$142.55
|
58,133
84.25% of 50 DAV
50 DAV is 69,000
|
$141.84
0.50%
|
5/1/2013
|
$130.77
|
PP = $127.88
|
|
MB = $134.27
|
Most Recent Note - 5/3/2013
G - Spiked further into new high territory while adding to its streak of volume-driven gains including the previously noted "breakaway gap". It is extended from any sound base and prior highs near $127 define near-term support to watch on pullbacks. Reported earnings +54% on +21% sales revenues for the Mar '13 quarter.
>>> The latest Featured Stock Update with an annotated graph appeared on 5/1/2013. Click here.
View all notes |
Alert me of new notes |
CANSLIM.net Company Profile |
SEC |
Zacks Reports |
StockTalk |
News |
Chart |
Request a new note
C
A N
S L
I M
|
Symbol/Exchange
Company Name
Industry Group |
PRICE |
CHANGE
(%Change) |
Day High |
Volume
(% DAV)
(% 50 day avg vol) |
52 Wk Hi
% From Hi |
Featured
Date |
Price
Featured |
Pivot Featured |
|
Max Buy |
PRLB
-
NYSE
Proto Labs Inc
MANUFACTURING - Small Tools and Accessories
|
$54.76
|
+0.17
0.31% |
$56.59
|
414,481
76.43% of 50 DAV
50 DAV is 542,300
|
$55.93
-2.09%
|
5/3/2013
|
$54.77
|
PP = $54.01
|
|
MB = $56.71
|
Most Recent Note - 5/3/2013 6:56:01 PM
Y - Highlighted in yellow in the earlier mid-day report, it posted a gain above the previously cited pivot point backed by +47% above average volume while hitting a new 52-week high triggering a technical buy signal. Reported earnings +46% on +24% sales revenues for the Mar '13 quarter, continuing its strong growth trend satisfying the C criteria. See the latest FSU analysis for more details and a new annotated graph.
>>> The latest Featured Stock Update with an annotated graph appeared on 5/3/2013. Click here.
View all notes |
Alert me of new notes |
CANSLIM.net Company Profile |
SEC |
Zacks Reports |
StockTalk |
News |
Chart |
Request a new note
C
A N
S L
I M
|
RRTS
-
NYSE
Roadrunner Trans Systems
TRANSPORTATION - Air Delivery and Freight Service
|
$25.52
|
+0.53
2.12% |
$25.85
|
136,170
72.20% of 50 DAV
50 DAV is 188,600
|
$25.74
-0.85%
|
4/3/2013
|
$22.77
|
PP = $23.75
|
|
MB = $24.94
|
Most Recent Note - 5/6/2013 6:28:37 PM
G - Color code is changed to green after rallying beyond its "max buy" level with today's 3rd consecutive gain backed by above average volume.
>>> The latest Featured Stock Update with an annotated graph appeared on 4/23/2013. Click here.
View all notes |
Alert me of new notes |
CANSLIM.net Company Profile |
SEC |
Zacks Reports |
StockTalk |
News |
Chart |
Request a new note
C
A N
S L
I M
|
VRX
-
NYSE
Valeant Pharmaceuticals
DRUGS - Drug Manufacturers - Other
|
$73.86
|
-0.21
-0.28% |
$74.63
|
713,719
49.01% of 50 DAV
50 DAV is 1,456,200
|
$76.57
-3.54%
|
4/30/2013
|
$60.24
|
PP = $76.66
|
|
MB = $80.49
|
Most Recent Note - 5/6/2013 6:35:45 PM
Y- Sub par earnings for the Mar '13 quarter below the +25% minimum guideline (C criteria) raised fundamental concerns. Its 50 DMA line defines important near-term support above the recent low ($69.87 on 4/04/13). Subsequent violations may trigger technical sell signals.
>>> The latest Featured Stock Update with an annotated graph appeared on 4/30/2013. Click here.
View all notes |
Alert me of new notes |
CANSLIM.net Company Profile |
SEC |
Zacks Reports |
StockTalk |
News |
Chart |
Request a new note
C
A N
S L
I M
|
|
|
|
THESE ARE NOT BUY RECOMMENDATIONS!
Comments contained in the body of this report are technical
opinions only. The material herein has been obtained
from sources believed to be reliable and accurate, however,
its accuracy and completeness cannot be guaranteed.
This site is not an investment advisor, hence it does
not endorse or recommend any securities or other investments.
Any recommendation contained in this report may not
be suitable for all investors and it is not to be deemed
an offer or solicitation on our part with respect to
the purchase or sale of any securities. All trademarks,
service marks and trade names appearing in this report
are the property of their respective owners, and are
likewise used for identification purposes only.
This report is a service available
only to active Paid Premium Members.
You may opt-out of receiving report notifications
at any time. Questions or comments may be submitted
by writing to Premium Membership Services 665 S.E. 10 Street, Suite 201 Deerfield Beach, FL 33441-5634 or by calling 1-800-965-8307
or 954-785-1121.
|
|
|

