You are not logged in.
This means you
CAN ONLY VIEW reports that were published prior to Tuesday, July 9, 2024.
You
MUST UPGRADE YOUR MEMBERSHIP if you want to see any current reports.
AFTER MARKET UPDATE - TUESDAY, MAY 7TH, 2024
Previous After Market Report Next After Market Report >>>
|
|
|
|
DOW |
+31.99 |
38,884.26 |
+0.08% |
|
Volume |
1,032,418,271 |
+13% |
|
Volume |
5,075,769,300 |
+12% |
|
NASDAQ |
-16.69 |
16,332.56 |
-0.10% |
|
Advancers |
1,547 |
56% |
|
Advancers |
2,024 |
48% |
|
S&P 500 |
+6.96 |
5,187.70 |
+0.13% |
|
Decliners |
1,221 |
44% |
|
Decliners |
2,168 |
52% |
|
Russell 2000 |
+3.97 |
2,064.65 |
+0.19% |
|
52 Wk Highs |
201 |
|
|
52 Wk Highs |
150 |
|
|
S&P 600 |
+2.44 |
1,317.61 |
+0.19% |
|
52 Wk Lows |
16 |
|
|
52 Wk Lows |
70 |
|
|
Conditions are technically still considered a market "correction" (M criteria). Tuesday the market churned higher volume without making meaningful progress. Friday's and Monday's sessions were marked by a nice expansion in the list of stocks hitting new 52-week highs on both major exchanges while the Nasdaq Composite Index led its peers with solid gains. Volume totals on both days came in below the prior session totals. Investors are still cautioned about making new buying efforts until a solid follow-through day marked by higher volume is noted confirming a new uptrend.
|
 |
Major Indices Little Changed While Churning Higher Volume
Kenneth J. Gruneisen - Passed the CAN SLIM® Master's Exam
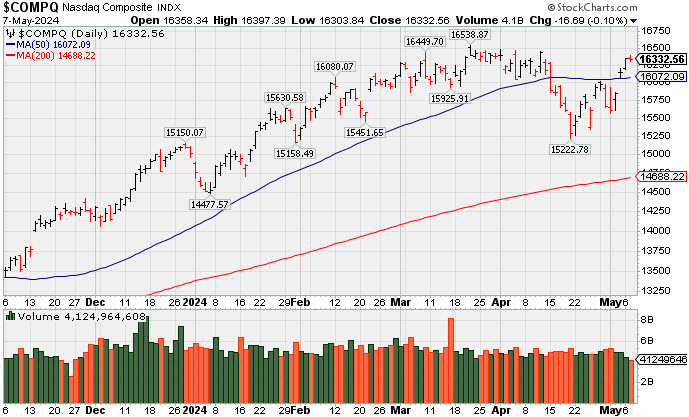
The major indices ended mixed and little changed on Tuesday. The Nasdaq Composite closed -0.1% lower while the S&P 500 (+0.1%) and Dow Jones Industrial Average (+0.1%) closed slightly higher. The Russell 2000 continued its recent outperformance, gaining +0.4%. Volume reported was higher than the prior session totals on the NYSE and on the Nasdaq exchange. Advancers led decliners by a 5-4 margin on the NYSE but decliners narrowly outnumbered advancers on the Nasdaq exchange. Leadership improved as there were 93 high-ranked companies from the Leaders List that hit new 52-week highs and were listed on the BreakOuts Page versus 73 on the prior session. New 52-week highs totals expanded and outnumbered new 52-week lows on the NYSE and on the Nasdaq exchange. The major indices recently signaled a market correction (M criteria). Greater caution is important for all investors until a follow-through day signals a new confirmed uptrend.
PICTURED: The Nasdaq Composite Index above its 50-day moving average (DMA) line.
Following earnings news from Walt Disney (DIS -9.51%) and Builders FirstSource (BLDR -19.05%) both fell. They were the worst performing stocks in the S&P 500 after disappointing earnings and/or guidance. Meanwhile, FMC Corp. (FMC +9.46%) and Intl Flavors (IFF +6.40%) were the top performing stocks in the S&P 500 in response to their quarterly results and outlook.
Only three of the S&P 500 sectors fell. Consumer discretionary (-0.6%) and information technology (-0.5%) sectors logged the biggest losses. The materials (+1.2%) and utilities (+1.1%) sectors led the outperformers.
The 2-yr note yield settled one basis point higher at 4.83% and the 10-yr note yield settled three basis points lower at 4.46%. The latest $58 billion 3-yr note sale was met with good demand.
|
 Kenneth J. Gruneisen started out as a licensed stockbroker in August 1987, a couple of months prior to the historic stock market crash that took the Dow Jones Industrial Average down -22.6% in a single day. He has published daily fact-based fundamental and technical analysis on high-ranked stocks online for two decades. Through FACTBASEDINVESTING.COM, Kenneth provides educational articles, news, market commentary, and other information regarding proven investment systems that work in good times and bad.
Comments contained in the body of this report are technical opinions only and are not necessarily those of Gruneisen Growth Corp. The material herein has been obtained from sources believed to be reliable and accurate, however, its accuracy and completeness cannot be guaranteed. Our firm, employees, and customers may effect transactions, including transactions contrary to any recommendation herein, or have positions in the securities mentioned herein or options with respect thereto. Any recommendation contained in this report may not be suitable for all investors and it is not to be deemed an offer or solicitation on our part with respect to the purchase or sale of any securities. |
|
 |
Semiconductor and Financial Indexes Edged Lower
Kenneth J. Gruneisen - Passed the CAN SLIM® Master's Exam
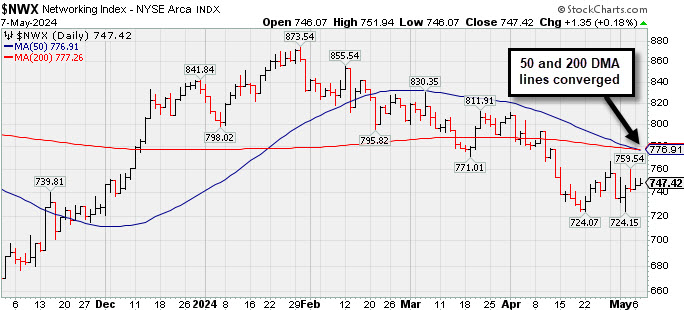
The Retail Index ($RLX -0.02%) finished flat while the Broker/Dealer Index ($XBD -0.20%) and the Bank Index ($BKX -0.17%) both inched lower. The tech sector was mixed as the Semiconductor Index ($SOX -0.74%) pulled back while the Networking Index ($NWX +0.18%) and the Biotech Index ($BTK +0.32%) both ended slightly higher. The Gold & Silver Index ($XAU +0.06%) finished flat as the Oil Services Index ($OSX +0.63%) edged higher and the Integrated Oil Index ($XOI -0.27%) inched lower.
![]() PICTURED: The Networking Index ($NWX +0.18%) is consolidating below its 50-day and 200-day moving average (DMA) lines which have converged.
| Oil Services |
$OSX |
86.78 |
+0.54 |
+0.63% |
+3.45% |
| Integrated Oil |
$XOI |
2,119.11 |
-5.63 |
-0.27% |
+13.78% |
| Semiconductor |
$SOX |
4,784.88 |
-35.57 |
-0.74% |
+14.59% |
| Networking |
$NWX |
747.42 |
+1.35 |
+0.18% |
-10.25% |
| Broker/Dealer |
$XBD |
619.83 |
-1.25 |
-0.20% |
+11.22% |
| Retail |
$RLX |
4,486.95 |
-0.82 |
-0.02% |
+15.38% |
| Gold & Silver |
$XAU |
137.75 |
+0.08 |
+0.06% |
+9.59% |
| Bank |
$BKX |
104.06 |
-0.18 |
-0.17% |
+8.37% |
| Biotech |
$BTK |
5,121.29 |
+16.34 |
+0.32% |
-5.49% |
|
|
|
 |
Damaging Volume-Driven Loss After Earnings News
Kenneth J. Gruneisen - Passed the CAN SLIM® Master's Exam
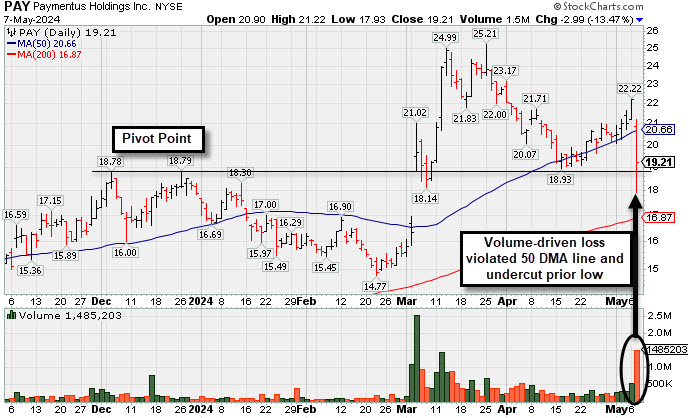
Paymentus Holdings (PAY -$2.99 or -13.47% to $19.21) reported Mar '24 quarterly earnings +150% on +25% sales revenues versus the year-ago period. Volume and volatility often increase near earnings news. It suffered a damaging loss today violating its 50-day moving average (DMA) line and undercutting the prior low triggering technical sell signals. Only a prompt rebound above the 50 DMA line would help its outlook improve. It will be dropped from the Featurted Stocks list tonight.
Fundamentals remain strong. PAY has a 96 Earnings Per Share Rating. Its 4 latest quarterly comparisons were well above the +25% minimum earnings guideline (C criteria). Its annual earnings history (A criteria) has been strong since its $21 IPO in May '21.
The number of top-rated funds owning its shares rose from 79 in Mar '23 to 122 in Mar '24, a reassuring sign concerning the I criteria. Its small supply of only 17.2 million shares in the public float (S criteria) can contribute to greater price volatility in the event of institutional buying or selling.
|
|
|
Color Codes Explained :
Y - Better candidates highlighted by our
staff of experts.
G - Previously featured
in past reports as yellow but may no longer be buyable under the
guidelines.
***Last / Change / Volume data in this table is the closing quote data***
Symbol/Exchange
Company Name
Industry Group |
PRICE |
CHANGE
(%Change) |
Day High |
Volume
(% DAV)
(% 50 day avg vol) |
52 Wk Hi
% From Hi |
Featured
Date |
Price
Featured |
Pivot Featured |
|
Max Buy |
 AXON
-
NASDAQ
AXON
-
NASDAQ
Axon Enterprise
Security/Sfty
|
$312.73
|
-14.91
-4.55% |
$317.50
|
1,010,208
181.69% of 50 DAV
50 DAV is 556,000
|
$329.87
-5.20%
|
4/5/2024
|
$309.90
|
PP = $325.73
|
|
MB = $342.02
|
 Most Recent Note - 5/7/2024 12:05:58 PM
Y - Reported Mar '24 quarterly earnings +31% on +34% sales revenues versus the year ago period. Fundamentals remain strong. Gapped down today testing its 50 DMA line ($310) after a gain with +41% above-average volume for a best-ever close on the prior session. The gain and strong close above the pivot point backed by at least +40% above average volume triggered a technical buy signal.
>>> FEATURED STOCK ARTICLE : Found Support Near 50-Day Moving Average After Recent Stall - 4/29/2024 |
View all notes |
Set NEW NOTE alert |
Company Profile |
SEC
News |
Chart |
Request a new note
C
A
S
I |
TDG
-
NYSE
TransDigm Group
Aerospace/Defense
|
$1,310.40
|
+8.77
0.67% |
$1,315.02
|
438,237
224.74% of 50 DAV
50 DAV is 195,000
|
$1,309.43
0.07%
|
4/12/2024
|
$1,224.21
|
PP = $1,246.32
|
|
MB = $1,308.64
|
Most Recent Note - 5/7/2024 12:39:29 PM
Y - Gapped down today after reporting Mar '24 quarterly earnings +34% on +21% sales revenues versus the year-ago period. Pulling back from a new all-time high after gains above the pivot point backed by at least +40% above average volume triggered a technical buy signal. Its 50 DMA line ($1,215) defines near-term support to watch on pullbacks.
>>> FEATURED STOCK ARTICLE : Found Support at 50-Day Moving Average Line and Hit New High - 4/30/2024 |
View all notes |
Set NEW NOTE alert |
Company Profile |
SEC
News |
Chart |
Request a new note
C
A
S
I |
USLM
-
NASDAQ
U.S. Lime & Minerals
Bldg-Cement/Concrt/Ag
|
$371.78
|
+11.53
3.20% |
$377.03
|
46,936
195.57% of 50 DAV
50 DAV is 24,000
|
$369.10
0.73%
|
2/9/2024
|
$254.68
|
PP = $265.09
|
|
MB = $278.34
|
Most Recent Note - 5/7/2024 12:41:34 PM
G - Posting a 8th consecutive gain today for yet another new all-time high. Its 50 DMA line ($297) and recent lows define near-term support to watch. Bullish action came after it reported Mar '24 quarterly earnings +31% on +7% sales revenues versus the year-ago period.
>>> FEATURED STOCK ARTICLE : Trading in Tight Range Near High - 4/26/2024 |
View all notes |
Set NEW NOTE alert |
Company Profile |
SEC
News |
Chart |
Request a new note
C
A
S
I |
PAY
-
NYSE
Paymentus Holdings
Finance-CrdtCard/PmtPr
|
$19.21
|
-2.99
-13.47% |
$21.22
|
1,485,203
347.01% of 50 DAV
50 DAV is 428,000
|
$25.21
-23.80%
|
3/5/2024
|
$19.97
|
PP = $18.89
|
|
MB = $19.83
|
Most Recent Note - 5/7/2024 5:23:34 PM
Reported strong Mar '24 quarterly results but violated its 50 DMA line ($20.66) and undercut the prior low with today's damaging volume-driven loss triggering a technical sell signal. Only a prompt rebound above the 50 DMA line would help its outlook improve. It will be dropped from the Featured Stocks list tonight. See the latest FSU analysis for more details and a new annotated graph.
>>> FEATURED STOCK ARTICLE : Damaging Volume-Driven Loss After Earnings News - 5/7/2024 |
View all notes |
Set NEW NOTE alert |
Company Profile |
SEC
News |
Chart |
Request a new note
C
A
S
I |
|
|
|
THESE ARE NOT BUY RECOMMENDATIONS!
Comments contained in the body of this report are technical
opinions only. The material herein has been obtained
from sources believed to be reliable and accurate, however,
its accuracy and completeness cannot be guaranteed.
This site is not an investment advisor, hence it does
not endorse or recommend any securities or other investments.
Any recommendation contained in this report may not
be suitable for all investors and it is not to be deemed
an offer or solicitation on our part with respect to
the purchase or sale of any securities. All trademarks,
service marks and trade names appearing in this report
are the property of their respective owners, and are
likewise used for identification purposes only.
This report is a service available
only to active Paid Premium Members.
You may opt-out of receiving report notifications
at any time. Questions or comments may be submitted
by writing to Premium Membership Services 665 S.E. 10 Street, Suite 201 Deerfield Beach, FL 33441-5634 or by calling 1-800-965-8307
or 954-785-1121.
|
|
|