***Last / Change / Volume data in this table is the closing quote data***
Symbol/Exchange
Company Name
Industry Group |
PRICE |
CHANGE
(%Change) |
Day High |
Volume
(% DAV)
(% 50 day avg vol) |
52 Wk Hi
% From Hi |
Featured
Date |
Price
Featured |
Pivot Featured |
|
Max Buy |
ACN
-
NYSE
Accenture Plc
DIVERSIFIED SERVICES - Business/Management Services
|
$60.22
|
-2.39
-3.82% |
$61.85
|
5,852,767
179.35% of 50 DAV
50 DAV is 3,263,400
|
$65.89
-8.61%
|
3/23/2012
|
$64.13
|
PP = $63.76
|
|
MB = $66.95
|
 Most Recent Note - 5/7/2012 1:23:00 PM
G - Triggering a worrisome technical sell signal as it gapped down today, sinking under prior highs in the $62-63 area. A weak finish on the prior session led to a close just below its 50 DMA line. Its color code is changed to green.
>>> The latest Featured Stock Update with an annotated graph appeared on 3/23/2012. Click here.
View all notes |
Alert me of new notes |
CANSLIM.net Company Profile |
SEC |
Zacks Reports |
StockTalk |
News |
Chart |
Request a new note
C
A N
S L
I M


|
ADS
-
NYSE
Alliance Data Sys Corp
COMPUTER SOFTWARE and SERVICES - Information and Delivery Service
|
$125.55
|
-0.86
-0.68% |
$126.32
|
353,755
62.08% of 50 DAV
50 DAV is 569,800
|
$130.66
-3.91%
|
1/17/2012
|
$108.24
|
PP = $107.43
|
|
MB = $112.80
|
Most Recent Note - 5/1/2012 6:31:47 PM
G - Still holding its ground near its all-time high today even after sub par earnings increases raised fundamental concerns. Its 50 DMA line defines important support to watch where any violation would trigger a technical sell signal.
>>> The latest Featured Stock Update with an annotated graph appeared on 4/24/2012. Click here.
View all notes |
Alert me of new notes |
CANSLIM.net Company Profile |
SEC |
Zacks Reports |
StockTalk |
News |
Chart |
Request a new note
C
A N
S L
I M
|
ALLT
-
NASDAQ
Allot Communications Ltd
COMPUTER SOFTWARE andamp; SERVICES - Technical andamp; System Software
|
$23.70
|
-1.71
-6.73% |
$25.24
|
696,421
151.69% of 50 DAV
50 DAV is 459,100
|
$26.97
-12.12%
|
3/13/2012
|
$19.72
|
PP = $18.91
|
|
MB = $19.86
|
Most Recent Note - 5/7/2012 1:27:26 PM
G - Pulling back from its all-time high with today's 3rd consecutive loss. It is extended from its prior base. Recent lows ($22.46 on 4/23/12) define near-term support above its 50 DMA line.
>>> The latest Featured Stock Update with an annotated graph appeared on 3/19/2012. Click here.
View all notes |
Alert me of new notes |
CANSLIM.net Company Profile |
SEC |
Zacks Reports |
StockTalk |
News |
Chart |
Request a new note
C
A N
S L
I M
|
ALXN
-
NASDAQ
Alexion Pharmaceuticals
DRUGS - Drug Manufacturers - Other
|
$86.39
|
-0.89
-1.02% |
$87.47
|
1,916,075
158.60% of 50 DAV
50 DAV is 1,208,100
|
$95.01
-9.07%
|
5/1/2012
|
$91.73
|
PP = $95.11
|
|
MB = $99.87
|
Most Recent Note - 5/7/2012 9:52:21 AM
G - Gapped down today after violating its 50 DMA line on the prior session and finishing near the session low. Did not trade above the new pivot point cited based on its 3/26/12 high plus 10 cents after building an orderly flat base. Previously noted - "The late-stage base may be a riskier set-up, yet volume-driven gains could trigger a new (or add-on) technical buy signal."
>>> The latest Featured Stock Update with an annotated graph appeared on 4/16/2012. Click here.
View all notes |
Alert me of new notes |
CANSLIM.net Company Profile |
SEC |
Zacks Reports |
StockTalk |
News |
Chart |
Request a new note
C
A N
S L
I M
|
ARBA
-
NASDAQ
Ariba Inc
INTERNET - Internet Software and Services
|
$39.70
|
+0.96
2.48% |
$40.29
|
1,508,405
152.67% of 50 DAV
50 DAV is 988,000
|
$40.45
-1.85%
|
4/27/2012
|
$38.53
|
PP = $37.24
|
|
MB = $39.10
|
Most Recent Note - 5/7/2012 1:25:34 PM
G - Color code is changed to green while rising above its "max buy" level today. Held its ground stubbornly since its technical breakout on 5 times average volume when highlighted in yellow in the 4/27/12 mid-day breakouts report (read here). Support to watch is at prior highs in the $35-37 area.
>>> The latest Featured Stock Update with an annotated graph appeared on 4/30/2012. Click here.
View all notes |
Alert me of new notes |
CANSLIM.net Company Profile |
SEC |
Zacks Reports |
StockTalk |
News |
Chart |
Request a new note
C
A N
S L
I M
|
Symbol/Exchange
Company Name
Industry Group |
PRICE |
CHANGE
(%Change) |
Day High |
Volume
(% DAV)
(% 50 day avg vol) |
52 Wk Hi
% From Hi |
Featured
Date |
Price
Featured |
Pivot Featured |
|
Max Buy |
CDNS
-
NASDAQ
Cadence Design Systems
COMPUTER SOFTWARE and SERVICES - Technical and System Software
|
$11.08
|
-0.12
-1.07% |
$11.20
|
1,665,510
61.72% of 50 DAV
50 DAV is 2,698,500
|
$12.60
-12.06%
|
2/3/2012
|
$11.66
|
PP = $11.15
|
|
MB = $11.71
|
Most Recent Note - 5/2/2012 4:04:14 PM
G - Its 50 DMA line has been acting as resistance and a rebound above that important short-term average is needed for its technical stance and outlook to improve.
>>> The latest Featured Stock Update with an annotated graph appeared on 3/28/2012. Click here.
View all notes |
Alert me of new notes |
CANSLIM.net Company Profile |
SEC |
Zacks Reports |
StockTalk |
News |
Chart |
Request a new note
C
A N
S L
I M
|
CERN
-
NASDAQ
Cerner Corp
COMPUTER SOFTWARE and SERVICES - Healthcare Information Service
|
$81.40
|
+0.92
1.14% |
$82.00
|
1,512,816
136.24% of 50 DAV
50 DAV is 1,110,400
|
$84.10
-3.21%
|
4/27/2012
|
$77.23
|
PP = $78.63
|
|
MB = $82.56
|
Most Recent Note - 5/1/2012 6:14:21 PM
G - This Computer Software - Medical firm rallied above its "max buy" level with today's 5th consecutive volume-driven gain and its color code was changed to green. See the latest FSU analysis for more details and a new annotated graph.
>>> The latest Featured Stock Update with an annotated graph appeared on 5/1/2012. Click here.
View all notes |
Alert me of new notes |
CANSLIM.net Company Profile |
SEC |
Zacks Reports |
StockTalk |
News |
Chart |
Request a new note
C
A N
S L
I M
|
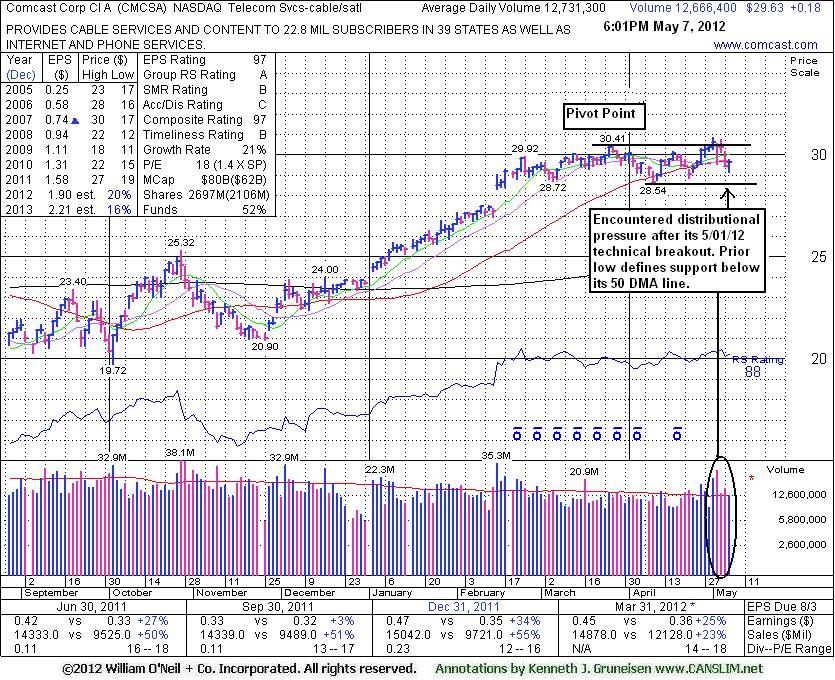
CMCSA
-
NASDAQ
Comcast Corp Cl A
MEDIA - CATV Systems
|
$29.63
|
+0.18
0.61% |
$29.79
|
12,667,534
99.50% of 50 DAV
50 DAV is 12,731,300
|
$30.88
-4.03%
|
5/2/2012
|
$30.04
|
PP = $30.51
|
|
MB = $32.04
|
Most Recent Note - 5/7/2012 6:26:56 PM
Y - Hovering near its 50 DMA line. Encountered distributional pressure after its 5/01/12 volume-driven gain triggered a technical buy signal while capping a streak of 6 consecutive gains to a new 52-week high and trading above its 2007 high. See the latest FSU analysis for more details and a new annotated graph.
>>> The latest Featured Stock Update with an annotated graph appeared on 5/7/2012. Click here.
View all notes |
Alert me of new notes |
CANSLIM.net Company Profile |
SEC |
Zacks Reports |
StockTalk |
News |
Chart |
Request a new note
C
A N
S L
I M
|
COO
-
NYSE
Cooper Companies Inc
HEALTH SERVICES - Medical Instruments and Supplies
|
$87.22
|
+0.22
0.25% |
$87.35
|
336,979
74.40% of 50 DAV
50 DAV is 452,900
|
$89.31
-2.34%
|
3/9/2012
|
$83.05
|
PP = $81.02
|
|
MB = $85.07
|
Most Recent Note - 5/3/2012 11:58:43 AM
G - Small gain today with above average volume conviction while trading at its 52-week and all-time highs above its "max buy" level. It is extended from its prior base. Prior highs in the $83-84 area define near-term support above its 50 DMA line.
>>> The latest Featured Stock Update with an annotated graph appeared on 3/9/2012. Click here.
View all notes |
Alert me of new notes |
CANSLIM.net Company Profile |
SEC |
Zacks Reports |
StockTalk |
News |
Chart |
Request a new note
C
A N
S L
I M
|
DG
-
NYSE
Dollar General Corp
RETAIL - Discount, Variety Stores
|
$48.21
|
+0.65
1.37% |
$48.60
|
3,987,290
164.68% of 50 DAV
50 DAV is 2,421,200
|
$48.76
-1.13%
|
5/7/2012
|
$48.51
|
PP = $47.69
|
|
MB = $50.07
|
Most Recent Note - 5/7/2012 12:30:05 PM
Y - Color code is changed to yellow with pivot point based on its 3/23/12 high plus 10 cents. Technically, volume-driven gains last week helped it rally from a 5-week flat base. Found support at its 50 DMA line and continued higher since last noted on 3/29/12 after completing another Secondary Offering while perched at an all-time high - "Reported earnings +38% on +20% sales revenues for the quarter ended January 31, 2012 versus the year ago period, showing encouraging acceleration in sequential quarterly sales and earnings increases. Its fundamentals (C & A criteria) are now resembling past great winners, and patient investors may watch for secondary buy points to possibly develop and be noted. Gapped up today and hit a new all-time high with another volume-driven gain. Secondary Offerings were completed on 9/08/11 and on 12/07/11. Its 50 DMA line acted as a support level throughout its ongoing advance, however it is too extended from any sound base pattern to meet the fact-based system's technical guidelines for buy candidates. "
There are no Featured Stock Updates™ available for this stock at this time. You may request one by clicking the Request a New Note link below
View all notes |
Alert me of new notes |
CANSLIM.net Company Profile |
SEC |
Zacks Reports |
StockTalk |
News |
Chart |
Request a new note
C
A N
S L
I M
|
Symbol/Exchange
Company Name
Industry Group |
PRICE |
CHANGE
(%Change) |
Day High |
Volume
(% DAV)
(% 50 day avg vol) |
52 Wk Hi
% From Hi |
Featured
Date |
Price
Featured |
Pivot Featured |
|
Max Buy |
DISH
-
NASDAQ
Dish Network Corp Cl A
CONSUMER DURABLES - Electronic Equipment
|
$30.93
|
-0.38
-1.21% |
$32.13
|
4,911,640
199.09% of 50 DAV
50 DAV is 2,467,100
|
$35.64
-13.22%
|
3/7/2012
|
$30.83
|
PP = $30.10
|
|
MB = $31.61
|
Most Recent Note - 5/4/2012 5:57:48 PM
G - Finished near the session low with a loss today on average volume, closing just under its 50 DMA line. Further deterioration below the 50 DMA or below recent lows ($29.93 on 4/18/12) would raise more serious concerns. Due to report its latest earnings on Monday, May 7, 2012.
>>> The latest Featured Stock Update with an annotated graph appeared on 3/14/2012. Click here.
View all notes |
Alert me of new notes |
CANSLIM.net Company Profile |
SEC |
Zacks Reports |
StockTalk |
News |
Chart |
Request a new note
C
A N
S L
I M
|
EXPE
-
NASDAQ
Expedia Inc
INTERNET - Internet Information Providers
|
$40.90
|
-0.08
-0.20% |
$41.38
|
4,814,119
112.15% of 50 DAV
50 DAV is 4,292,400
|
$43.92
-6.88%
|
4/27/2012
|
$41.80
|
PP = $35.57
|
|
MB = $37.35
|
Most Recent Note - 5/3/2012 6:16:41 PM
G - Consolidating after quickly getting extended from its prior base following its appearance highlighted in yellow in the 4/27/12 mid-day breakouts report (read here) after a considerable "breakaway gap" up. See the latest FSU analysis for more details and a new annotated graph.
>>> The latest Featured Stock Update with an annotated graph appeared on 5/3/2012. Click here.
View all notes |
Alert me of new notes |
CANSLIM.net Company Profile |
SEC |
Zacks Reports |
StockTalk |
News |
Chart |
Request a new note
C
A N
S L
I M
|
FEIC
-
NASDAQ
F E I Co
ELECTRONICS - Diversified Electronics
|
$47.33
|
-1.54
-3.15% |
$49.05
|
334,251
103.07% of 50 DAV
50 DAV is 324,300
|
$52.01
-9.00%
|
12/7/2011
|
$41.41
|
PP = $42.35
|
|
MB = $44.47
|
Most Recent Note - 5/7/2012 4:46:17 PM
G - Sank to its 50 DMA line today with a 3rd consecutive loss on near average volume since its "positive reversal" on 5/02/12 after reporting earnings +17% on +10% sales revenues for the quarter ended March 31, 2012 versus the year ago period. Disciplined investors make sell decisions based upon technical action alone, whereas buy decisions are to be made only when both fundamental and technical criteria met. Concerns were raised by its 2 consecutive quarters below the +25% minimum guideline for earnings growth.
>>> The latest Featured Stock Update with an annotated graph appeared on 3/12/2012. Click here.
View all notes |
Alert me of new notes |
CANSLIM.net Company Profile |
SEC |
Zacks Reports |
StockTalk |
News |
Chart |
Request a new note
C
A N
S L
I M
|
GNC
-
NYSE
G N C Holdings Inc
RETAIL - Drug Stores
|
$37.55
|
-0.06
-0.16% |
$38.29
|
1,501,243
77.72% of 50 DAV
50 DAV is 1,931,500
|
$41.95
-10.49%
|
1/19/2012
|
$28.99
|
PP = $29.60
|
|
MB = $31.08
|
Most Recent Note - 5/7/2012 4:48:04 PM
G - Consolidating -10.5% off its all-time high today with light volume behind its 3rd consecutive loss. Support to watch is at prior highs near $36 above its 50 DMA line. Reported earnings +82% on +23% sales revenues for the quarter ended March 31, 2012 versus the year ago period.
>>> The latest Featured Stock Update with an annotated graph appeared on 4/26/2012. Click here.
View all notes |
Alert me of new notes |
CANSLIM.net Company Profile |
SEC |
Zacks Reports |
StockTalk |
News |
Chart |
Request a new note
C
A N
S L
I M
|
ISRG
-
NASDAQ
Intuitive Surgical Inc
HEALTH SERVICES - Medical Appliances and Equipment
|
$564.00
|
-1.16
-0.21% |
$568.47
|
263,599
93.41% of 50 DAV
50 DAV is 282,200
|
$594.89
-5.19%
|
12/20/2011
|
$442.43
|
PP = $449.16
|
|
MB = $471.62
|
Most Recent Note - 5/3/2012 3:09:55 PM
G - Still stubbornly holding its ground near its all-time high with volume totals cooling since a considerable gap up gain on 4/18/12. It may produce more climactic gains, however it has not spent much time basing since its last "Featured Date" when highlighted in yellow on 12/23/11. It tallied 11 consecutive weekly gains. Disciplined investors always limit losses if any stock falls -7% from their purchase price.
>>> The latest Featured Stock Update with an annotated graph appeared on 3/1/2012. Click here.
View all notes |
Alert me of new notes |
CANSLIM.net Company Profile |
SEC |
Zacks Reports |
StockTalk |
News |
Chart |
Request a new note
C
A N
S L
I M
|
Symbol/Exchange
Company Name
Industry Group |
PRICE |
CHANGE
(%Change) |
Day High |
Volume
(% DAV)
(% 50 day avg vol) |
52 Wk Hi
% From Hi |
Featured
Date |
Price
Featured |
Pivot Featured |
|
Max Buy |
JAZZ
-
NASDAQ
Jazz Pharmaceuticals Plc
DRUGS - Biotechnology
|
$50.77
|
-0.02
-0.04% |
$51.00
|
512,660
50.67% of 50 DAV
50 DAV is 1,011,700
|
$54.50
-6.84%
|
4/27/2012
|
$51.93
|
PP = $51.39
|
|
MB = $53.96
|
Most Recent Note - 5/7/2012 1:13:08 PM
Y - Volume totals have been cooling while holding its ground near its pivot point and near its 52-week high. A considerable gap up gain on 4/27/12 backed by 4 times average volume technically cleared a "double bottom" base pattern.
>>> The latest Featured Stock Update with an annotated graph appeared on 4/27/2012. Click here.
View all notes |
Alert me of new notes |
CANSLIM.net Company Profile |
SEC |
Zacks Reports |
StockTalk |
News |
Chart |
Request a new note
C
A N
S L
I M
|
LULU
-
NASDAQ
Lululemon Athletica
MANUFACTURING - Textile Manufacturing
|
$77.28
|
-0.42
-0.54% |
$78.30
|
1,603,504
75.67% of 50 DAV
50 DAV is 2,119,200
|
$81.09
-4.70%
|
5/1/2012
|
$76.05
|
PP = $77.23
|
|
MB = $81.09
|
Most Recent Note - 5/2/2012 1:00:46 PM
Y - Recently found prompt support at its 50 DMA line. Volume is running at an above average pace today as it is hitting a new high. Gains backed by at least +40% above average volume while rising above the new pivot point cited based on its 4/05/12 high plus 10 cents may trigger a proper new (or add-on) technical buy signal.
>>> The latest Featured Stock Update with an annotated graph appeared on 4/12/2012. Click here.
View all notes |
Alert me of new notes |
CANSLIM.net Company Profile |
SEC |
Zacks Reports |
StockTalk |
News |
Chart |
Request a new note
C
A N
S L
I M
|
MA
-
NYSE
Mastercard Inc Cl A
DIVERSIFIED SERVICES - Business/Management Services
|
$436.12
|
-3.57
-0.81% |
$442.82
|
1,079,312
119.30% of 50 DAV
50 DAV is 904,700
|
$466.98
-6.61%
|
3/12/2012
|
$419.86
|
PP = $428.67
|
|
MB = $450.10
|
Most Recent Note - 5/4/2012 12:30:20 PM
G - Color code remains green even though it has retreated below its "max buy" level. Distributional action in recent weeks may be considered a warning sign while it is consolidating just above its 50 DMA line defining important near-term support to watch.
>>> The latest Featured Stock Update with an annotated graph appeared on 4/11/2012. Click here.
View all notes |
Alert me of new notes |
CANSLIM.net Company Profile |
SEC |
Zacks Reports |
StockTalk |
News |
Chart |
Request a new note
C
A N
S L
I M
|
MELI
-
NASDAQ
Mercadolibre Inc
INTERNET - Internet Software and; Services
|
$89.63
|
-3.23
-3.48% |
$90.34
|
968,401
208.44% of 50 DAV
50 DAV is 464,600
|
$104.50
-14.23%
|
5/1/2012
|
$99.34
|
PP = $102.98
|
|
MB = $108.13
|
Most Recent Note - 5/7/2012 9:49:13 AM
G - Gapped down today, trading further below its 50 DMA line and undercutting its prior low ($86.86 on 4/23/12) that was its second low (lower low) in a new "double bottom" pattern recently cited. The weakness hurt its technical stance and its color code is changed to green. It has encountered stubborn resistance in the $103-104 area. Due to report earnings on May 8, 2012 after the close.
>>> The latest Featured Stock Update with an annotated graph appeared on 3/29/2012. Click here.
View all notes |
Alert me of new notes |
CANSLIM.net Company Profile |
SEC |
Zacks Reports |
StockTalk |
News |
Chart |
Request a new note
C
A N
S L
I M
|
MG
-
NYSE
Mistras Group Inc
DIVERSIFIED SERVICES - Bulding and Faci;ity Management Services
|
$23.90
|
+0.66
2.84% |
$24.03
|
166,453
177.83% of 50 DAV
50 DAV is 93,600
|
$26.24
-8.92%
|
3/22/2012
|
$24.96
|
PP = $26.34
|
|
MB = $27.66
|
Most Recent Note - 5/7/2012 1:15:32 PM
G - Trading up above its 50 DMA line today. The next near-term support level is its 200 DMA line. Previously noted - "A volume-driven gain above its recent chart high ($25.49 on 3/21/12) may help trigger a proper technical buy signal after a new base formation, however no new (lower) pivot point is currently being cited, and it may continue encountering stubborn resistance."
>>> The latest Featured Stock Update with an annotated graph appeared on 4/2/2012. Click here.
View all notes |
Alert me of new notes |
CANSLIM.net Company Profile |
SEC |
Zacks Reports |
StockTalk |
News |
Chart |
Request a new note
C
A N
S L
I M
|
Symbol/Exchange
Company Name
Industry Group |
PRICE |
CHANGE
(%Change) |
Day High |
Volume
(% DAV)
(% 50 day avg vol) |
52 Wk Hi
% From Hi |
Featured
Date |
Price
Featured |
Pivot Featured |
|
Max Buy |
NTES
-
NASDAQ
Netease Inc Adr
INTERNET - Internet Information Providers
|
$60.08
|
+0.30
0.50% |
$60.99
|
632,538
95.30% of 50 DAV
50 DAV is 663,700
|
$61.45
-2.23%
|
3/19/2012
|
$56.18
|
PP = $55.10
|
|
MB = $57.86
|
Most Recent Note - 5/7/2012 12:42:50 PM
G - Still holding its ground stubbornly in a tight range near its 52-week high, slightly extended and trading above its "max buy" level. Recent lows and its 50 DMA line define support to watch in the $55 area.
>>> The latest Featured Stock Update with an annotated graph appeared on 3/27/2012. Click here.
View all notes |
Alert me of new notes |
CANSLIM.net Company Profile |
SEC |
Zacks Reports |
StockTalk |
News |
Chart |
Request a new note
C
A N
S L
I M
|
PCLN
-
NASDAQ
Priceline.Com Inc
INTERNET - Internet Software and Services
|
$737.65
|
+1.59
0.22% |
$752.46
|
1,046,960
86.48% of 50 DAV
50 DAV is 1,210,700
|
$774.96
-4.81%
|
4/27/2012
|
$539.46
|
PP = $774.96
|
|
MB = $813.71
|
Most Recent Note - 5/7/2012 1:19:10 PM
Y - Volume totals have been cooling since its 4/27/12 gap up gain, and it is perched within close striking distance of its 52-week high. Found support at its 50 DMA line on the latest pullback. Color code was changed to yellow while rallying from its first test of its 10-week moving average (WMA) since breaking out above resistance in the $554 area in February. The 4/27/12 mid-day report noted - "In the Certification they teach that after an earlier breakout a secondary buy point exists between the first successful test of the 10 WMA up to +5% above its latest high. The 2-week consolidation is not considered a sound base pattern, yet the pivot point cited is based on that recent high. Prior mid-day reports noted - 'Technically, it broke out on 2/13/12 with a volume-driven gain, and now it is getting extended from its prior base. Fundamentals have remained strong since dropped from the Featured Stocks list on 9/29/11. Patient investors may watch for secondary buy points to possibly develop and be noted.'"
>>> The latest Featured Stock Update with an annotated graph appeared on 9/22/2011. Click here.
View all notes |
Alert me of new notes |
CANSLIM.net Company Profile |
SEC |
Zacks Reports |
StockTalk |
News |
Chart |
Request a new note
C
A N
S L
I M
|
RAX
-
NYSE
Rackspace Hosting Inc
INTERNET - Internet Software and; Services
|
$57.80
|
-0.60
-1.03% |
$58.91
|
4,531,499
267.53% of 50 DAV
50 DAV is 1,693,800
|
$60.55
-4.54%
|
4/26/2012
|
$58.39
|
PP = $59.53
|
|
MB = $62.51
|
Most Recent Note - 5/7/2012 12:50:26 PM
Y - Holding its ground near its 52-week high. Volume-driven gains for new highs may trigger a new (or add-on) technical buy signal. Color code was recently changed to yellow with new pivot point cited based on its 3/27/12 high plus 10 cents following a 5-week consolidation.
>>> The latest Featured Stock Update with an annotated graph appeared on 4/10/2012. Click here.
View all notes |
Alert me of new notes |
CANSLIM.net Company Profile |
SEC |
Zacks Reports |
StockTalk |
News |
Chart |
Request a new note
C
A N
S L
I M
|
RGR
-
NYSE
Sturm Ruger & Co Inc
CONSUMER DURABLES - Sporting Goods
|
$52.08
|
-1.18
-2.22% |
$53.16
|
672,482
135.77% of 50 DAV
50 DAV is 495,300
|
$58.42
-10.85%
|
3/22/2012
|
$46.49
|
PP = $46.78
|
|
MB = $49.12
|
Most Recent Note - 5/3/2012 1:44:14 PM
G - Pulling back on heavy volume today. Recently reported earnings +88% on +49% sales revenues for the quarter ended March 31, 2012 versus the year ago period. It has been repeatedly noted - "Extended from any sound base and the 50 DMA line defines support to watch on pullbacks."
>>> The latest Featured Stock Update with an annotated graph appeared on 3/22/2012. Click here.
View all notes |
Alert me of new notes |
CANSLIM.net Company Profile |
SEC |
Zacks Reports |
StockTalk |
News |
Chart |
Request a new note
C
A N
S L
I M
|
RNF
-
NYSE
Rentech Nitrogen Ptnr Lp
CHEMICALS - Agricultural Chemicals
|
$27.38
|
-0.56
-2.00% |
$27.97
|
437,099
179.95% of 50 DAV
50 DAV is 242,900
|
$30.39
-9.92%
|
4/27/2012
|
$29.32
|
PP = $28.60
|
|
MB = $30.03
|
Most Recent Note - 5/2/2012 4:47:04 PM
Y - Is hovering near its 52-week high since highlighted in yellow in the 4/27/12 mid-day breakouts report (read here) when it gapped up above the pivot point cited based on its 4/12/12 high plus 10 cents. Reporting earnings on Friday, May 11, 2012. See the latest FSU analysis for more details and a new annotated graph.
>>> The latest Featured Stock Update with an annotated graph appeared on 5/2/2012. Click here.
View all notes |
Alert me of new notes |
CANSLIM.net Company Profile |
SEC |
Zacks Reports |
StockTalk |
News |
Chart |
Request a new note
C
A N
S L
I M
|
Symbol/Exchange
Company Name
Industry Group |
PRICE |
CHANGE
(%Change) |
Day High |
Volume
(% DAV)
(% 50 day avg vol) |
52 Wk Hi
% From Hi |
Featured
Date |
Price
Featured |
Pivot Featured |
|
Max Buy |
RRTS
-
NYSE
Roadrunner Trans Systems
TRANSPORTATION - Air Delivery and Freight Service
|
$18.07
|
-0.17
-0.93% |
$18.24
|
196,933
195.76% of 50 DAV
50 DAV is 100,600
|
$19.06
-5.19%
|
5/3/2012
|
$18.20
|
PP = $18.69
|
|
MB = $19.62
|
Most Recent Note - 5/4/2012 12:48:08 PM
Y - Holding its ground today following a gap up on the prior session. Color code was changed to yellow with new pivot point cited based on the 52-week high plus 10 cents. Its finish near the prior session low indicated that it encountered resistance, and it still needs a strong finish above the pivot point cited to clinch a proper technical buy signal. Reported earnings +79% on +38% sales revenues for the quarter ended March 31, 2012.
>>> The latest Featured Stock Update with an annotated graph appeared on 4/9/2012. Click here.
View all notes |
Alert me of new notes |
CANSLIM.net Company Profile |
SEC |
Zacks Reports |
StockTalk |
News |
Chart |
Request a new note
C
A N
S L
I M
|
SHFL
-
NASDAQ
Shuffle Master Inc
MANUFACTURING - Diversified Machinery
|
$17.16
|
-0.02
-0.12% |
$17.36
|
584,601
87.80% of 50 DAV
50 DAV is 665,800
|
$18.77
-8.58%
|
3/6/2012
|
$17.07
|
PP = $15.25
|
|
MB = $16.01
|
Most Recent Note - 5/2/2012 4:02:01 PM
G - Rebounded from lows near its 50 DMA and managed a positive reversal today. Its consolidation is not a sufficient length to be considered a sound new base pattern. It already has tested support at its 10-week moving average line multiple times this year, so it may not be considered an ideal "secondary buy point" now.
>>> The latest Featured Stock Update with an annotated graph appeared on 3/15/2012. Click here.
View all notes |
Alert me of new notes |
CANSLIM.net Company Profile |
SEC |
Zacks Reports |
StockTalk |
News |
Chart |
Request a new note
C
A N
S L
I M
|
SHOO
-
NASDAQ
Steven Madden Limited
CONSUMER NON-DURABLES - Textile - Apparel Footwear
|
$42.15
|
-0.46
-1.08% |
$43.03
|
474,115
134.23% of 50 DAV
50 DAV is 353,200
|
$45.70
-7.77%
|
4/27/2012
|
$43.20
|
PP = $45.32
|
|
MB = $47.59
|
Most Recent Note - 5/3/2012 12:49:22 PM
G - Rebounding from earlier lows following a gap down today after reporting earnings +22% on +60% sales revenues for the quarter ended March 31, 2012 versus the year ago period. Color code was changed to green based on fundamental and technical concerns after failing to break out from the previously noted "double bottom" base pattern. No recent buy signal was triggered. Sales revenues had shown impressive acceleration in the Jun, Sep, and Dec '11 quarterly comparisons with earnings increases above the +25% minimum guideline in the Sep and Dec '11 comparisons. Deterioration below the recent low ($40.91 on 4/24/12) would raise more serious concerns.
>>> The latest Featured Stock Update with an annotated graph appeared on 1/4/2011. Click here.
View all notes |
Alert me of new notes |
CANSLIM.net Company Profile |
SEC |
Zacks Reports |
StockTalk |
News |
Chart |
Request a new note
C
A N
S L
I M
|
SWI
-
NYSE
Solarwinds Inc
COMPUTER SOFTWARE and SERVICES - Application Software
|
$45.50
|
-1.61
-3.42% |
$46.80
|
1,277,785
115.27% of 50 DAV
50 DAV is 1,108,500
|
$47.66
-4.53%
|
4/26/2012
|
$45.15
|
PP = $42.32
|
|
MB = $44.44
|
Most Recent Note - 5/7/2012 1:09:56 PM
G - Pulling back today after holding its ground last week. Quickly got extended from its prior base after it triggered a technical buy signal on 4/26/12 as it was featured in the mid-day report and noted - "Reported earnings +43% on +39% sales revenues for the quarter ended March 31, 2012 versus the year ago period. It held its ground stubbornly after violating its 50 DMA line when a damaging loss with above average volume triggered technical sell signals on 4/10/12 and it was dropped from the Featured Stocks list. Earnings below the +25% guideline for the Dec '11 quarter (+21%) had also raised fundamental concerns at that time, however the stock's resilience and impressive acceleration means that 3 of the past 4 quarterly comparisons are now above the minimum guideline concerning the C criteria. Its annual earnings (A criteria) history has been strong."
>>> The latest Featured Stock Update with an annotated graph appeared on 3/16/2012. Click here.
View all notes |
Alert me of new notes |
CANSLIM.net Company Profile |
SEC |
Zacks Reports |
StockTalk |
News |
Chart |
Request a new note
C
A N
S L
I M
|
SXCI
-
NASDAQ
S X C Health Solutions
COMPUTER SOFTWARE and SERVICES - Healthcare Information Service
|
$89.24
|
-2.26
-2.47% |
$92.29
|
1,140,773
119.58% of 50 DAV
50 DAV is 954,000
|
$100.50
-11.20%
|
2/23/2012
|
$68.24
|
PP = $66.05
|
|
MB = $69.35
|
Most Recent Note - 5/3/2012 2:49:28 PM
G - Reported earnings +58% on +56% sales revenues for the quarter ended March 31, 2012 versus the year ago period. Volume and volatility often increase near earnings news. Pulling back toward recent lows, still too extended from its prior base to be buyable under the investment system's guidelines.
>>> The latest Featured Stock Update with an annotated graph appeared on 3/6/2012. Click here.
View all notes |
Alert me of new notes |
CANSLIM.net Company Profile |
SEC |
Zacks Reports |
StockTalk |
News |
Chart |
Request a new note
C
A N
S L
I M
|
Symbol/Exchange
Company Name
Industry Group |
PRICE |
CHANGE
(%Change) |
Day High |
Volume
(% DAV)
(% 50 day avg vol) |
52 Wk Hi
% From Hi |
Featured
Date |
Price
Featured |
Pivot Featured |
|
Max Buy |
TDC
-
NYSE
Teradata Corp
COMPUTER SOFTWARE and SERVICES - Technical and; System Software
|
$72.19
|
-0.95
-1.30% |
$73.75
|
3,002,334
213.58% of 50 DAV
50 DAV is 1,405,700
|
$79.89
-9.64%
|
5/3/2012
|
$79.06
|
PP = $70.73
|
|
MB = $74.27
|
Most Recent Note - 5/4/2012 12:51:53 PM
Y - Pulling back today near its "max buy" level following 3 consecutive volume-driven gains into new high territory. The 5/03/12 mid-day report noted - "Volume-driven gains this week have it rallying from a tight consolidation and "square box" base above its 50 DMA line. Color code is changed to yellow with pivot point based on its 4/03/12 high plus 10 cents. Hit a new 52-week high today with a gap up and considerable volume-driven gain, quickly getting extended from an ideal buy range. Technically, on 2/09/11 it broke out from a 15-week cup shaped base without a handle. The 4 latest quarterly comparisons showed earnings increases satisfying the C criteria and it has a good annual earnings (A criteria) history."
There are no Featured Stock Updates™ available for this stock at this time. You may request one by clicking the Request a New Note link below
View all notes |
Alert me of new notes |
CANSLIM.net Company Profile |
SEC |
Zacks Reports |
StockTalk |
News |
Chart |
Request a new note
C
A N
S L
I M
|
TDG
-
NYSE
Transdigm Group Inc
AEROSPACE/DEFENSE - Aerospace/Defense Products and; Services
|
$127.43
|
-0.13
-0.10% |
$128.33
|
964,889
222.38% of 50 DAV
50 DAV is 433,900
|
$130.09
-2.04%
|
2/29/2012
|
$120.10
|
PP = $118.93
|
|
MB = $124.88
|
Most Recent Note - 5/7/2012 12:59:04 PM
G - Hovering near its all-time high, extended from its prior base and above its "max buy" level. Prior highs in the $118-121 area define initial chart support to watch on pullbacks.
>>> The latest Featured Stock Update with an annotated graph appeared on 3/30/2012. Click here.
View all notes |
Alert me of new notes |
CANSLIM.net Company Profile |
SEC |
Zacks Reports |
StockTalk |
News |
Chart |
Request a new note
C
A N
S L
I M
|
TIBX
-
NASDAQ
Tibco Software Inc
COMPUTER SOFTWARE and SERVICES - Business Software and Services
|
$32.04
|
-0.66
-2.02% |
$32.70
|
2,605,639
87.95% of 50 DAV
50 DAV is 2,962,600
|
$34.67
-7.58%
|
3/30/2012
|
$31.01
|
PP = $31.25
|
|
MB = $32.81
|
Most Recent Note - 5/3/2012 2:51:58 PM
G - Consolidating well above support at prior highs in the $31 area and its 50 DMA line. It is extended from its prior base.
>>> The latest Featured Stock Update with an annotated graph appeared on 4/5/2012. Click here.
View all notes |
Alert me of new notes |
CANSLIM.net Company Profile |
SEC |
Zacks Reports |
StockTalk |
News |
Chart |
Request a new note
C
A N
S L
I M
|
TNGO
-
NASDAQ
Tangoe Inc
COMPUTER SOFTWARE and SERVICES - Technical and System Software
|
$19.48
|
-0.32
-1.62% |
$19.83
|
594,027
99.37% of 50 DAV
50 DAV is 597,800
|
$21.74
-10.40%
|
3/27/2012
|
$19.35
|
PP = $20.00
|
|
MB = $21.00
|
Most Recent Note - 5/4/2012 1:21:18 PM
Y - Loss today has it retreating below its pivot point again. A close below its recent low close ($19.53 on 4/24/12) would raise more serious concerns of technical deterioration while negating its 4/19/12 breakout. The 50 DMA line defines important near-term support to watch.
>>> The latest Featured Stock Update with an annotated graph appeared on 4/3/2012. Click here.
View all notes |
Alert me of new notes |
CANSLIM.net Company Profile |
SEC |
Zacks Reports |
StockTalk |
News |
Chart |
Request a new note
C
A N
S L
I M
|
TSCO
-
NASDAQ
Tractor Supply Co
SPECIALTY RETAIL - Specialty Retail, Other
|
$95.99
|
-0.49
-0.51% |
$96.75
|
549,151
70.44% of 50 DAV
50 DAV is 779,600
|
$101.20
-5.15%
|
5/1/2012
|
$98.38
|
PP = $101.30
|
|
MB = $106.37
|
Most Recent Note - 5/1/2012 6:20:55 PM
Y - Color code is changed to yellow with new pivot point cited based on its 4/19/12 high plus 10 cents after forming an advanced "3-weeks tight" base pattern. Volume-driven gains to new highs may trigger a new (or add-on) technical buy signal. Its 50 DMA line defines support to watch on pullbacks.
>>> The latest Featured Stock Update with an annotated graph appeared on 4/17/2012. Click here.
View all notes |
Alert me of new notes |
CANSLIM.net Company Profile |
SEC |
Zacks Reports |
StockTalk |
News |
Chart |
Request a new note
C
A N
S L
I M
|
Symbol/Exchange
Company Name
Industry Group |
PRICE |
CHANGE
(%Change) |
Day High |
Volume
(% DAV)
(% 50 day avg vol) |
52 Wk Hi
% From Hi |
Featured
Date |
Price
Featured |
Pivot Featured |
|
Max Buy |
UA
-
NYSE
Under Armour Inc Cl A
CONSUMER NON-DURABLES - Textile - Apparel Clothing
|
$96.81
|
+0.28
0.29% |
$97.38
|
706,042
72.47% of 50 DAV
50 DAV is 974,300
|
$102.86
-5.88%
|
2/15/2012
|
$85.77
|
PP = $84.86
|
|
MB = $89.10
|
Most Recent Note - 5/1/2012 6:23:25 PM
G - Remains perched above its 50 DMA line very near its all-time high. No overhead supply remains to act as resistance, however no new pivot point was cited following its latest base. Concerns were raised by weaker fundamentals. Reported earnings +22% on +23% sales revenues for the quarter ended March 31, 2012 versus the year ago period, its first quarterly earnings increase below the +25% minimum guideline in more than 2 years.
>>> The latest Featured Stock Update with an annotated graph appeared on 4/4/2012. Click here.
View all notes |
Alert me of new notes |
CANSLIM.net Company Profile |
SEC |
Zacks Reports |
StockTalk |
News |
Chart |
Request a new note
C
A N
S L
I M
|
ULTA
-
NASDAQ
Ulta Salon Cosm & Frag
SPECIALTY RETAIL - Specialty Retail, Other
|
$86.06
|
-1.43
-1.63% |
$87.55
|
802,293
117.43% of 50 DAV
50 DAV is 683,200
|
$96.65
-10.96%
|
1/11/2012
|
$71.97
|
PP = $75.80
|
|
MB = $79.59
|
Most Recent Note - 5/1/2012 6:28:53 PM
G - After its damaging loss violating its 50 DMA line on 4/24/12 raised concerns and triggered a technical sell signal that short-term average has been acting as resistance. Prior highs in the $75 area are the next important support level to watch.
>>> The latest Featured Stock Update with an annotated graph appeared on 4/23/2012. Click here.
View all notes |
Alert me of new notes |
CANSLIM.net Company Profile |
SEC |
Zacks Reports |
StockTalk |
News |
Chart |
Request a new note
C
A N
S L
I M
|
V
-
NYSE
Visa Inc Cl A
DIVERSIFIED SERVICES - Business/Management Services
|
$118.51
|
+0.72
0.61% |
$119.09
|
3,368,938
100.68% of 50 DAV
50 DAV is 3,346,200
|
$125.35
-5.46%
|
3/12/2012
|
$116.53
|
PP = $119.46
|
|
MB = $125.43
|
Most Recent Note - 5/4/2012 12:57:25 PM
Y - Rebounding near its 50 DMA line which may now act as a resistance level after the technical violation on the prior session. Previously noted - "Reported earnings +30% on +15% sales revenues for the quarter ended March 31, 2012 versus the year ago period. It dipped below its 50 DMA line with today's 2nd consecutive loss with above average volume, trading to its lowest level since its 4/13/12 gain backed by +49% above average volume technically confirmed a buy signal."
>>> The latest Featured Stock Update with an annotated graph appeared on 3/7/2012. Click here.
View all notes |
Alert me of new notes |
CANSLIM.net Company Profile |
SEC |
Zacks Reports |
StockTalk |
News |
Chart |
Request a new note
C
A N
S L
I M
|
VMW
-
NYSE
Vmware Inc Cl A
COMPUTER SOFTWARE andamp; SERVICES - Technical andamp; System Software
|
$107.60
|
-0.42
-0.39% |
$109.46
|
992,973
62.10% of 50 DAV
50 DAV is 1,599,000
|
$118.79
-9.42%
|
4/18/2012
|
$110.04
|
PP = $115.29
|
|
MB = $121.05
|
Most Recent Note - 5/4/2012 6:01:22 PM
Y - Pulled back with near average but higher volume today, finishing near its 50 DMA line. It recently attracted institutional support near that important short-term average. Subsequent losses may raise greater concerns, and its prior low ($102.66 on 4/24/12) defines the next important near-term support level.
>>> The latest Featured Stock Update with an annotated graph appeared on 4/18/2012. Click here.
View all notes |
Alert me of new notes |
CANSLIM.net Company Profile |
SEC |
Zacks Reports |
StockTalk |
News |
Chart |
Request a new note
C
A N
S L
I M
|
VSI
-
NYSE
Vitamin Shoppe Inc
SPECIALTY RETAIL - Specialty Retail, Other
|
$44.76
|
-0.66
-1.45% |
$46.00
|
996,538
287.68% of 50 DAV
50 DAV is 346,400
|
$49.27
-9.15%
|
4/25/2012
|
$47.77
|
PP = $48.46
|
|
MB = $50.88
|
Most Recent Note - 5/7/2012 4:54:22 PM
Y - Finished above its 50 DMA line after trading below that important short-term average while volume was nearly 3 times average behind today's 3rd consecutive loss. Reports earnings before the open Tuesday, May 8th for the quarter ended March 31, 2012. Since featured in yellow on 4/25/12 it has been encountering distributional pressure (losses on higher volume) near its 52-week high and pivot point, not yet triggering a technical buy signal.
>>> The latest Featured Stock Update with an annotated graph appeared on 4/25/2012. Click here.
View all notes |
Alert me of new notes |
CANSLIM.net Company Profile |
SEC |
Zacks Reports |
StockTalk |
News |
Chart |
Request a new note
C
A N
S L
I M
|
Symbol/Exchange
Company Name
Industry Group |
PRICE |
CHANGE
(%Change) |
Day High |
Volume
(% DAV)
(% 50 day avg vol) |
52 Wk Hi
% From Hi |
Featured
Date |
Price
Featured |
Pivot Featured |
|
Max Buy |
WFM
-
NASDAQ
Whole Foods Market Inc
RETAIL - Grocery Stores
|
$89.81
|
-0.15
-0.17% |
$90.28
|
1,947,052
128.33% of 50 DAV
50 DAV is 1,517,200
|
$91.50
-1.85%
|
5/3/2012
|
$90.28
|
PP = $86.45
|
|
MB = $90.77
|
Most Recent Note - 5/4/2012 1:09:32 PM
Y - Holding its ground today after highlighted in yellow in the 5/03/12 mid-day report while breaking out above the pivot point based on its 52-week high plus 10 cents. Its considerable "breakaway gap" for a new 52-week high was backed by 5 times average volume as it cleared an orderly flat base pattern. The is no resistance remaining due to overhead supply. Reported earnings +25% on +14% sales revenues for the quarter ended March 31, 2012 versus the year ago period. Quarterly comparisons have shown strong earnings increases above the +25% guideline. Its annual earnings (A criteria) history has been improving since a downturn in FY '08.

There are no Featured Stock Updates™ available for this stock at this time. You may request one by clicking the Request a New Note link below
View all notes |
Alert me of new notes |
CANSLIM.net Company Profile |
SEC |
Zacks Reports |
StockTalk |
News |
Chart |
Request a new note
C
A N
S L
I M
|