You are not logged in.
This means
you CAN ONLY VIEW reports that were published prior to Monday, April 14, 2025.
You
MUST UPGRADE YOUR MEMBERSHIP if you want to see any current reports.
 MIDDAY BREAKOUTS REPORT - FRIDAY, MAY 4TH, 2012 MIDDAY BREAKOUTS REPORT - FRIDAY, MAY 4TH, 2012
Previous Mid Day Report Next Mid Day Report >>>
|
|
DOW 13031.99 -174.6 (-1.32%) | NASDAQ 2964.68 -59.6 (-1.97%) | S&P 500 1369.08 -22.49 (-1.62%)
|
Time of Screening :
5/4/2012 12:05:41 PM Report Released :
5/4/2012 1:11:03 PM
Price is:
Above 52W High and Less Than 52W High
but within 7% of the 52 Week High
Volume Is:
At least 75% of 50 Day Average at
the time of the screening.
More details about this report...
At around
mid-way through each trading day we run
a screen against our database of
high-ranked stocks, searching for
possible buy candidates that are trading
at or near their 52-week high on above
average volume. The results of that
screen are split into the two sections
you see below. The first, titled
"TODAY's FEATURED STOCKS" shows stocks
that our experts have recently
identified as among the strongest candidates to
consider. Stocks highlighted in yellow
are the most timely and noteworthy, so
particular attention and prompt action
may be appropriate. The second section,
titled "TODAY's BREAKOUT SCREEN" shows
the remainder of stocks meeting today's
screen parameters. Our experts have
reviewed and included notes on these
stocks as well, but found that they may
not match up as favorably.
|
|
Y - Today's strongest
candidates
highlighted
by our staff
of experts.
|
|
G - Previously featured in
this report as yellow and
now may no longer be buyable
under the guidelines.
|
|
|
Symbol/Exchange
Company Name
Industry Group |
PRICE |
CHANGE
(%Change) |
Day High |
Volume
(% DAV)
(50 DAV) |
52 Wk Hi
% From Hi |
Date
Featured |
Price
Featured |
Pivot Point |
|
Max Buy |
MA
- NYSE
Mastercard Inc Cl A
|
$440.35
|
-2.08
-0.47%
|
$441.91
|
772,330
86.61% of 50 DAV
50 DAV is 891,700
|
$466.98
-5.70%
|
3/12/2012 |
$419.86
|
PP = $428.67
MB = $450.10 |
Most Recent Note - 5/4/2012 12:30:20 PM
G - Color code remains green even though it has retreated below its "max buy" level. Distributional action in recent weeks may be considered a warning sign while it is consolidating just above its 50 DMA line defining important near-term support to watch.
>>> The latest Featured Stock Update with an annotated graph appeared on 4/11/2012. Click here.
|
|
View all notes |
Alert me of new notes |
Company Profile |
SEC |
News |
Chart | C
A N
S L
I M
|
NTES
- NASDAQ
Netease Inc Adr
|
$59.81
|
-0.10
-0.17%
|
$60.00
|
521,479
80.12% of 50 DAV
50 DAV is 650,900
|
$61.45
-2.67%
|
3/19/2012 |
$56.18
|
PP = $55.10
MB = $57.86 |
Most Recent Note - 5/4/2012 12:39:24 PM
G - Holding its ground stubbornly this week in a tight range near its 52-week high. Recent lows and its 50 DMA line define support to watch in the $55 area.
>>> The latest Featured Stock Update with an annotated graph appeared on 3/27/2012. Click here.
|
|
View all notes |
Alert me of new notes |
Company Profile |
SEC |
News |
Chart | C
A N
S L
I M
|
RRTS
- NYSE
Roadrunner Trans Systems
|
$18.16
|
+0.05
0.28%
|
$18.35
|
131,954
128.61% of 50 DAV
50 DAV is 102,600
|
$19.06
-4.72%
|
5/3/2012 |
$18.20
|
PP = $18.69
MB = $19.62 |
Most Recent Note - 5/4/2012 12:48:08 PM
Y - Holding its ground today following a gap up on the prior session. Color code was changed to yellow with new pivot point cited based on the 52-week high plus 10 cents. Its finish near the prior session low indicated that it encountered resistance, and it still needs a strong finish above the pivot point cited to clinch a proper technical buy signal. Reported earnings +79% on +38% sales revenues for the quarter ended March 31, 2012.
>>> The latest Featured Stock Update with an annotated graph appeared on 4/9/2012. Click here.
|
|
View all notes |
Alert me of new notes |
Company Profile |
SEC |
News |
Chart | C
A N
S L
I M
|
TDC
- NYSE
Teradata Corp
|
$74.43
|
-2.71
-3.51%
|
$76.59
|
1,646,480
120.90% of 50 DAV
50 DAV is 1,361,800
|
$79.89
-6.83%
|
5/3/2012 |
$79.06
|
PP = $70.73
MB = $74.27 |
Most Recent Note - 5/4/2012 12:51:53 PM
Y - Pulling back today near its "max buy" level following 3 consecutive volume-driven gains into new high territory. The 5/03/12 mid-day report noted - "Volume-driven gains this week have it rallying from a tight consolidation and "square box" base above its 50 DMA line. Color code is changed to yellow with pivot point based on its 4/03/12 high plus 10 cents. Hit a new 52-week high today with a gap up and considerable volume-driven gain, quickly getting extended from an ideal buy range. Technically, on 2/09/11 it broke out from a 15-week cup shaped base without a handle. The 4 latest quarterly comparisons showed earnings increases satisfying the C criteria and it has a good annual earnings (A criteria) history."
There are no Featured Stock Updates™ available for this stock at this time. You may request one by clicking the Request a New Note link below
|
|
View all notes |
Alert me of new notes |
Company Profile |
SEC |
News |
Chart | C
A N
S L
I M
|
V
- NYSE
Visa Inc Cl A
|
$118.47
|
+2.06
1.77%
|
$118.49
|
2,724,065
82.96% of 50 DAV
50 DAV is 3,283,600
|
$125.35
-5.49%
|
3/12/2012 |
$116.53
|
PP = $119.46
MB = $125.43 |
Most Recent Note - 5/4/2012 12:57:25 PM
Y - Rebounding near its 50 DMA line which may now act as a resistance level after the technical violation on the prior session. Previously noted - "Reported earnings +30% on +15% sales revenues for the quarter ended March 31, 2012 versus the year ago period. It dipped below its 50 DMA line with today's 2nd consecutive loss with above average volume, trading to its lowest level since its 4/13/12 gain backed by +49% above average volume technically confirmed a buy signal."
>>> The latest Featured Stock Update with an annotated graph appeared on 3/7/2012. Click here.
|
|
View all notes |
Alert me of new notes |
Company Profile |
SEC |
News |
Chart | C
A N
S L
I M
|
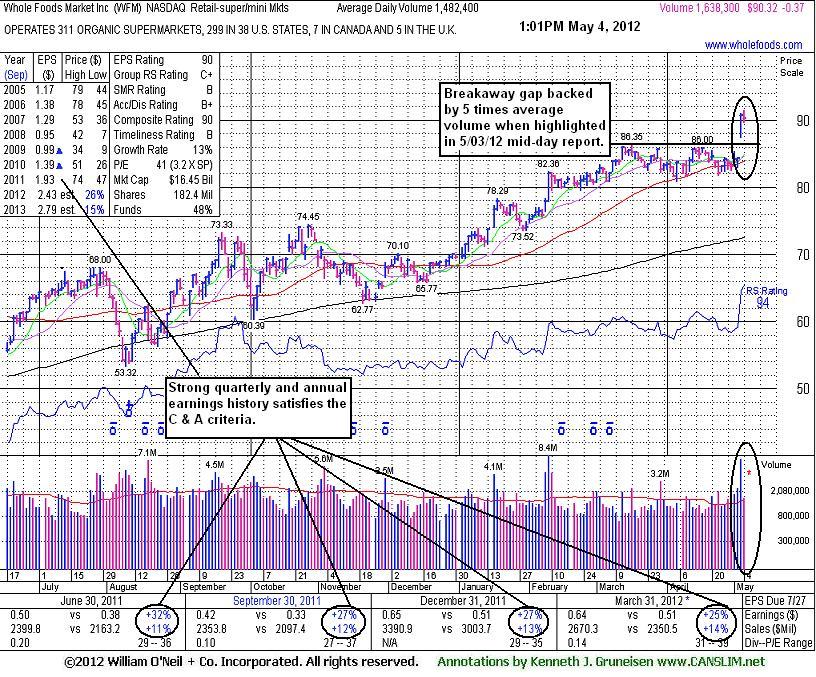
WFM
- NASDAQ
Whole Foods Market Inc
|
$90.14
|
-0.55
-0.61%
|
$91.50
|
1,423,007
95.99% of 50 DAV
50 DAV is 1,482,400
|
$91.50
-1.49%
|
5/3/2012 |
$90.28
|
PP = $86.45
MB = $90.77 |
Most Recent Note - 5/4/2012 1:09:32 PM
Y - Holding its ground today after highlighted in yellow in the 5/03/12 mid-day report while breaking out above the pivot point based on its 52-week high plus 10 cents. Its considerable "breakaway gap" for a new 52-week high was backed by 5 times average volume as it cleared an orderly flat base pattern. The is no resistance remaining due to overhead supply. Reported earnings +25% on +14% sales revenues for the quarter ended March 31, 2012 versus the year ago period. Quarterly comparisons have shown strong earnings increases above the +25% guideline. Its annual earnings (A criteria) history has been improving since a downturn in FY '08.
There are no Featured Stock Updates™ available for this stock at this time. You may request one by clicking the Request a New Note link below
|
|
View all notes |
Alert me of new notes |
Company Profile |
SEC |
News |
Chart | C
A N
S L
I M
|
|
 |
Symbol - Exchange - Industry Group
Company Name |
Last |
Chg |
Day
High |
52 WK Hi |
% From Hi |
Volume
% DAV |
DAV |
ASNA
- NASDAQ - RETAIL - Apparel Stores
Ascena Retail Group Inc
|
$21.58 |
+0.10
0.47%
|
$22.07
|
$22.62
|
-4.60% |
1,598,536
111.32%
|
1,436,000
|
Most Recent Note for ASNA - 5/4/2012 12:07:54 PM
Rebounded above its 50 DMA line with 2 consecutive volume-driven gains following news it will acquire Charming Shoppes Inc (CHSI). Reported earnings +42% on +15% sales revenues for the quarter ended January 31, 2012 versus the year ago period. The 3 prior quarterly comparisons were clearly below the minimum +25% earnings guideline, missing the C criteria. Annual earnings (A criteria) history has been up and down, not steady and strong.
|
|
View all notes |
Alert me of new notes |
Company Profile |
SEC |
News |
Chart | C
A N
S L
I M
|
BOFI
- NASDAQ - BANKING - Savings & Loans
B O F I Holding Inc
|
$18.11 |
+0.20
1.12%
|
$18.12
|
$18.49
|
-2.06% |
38,787
123.92%
|
31,300
|
Most Recent Note for BOFI - 5/4/2012 12:11:26 PM
Still hovering at its 52-week and all-time highs today, holding its ground in a tight trading range above its 50 DMA line. Completed a new Public Offering on 12/07/11. There are 8.79 million shares reportedly in the publicly traded float now. Quarterly and annual earnings history are not a match with the C & A criteria but it has earned high ranks.
|
|
View all notes |
Alert me of new notes |
Company Profile |
SEC |
News |
Chart | C
A N
S L
I M
|
CVU
- AMEX - AEROSPACE/DEFENSE - Aerospace/Defense Products & Services
C P I Aerostructures Inc
|
$15.50 |
-0.05
-0.32%
|
$15.63
|
$16.42
|
-5.60% |
15,427
76.00%
|
20,300
|
Most Recent Note for CVU - 5/4/2012 12:14:44 PM
Consolidating near its 50 DMA line and perched near its 52-week and multi-year highs. Quarterly and annual earnings have been erratic while it survived but failed to impress since last noted in the 12/02/10 mid-day report - "Average daily volume has picked up from near 22,000 shares when last noted to near 42,000 shares per day now. Earnings increases have been mostly strong in recent quarterly comparisons and annual earnings have been on the rise since it tallied a loss in FY '06. Quarterly sales revenues in the $9-13 million range are rather minuscule, yet this Aerospace/Defense firm showed a solid +31% sales revenues increase and +40% earnings for the quarter ended September 30, 2010 versus the year ago period."
|
|
View all notes |
Alert me of new notes |
Company Profile |
SEC |
News |
Chart | C
A N
S L
I M
|
EC
- NYSE - ENERGY - Independent Oil & Gas
Ecopetrol Sa Adr
|
$64.88 |
-1.56
-2.35%
|
$66.00
|
$67.92
|
-4.48% |
528,499
80.43%
|
657,100
|
Most Recent Note for EC - 5/4/2012 12:16:47 PM
Rallied to a new all-time high after finding support at its 50 DMA line last week. It is extended from any sound base pattern. Reported earnings +64% on +61% sales revenues for the Dec '11 quarter. Continued rising since the 2/29/12 mid-day report noted - "The Colombian Oil and Gas - Integrated firm reported a +128% earnings increase for the latest quarter ended September 30, 2011 on +56% sales revenues versus the year earlier period. Prior quarterly comparisons have shown great improvement, however a downturn in FY '09 earnings was previously noted as a flaw in its earnings history (A criteria) since public trading began in September 2008."
|
|
View all notes |
Alert me of new notes |
Company Profile |
SEC |
News |
Chart | C
A N
S L
I M
|
EL
- NYSE - CONSUMER NON-DURABLES - Personal Products
Estee Lauder Cos Cl A
|
$61.24 |
-2.91
-4.54%
|
$62.62
|
$65.60
|
-6.65% |
2,017,775
110.33%
|
1,828,800
|
Most Recent Note for EL - 5/4/2012 12:19:25 PM
Gapped down today and violated its 50 DMA line. Sales revenues and earnings decelerated in recent quarterly comparisons through Mar '12 and it is not a match with the investment system's guidelines. It survived but failed to impress since last noted in the 7/01/11 mid-day report - "Found support near its 50 DMA line throughout its ongoing advance. Reported earnings +109% on +16% sales revenues for the quarter ended March 31, 2011 versus the year ago period. Quarterly earnings results and sales revenues increases do not solidly meet the fact-based system's guidelines and its annual earnings (A criteria) history has been up and down."
|
|
View all notes |
Alert me of new notes |
Company Profile |
SEC |
News |
Chart | C
A N
S L
I M
|
HAIN
- NASDAQ - FOOD & BEVERAGE - Processed & Packaged Goods
Hain Celestial Group
|
$50.87 |
+3.56
7.52%
|
$51.48
|
$51.48
|
-1.18% |
893,493
240.83%
|
371,000
|
Most Recent Note for HAIN - 5/4/2012 12:25:13 PM
Hit a new 52-week high today with a volume driven gain. Reported earnings +50% on +32% sales revenues for the quarter ended March 31, 20-12 versus the year ago period. Earnings were above the +25% minimum guideline in 3 of the past 4 quarterly comparisons satisfying the C criteria, however fundamental concerns remain regarding its annual earnings (A criteria) history. Last noted in the 5/31/11 mid-day report - "Found support near its 50 DMA line throughout its ongoing ascent violation. Cluster buying by company insiders in recent months was noted as a reassuring sign. Recent quarterly comparisons show sales revenues and earnings improvements helping it better satisfy the C criteria, but a downturn in FY '09 and FY '10 is a flaw with respect to the A criteria."
|
|
View all notes |
Alert me of new notes |
Company Profile |
SEC |
News |
Chart | C
A N
S L
I M
|
LQDT
- NASDAQ - INTERNET - Internet Software &; Services
Liquidity Services Inc
|
$64.00 |
+1.76
2.83%
|
$64.68
|
$64.68
|
-1.05% |
350,908
79.68%
|
440,400
|
Most Recent Note for LQDT - 5/4/2012 12:26:21 PM
Up again today following a gap up and considerable volume-driven gain on the prior session for a new all-time high. Reported earnings +100% on +41% sales revenues for the quarter ended March 31, 2012 versus the year ago period. Recently found support at its 50 DMA line, and bullish action has continued since noted in the 2/13/12 mid-day report - "It has not formed a sound base pattern. After a gap down on 2/01/12 it managed an impressive positive reversal to close above its 50 DMA line for the first time in more than a week. Reported earnings +85% on +41% sales revenues for the quarter ended December 31, 2011 versus the year ago period. Quarterly earnings increases have been above the +25% guideline satisfying the C criteria. Its annual earnings had a downward turn in FY '09 which has been noted as a flaw concerning the A criteria."
|
|
View all notes |
Alert me of new notes |
Company Profile |
SEC |
News |
Chart | C
A N
S L
I M
|
MAIN
- NYSE - LEISURE - Restaurants
Main Street Capital Corp
|
$24.99 |
-0.47
-1.85%
|
$26.00
|
$26.76
|
-6.62% |
223,211
95.63%
|
233,400
|
Most Recent Note for MAIN - 5/4/2012 12:31:37 PM
Following its rally from an orderly 6-week "square box" base it has retreated to its 50 DMA line again. Prior mid-day reports noted - "It completed Public Offerings on 3/22/11 and 10/19/11. Quarterly comparisons have shown strong sales revenues and earnings increases satisfying the C criteria. A downturn in FY '09 earnings is a flaw concerning the A criteria.'"
|
|
View all notes |
Alert me of new notes |
Company Profile |
SEC |
News |
Chart | C
A N
S L
I M
|
MBWM
- NASDAQ - BANKING - Regional - Midwest Banks
Mercantile Bank Corp
|
$15.34 |
-0.02
-0.13%
|
$15.49
|
$15.49
|
-0.97% |
21,506
94.32%
|
22,800
|
Most Recent Note for MBWM - 5/4/2012 12:33:22 PM
Sales revenues and earnings history is not a match with the fact-based investment system's guidelines today. It survived but failed to impress since last noted in the 7/25/05 mid-day report - "Technically not desirable."
|
|
View all notes |
Alert me of new notes |
Company Profile |
SEC |
News |
Chart | C
A N
S L
I M
|
MR
- NYSE - HEALTH SERVICES - Medical Appliances &; Equipment
Mindray Medical Intl Ads
|
$32.02 |
-0.01
-0.03%
|
$32.24
|
$34.07
|
-6.02% |
365,316
77.14%
|
473,600
|
Most Recent Note for MR - 5/4/2012 12:35:42 PM
Hovering in a tight range for the past 6 weeks and now consolidating near its 50 DMA line. Last noted after a spurt of volume-driven gains in the 4/02/12 mid-day report - "Additional overhead supply remains to act as resistance up through the $40 area. Fundamentals remain below the fact-based investment system's guidelines. It survived but failed to impress since it was dropped from the Featured Stocks list on 1/16/08."
|
|
View all notes |
Alert me of new notes |
Company Profile |
SEC |
News |
Chart | C
A N
S L
I M
|
MWIV
- NASDAQ - HEALTH SERVICES - Medical Instruments &; Supplies
M W I Veterinary Supply
|
$96.56 |
+0.07
0.07%
|
$98.72
|
$100.64
|
-4.05% |
83,042
138.40%
|
60,000
|
Most Recent Note for MWIV - 5/4/2012 12:38:00 PM
Volume-driven gains this week helped it hit a new 52-week high. Reported earnings +25% on +38% sales revenues for the quarter ended March 31, 2012 versus the year ago period. While consolidating above support at its 50 DMA line the 4/20/12 mid-day report noted - "Earnings increases were below the +25% minimum guideline in the June, Sep, and Dec '11 quarterly comparisons versus the year-ago periods. It survived but failed to impress since noted fundamental and technical deterioration prompted it to be dropped from the Featured Stocks list on 8/05/11."
|
|
View all notes |
Alert me of new notes |
Company Profile |
SEC |
News |
Chart | C
A N
S L
I M
|
PCOM
- NASDAQ - Leisure-Services
Points International Ltd
|
$12.55 |
+0.12
0.97%
|
$13.01
|
$13.07
|
-3.98% |
52,351
87.54%
|
59,800
|
Most Recent Note for PCOM - 5/4/2012 12:42:31 PM
Hovering at its 52-week high this week, holding its ground stubbornly. Reported earnings of 4 cents per share versus a year ago loss of 1 cent per share while sales revenues were -2% for the quarter ended March 31, 2012. The 4/23/12 mid-day report noted - "Technically, this low-priced stock broke out with volume-driven gains on 4/12/12 and 4/13/12 clearing prior resistance in the $11 area, and no resistance remains due to overhead supply. Strong earnings increases in the Jun, Sep, and Dec '11 quarterly comparisons were above the +25% minimum guideline, satisfying the C criteria. Annual earnings (A criteria) history improved in recent years, but it has not been strong and steady."
|
|
View all notes |
Alert me of new notes |
Company Profile |
SEC |
News |
Chart | C
A N
S L
I M
|
PVH
- NYSE - CONSUMER NON-DURABLES - Textile - Apparel Clothing
P V H Corp
|
$86.99 |
-3.99
-4.39%
|
$89.76
|
$93.05
|
-6.51% |
1,011,955
118.39%
|
854,800
|
Most Recent Note for PVH - 5/4/2012 12:44:11 PM
Gapped down today and violated its 50 DMA line, encountering distributional pressure near its 52-week high. Reported earnings +27% on +10% sales revenues for the quarter ended January 31, 2012 versus the year ago period. Prior mid-day reports noted - "Its FY '09 and FY '10 earnings dipped after showing great annual earnings growth in prior years. Earnings rose +13% on +9% sales revenues for the quarter ended October 31, 2011 versus the year ago period, below the investment system's guidelines concerning the C criteria."
|
|
View all notes |
Alert me of new notes |
Company Profile |
SEC |
News |
Chart | C
A N
S L
I M
|
SNI
- NYSE - MEDIA - CATV Systems
Scripps Ntwrks Intr Cl A
|
$54.89 |
+0.36
0.66%
|
$55.24
|
$55.24
|
-0.63% |
1,390,932
141.47%
|
983,200
|
Most Recent Note for SNI - 5/4/2012 12:49:39 PM
Holding its ground today after a considerable volume-driven gain for a new all-time high on the prior session. The 5/03/12 mid-day report noted - "Fundamentals are below guidelines of the investment system. Reported earnings +18% on +11% sales revenues for the quarter ended March 31, 2012 versus the year ago period."
|
|
View all notes |
Alert me of new notes |
Company Profile |
SEC |
News |
Chart | C
A N
S L
I M
|
TGH
- NYSE - TRANSPORTATION - Logistics
Textainer Group Holdings
|
$35.03 |
-0.77
-2.14%
|
$35.80
|
$35.90
|
-2.41% |
123,030
79.22%
|
155,300
|
Most Recent Note for TGH - 5/4/2012 12:53:53 PM
Paused today after 6 consecutive gains. The 4/30/12 mid-day report noted - "It has rebounded near its 52-week high after a deep consolidation below its 200 DMA line since last noted in the 2/07/11 mid-day report with no resistance remaining due to overhead supply - 'Recent quarterly comparisons show sales and earnings improving after a streak of negative comparisons. Its annual earnings (A criteria) history has not been strong and steady.'"
|
|
View all notes |
Alert me of new notes |
Company Profile |
SEC |
News |
Chart | C
A N
S L
I M
|
TWTC
- NASDAQ - TELECOMMUNICATIONS - Telecom Services - Domestic
T W Telecom Inc
|
$23.04 |
-0.36
-1.54%
|
$23.39
|
$23.79
|
-3.15% |
632,173
75.64%
|
835,800
|
Most Recent Note for TWTC - 5/4/2012 12:54:45 PM
Pulling back today. The 5/03/12 mid-day report noted - "Hit a new 52-week high today with a 2nd consecutive volume-driven gain, rising from 12-month cup-with-handle base pattern. Reported earnings +63% on +8% sales revenues for the quarter ended March 31, 2012 versus the year ago period. Sales revenues growth has been slow and steady in the +8% range while its 4 prior quarterly comparisons showed no growth in earnings."
|
|
View all notes |
Alert me of new notes |
Company Profile |
SEC |
News |
Chart | C
A N
S L
I M
|
WWWW
- NASDAQ - INTERNET - Internet Information Providers
Web.com Group Inc
|
$15.77 |
-0.26
-1.62%
|
$16.00
|
$16.43
|
-4.02% |
245,545
77.31%
|
317,600
|
Most Recent Note for WWWW - 5/4/2012 1:10:45 PM
Holding its ground today following 2 considerable volume-driven gains for new 52-week highs, rallying from a deep one-year cup-with-handle base pattern. The 2 prior mid-day reports noted - "Reported earnings +67% on +132% sales revenues for the quarter ended March 31, 2012 versus the year ago period. Its Dec '11 comparison +17% was previously noted as its weakest earnings increase in more than 5 quarterly comparisons and below the +25% minimum guideline. Its annual earnings (A criteria) growth history included a downturn in FY '09 raising additional concerns with regard to the fundamental guidelines of the fact-based investment system."
|
|
View all notes |
Alert me of new notes |
Company Profile |
SEC |
News |
Chart | C
A N
S L
I M
|
|
|
|
THESE ARE NOT BUY RECOMMENDATIONS!
Comments contained in the body of this report are technical
opinions only. The material herein has been obtained
from sources believed to be reliable and accurate, however,
its accuracy and completeness cannot be guaranteed.
We are not an investment advisor, hence it does
not endorse or recommend any securities or other investments.
Any recommendation contained in this report may not
be suitable for all investors and it is not to be deemed
an offer or solicitation on our part with respect to
the purchase or sale of any securities. All trademarks,
service marks and trade names appearing in this report
are the property of their respective owners, and are
likewise used for identification purposes only.
This report is a service available
only to active Paid Premium Members.
You may opt-out of receiving report notifications
at any time. Questions or comments may be submitted
by writing to FactBasedInvesting.com c/o Premium
Member Services 665 S.E. 10 Street, Suite 201
Deerfield Beach, FL 33441-5634 or by calling 954-785-1121.
We appreciate any feedback
members may wish to send via the inquiry form
here.
|
|
|


