You are not logged in.
This means you
CAN ONLY VIEW reports that were published prior to Monday, April 14, 2025.
You
MUST UPGRADE YOUR MEMBERSHIP if you want to see any current reports.
AFTER MARKET UPDATE - TUESDAY, MAY 6TH, 2014
Previous After Market Report Next After Market Report >>>
|
|
|
|
DOW |
-129.53 |
16,401.02 |
-0.78% |
|
Volume |
685,272,720 |
+15% |
|
Volume |
1,699,902,480 |
+18% |
|
NASDAQ |
-57.30 |
4,080.76 |
-1.38% |
|
Advancers |
967 |
30% |
|
Advancers |
566 |
20% |
|
S&P 500 |
-16.94 |
1,867.72 |
-0.90% |
|
Decliners |
2,091 |
66% |
|
Decliners |
2,214 |
77% |
|
Russell 2000 |
-18.29 |
1,108.01 |
-1.62% |
|
52 Wk Highs |
90 |
|
|
52 Wk Highs |
38 |
|
|
S&P 600 |
-10.59 |
640.25 |
-1.63% |
|
52 Wk Lows |
37 |
|
|
52 Wk Lows |
86 |
|
|
 |
Breadth Negative as Indices Fall Under Distributional Pressure
Kenneth J. Gruneisen - Passed the CAN SLIM® Master's Exam
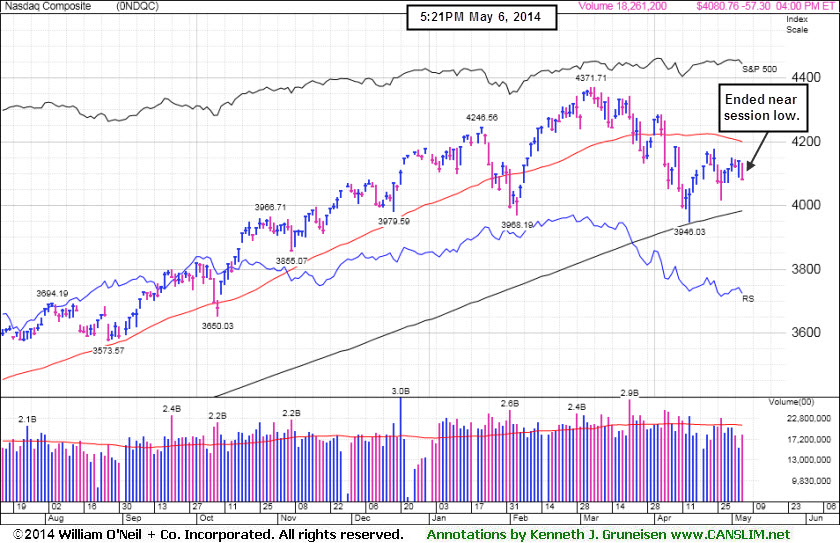
The major averages ended lower on Tuesday’s session. The volume was reported higher than the prior session totals on the NYSE and on the Nasdaq exchange, a sign of distributional selling pressure coming from institutional investors. Decliners led advancers by a 4-1 margin on the Nasdaq exchange and 2-1 on the NYSE. There were 32 high-ranked companies from the CANSLIM.net Leaders List that made new 52-week highs and appeared on the CANSLIM.net BreakOuts Page, up from the total of 28 stocks on the prior session. New 52-week highs outnumbered new 52-week lows on the NYSE while new lows outnumbered new highs on the Nasdaq exchange. There were gains for 3 of the 6 high-ranked companies currently included on the Featured Stocks Page. For the Market (M criteria) to earn the label of returning to a "confirmed uptrend" gains from at least one of the major averages into new high territory would be a welcome reassurance. Then, new buying efforts should be selective and only focused in stocks meeting all key criteria of the fact-based investment system. Keep in mind that any sustained and meaningful market advance requires leadership - a healthy crop of stocks hitting new 52-week highs.
The Dow fell 130 points to 16,401. The S&P 500 lost 17 points to 1,867. The NASDAQ dropped 57 points to 4,080. The major averages finished firmly in negative territory amid weakness in financials and technology. American International Group (AIG -4.14%) after posting a decline in quarterly profits. Shares of Twitter (TWTR -17.81%) dove as the lock-up period on restricted stock of insiders expired today. Energy was the lone sector up on the session. Shares of Anadarko Petroleum (APC+3.26%) and EOG Resources (EOG +4.41%) rose after both companies reported quarterly results above consensus estimates.
In M&A news, Merck (MRK -2.6%) fell following an announced sale of its U.S. consumer health business to Bayer (BAYRY -0.77%) for approximately $14.2 billion. General Electric (GE -1.47%) fell after France's President said the company's bid to acquire Alstom's (ALSMY -1.50%) energy unit was not sufficient.
On the economic front, a report before the open showed the U.S. trade deficit narrowed in March as exports increased by the most in nine months. Investor attention was also on Ukraine as tension continued to mount between the country’s military and pro-Russian separatists.
Treasuries gained on today’s session. Benchmark 10-year notes rose 4/32 to yield 2.59%. The CANSLIM.net Featured Stocks Page shows the most action-worthy candidates and their latest notes and a Headline Link directs members to the latest detailed analysis with data-packed graphs annotated by a Certified expert along with links to additional resources. The Premium Member Homepage includes "dynamic archives" to all prior pay reports published. Watch for an announcement via email concerning the next WEBCAST.
PICTURED: The Nasdaq Composite Index ended near its session low with a loss. For more than 4 weeks it has been slumping below its 50-day moving average (DMA) line which is now downward sloping.
|
 Kenneth J. Gruneisen started out as a licensed stockbroker in August 1987, a couple of months prior to the historic stock market crash that took the Dow Jones Industrial Average down -22.6% in a single day. He has published daily fact-based fundamental and technical analysis on high-ranked stocks online for two decades. Through FACTBASEDINVESTING.COM, Kenneth provides educational articles, news, market commentary, and other information regarding proven investment systems that work in good times and bad.
Comments contained in the body of this report are technical opinions only and are not necessarily those of Gruneisen Growth Corp. The material herein has been obtained from sources believed to be reliable and accurate, however, its accuracy and completeness cannot be guaranteed. Our firm, employees, and customers may effect transactions, including transactions contrary to any recommendation herein, or have positions in the securities mentioned herein or options with respect thereto. Any recommendation contained in this report may not be suitable for all investors and it is not to be deemed an offer or solicitation on our part with respect to the purchase or sale of any securities. |
|
 |
Financial, Retail, and Tech Groups Fell
Kenneth J. Gruneisen - Passed the CAN SLIM® Master's Exam
The Integrated Oil Index ($XOI +0.45%) posted a modest gain while the Oil Services Index ($OSX +0.08%) finished flat on Tuesday. Most other groups were lower as the Retail Index ($RLX -2.25%), Broker/Dealer Index ($XBD -2.08%), and the Bank Index ($BKX -1.48%) were negative influences on the major averages. The Biotechnology Index ($BTK -1.37%) led the tech sector's pullback while the Networking Index ($NWX -0.76%) and the Semiconductor Index ($SOX -0.43%) ended modestly lower. The Gold & Silver Index ($XAU -0.78%) also lost ground.
Charts courtesy www.stockcharts.com
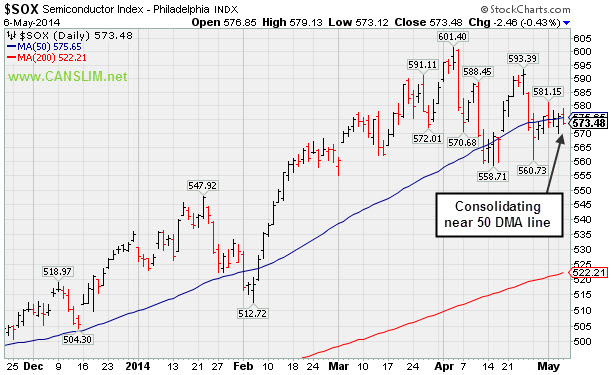
PICTURED: The Semiconductor Index ($SOX -0.43%) is consolidating near its 50-day moving average (DMA) line.
| Oil Services |
$OSX |
294.16 |
+0.24 |
+0.08% |
+4.67% |
| Integrated Oil |
$XOI |
1,626.60 |
+7.33 |
+0.45% |
+8.21% |
| Semiconductor |
$SOX |
573.48 |
-2.46 |
-0.43% |
+7.19% |
| Networking |
$NWX |
323.12 |
-2.48 |
-0.76% |
-0.25% |
| Broker/Dealer |
$XBD |
152.06 |
-3.23 |
-2.08% |
-5.30% |
| Retail |
$RLX |
843.10 |
-19.38 |
-2.25% |
-10.29% |
| Gold & Silver |
$XAU |
92.01 |
-0.72 |
-0.78% |
+9.34% |
| Bank |
$BKX |
67.13 |
-1.01 |
-1.48% |
-3.08% |
| Biotech |
$BTK |
2,523.41 |
-34.94 |
-1.37% |
+8.28% |
|
|
|
 |
Hitting New 52-Week High and New Pivot Point Cited
Kenneth J. Gruneisen - Passed the CAN SLIM® Master's Exam
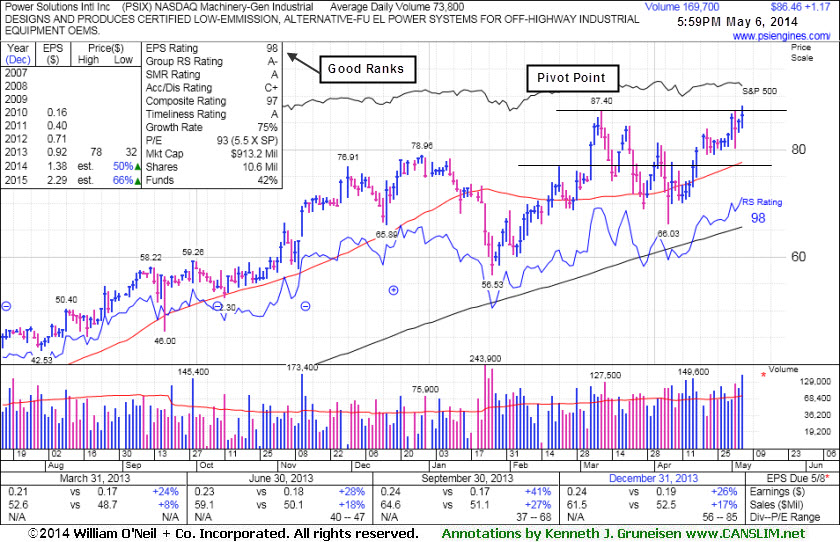
Power Solutions Int'l Inc (PSIX +$1.17 or +1.37% to $86.46) hit a new 52-week high today with a volume-driven gain. No resistance remains due to overhead supply. Its color code was changed to yellow with new pivot point cited based on its 3/11/14 high plus 10 cents. Subsequent volume-driven gains above the pivot point may trigger a proper technical buy signal. If bullish action triggers a technical buy signal members are still cautioned that 3 out of 4 stocks tend to move in the same direction of the major averages (M criteria). Confirming gains from the major averages are still needed as reassurance the broader market is strong.
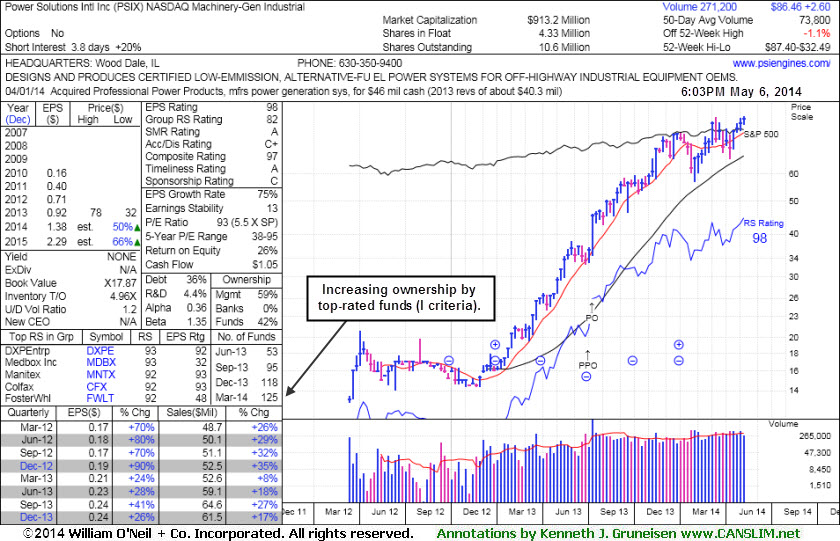
The high-ranked firm from the Machinery - General Industrial group has tallied multiple gains back by above average volume since last shown in this FSU section on 4/14/14 with annotated graphs under the headline, "Halted Slide After Slump Below 50-Day Moving Average". Disciplined investors avoid chasing stocks more than +5% above prior highs and always sell if any stock falls more than -7% from their purchase price. The 50-day moving average (DMA) line defines near-term support to watch.
PSIX was highlighted in yellow with a pivot point cited based on its 2/21/14 high in the 2/28/14 mid-day report (read here). It stalled shortly after its 3/06/14 technical breakout, having made only a little headway into new high territory. It reported earnings +26% on +17% sales revenues for the Dec '13 quarter, its 3rd consecutive quarter with earnings above the +25% minimum guideline (C criteria). The number of top-rated funds owning its shares rose from 6 in Mar '13 to 125 in Mar '14, a reassuring trend concerning the I criteria. The small supply of only 4.33 million shares (S criteria) can contribute to greater price volatility in the event of institutional buying or selling. Additional leadership in the Machinery - General Industrial group (L criteria) is reassuring.
|
|
|
Color Codes Explained :
Y - Better candidates highlighted by our
staff of experts.
G - Previously featured
in past reports as yellow but may no longer be buyable under the
guidelines.
***Last / Change / Volume data in this table is the closing quote data***
Symbol/Exchange
Company Name
Industry Group |
PRICE |
CHANGE
(%Change) |
Day High |
Volume
(% DAV)
(% 50 day avg vol) |
52 Wk Hi
% From Hi |
Featured
Date |
Price
Featured |
Pivot Featured |
|
Max Buy |
EQM
-
NYSE
E Q T Midstream Partners
ENERGY - Oil and Gas Pipelines
|
$75.25
|
-0.90
-1.18% |
$76.15
|
219,172
100.54% of 50 DAV
50 DAV is 218,000
|
$78.67
-4.35%
|
12/12/2013
|
$53.17
|
PP = $56.51
|
|
MB = $59.34
|
 Most Recent Note - 5/6/2014 6:21:27 PM
G - Still hovering near its all-time high. Completed a new Public Offering of 10.75 Million common units on 5/01/14. Fundamental concerns remain. Its 50 DMA line ($70.27) defines near-term support where a violation may trigger a technical sell signal.
>>> FEATURED STOCK ARTICLE : Stength Contiunues; Earnings Below +25% Minimum Guideline for a 2nd Quarter - 4/28/2014
View all notes |
Set NEW NOTE alert |
CANSLIM.net Company Profile |
SEC
News |
Chart |
Request a new note
C
A N
S L
I M


|
GNRC
-
NYSE
Generac Hldgs Inc
Electrical-Power/Equipmt
|
$52.70
|
-1.59
-2.93% |
$54.10
|
921,647
142.43% of 50 DAV
50 DAV is 647,100
|
$62.50
-15.68%
|
2/14/2014
|
$56.50
|
PP = $57.39
|
|
MB = $60.26
|
Most Recent Note - 5/5/2014 9:31:24 PM
G - Reported earnings -40% on -14% sales for the Mar '14 quarter raising fundamental concerns, and it violated support at its 50 DMA line on 5/01/14 with a volume-driven loss triggering technical sell signals. See the latest FSU analysis for more details and a new annotated daily graph.
>>> FEATURED STOCK ARTICLE : Fundamental and Technical Deterioration Raised Concerns - 5/5/2014
View all notes |
Set NEW NOTE alert |
CANSLIM.net Company Profile |
SEC
News |
Chart |
Request a new note
C
A N
S L
I M
|
ICON
-
NASDAQ
Iconix Brand Group Inc
CONSUMER NON-DURABLES - Textile - Apparel Footwear
|
$41.73
|
-0.27
-0.64% |
$42.12
|
636,062
111.59% of 50 DAV
50 DAV is 570,000
|
$43.34
-3.71%
|
4/30/2014
|
$42.50
|
PP = $42.57
|
|
MB = $44.70
|
Most Recent Note - 5/6/2014 5:51:38 PM
Y - Finished lower for a 4th consecutive session. Stalled near its 52-week high following a considerable 4/30/14 volume-driven gain. No resistance remains due to overhead supply and it remains perched near a new pivot point. Confirming gains with above average volume could trigger a new (or add-on) technical buy signal.
>>> FEATURED STOCK ARTICLE : Rebound Above 50-Day Average Needed to Improve Outlook - 4/24/2014
View all notes |
Set NEW NOTE alert |
CANSLIM.net Company Profile |
SEC
News |
Chart |
Request a new note
C
A N
S L
I M
|
PSIX
-
NASDAQ
Power Solutions Intl Inc
Machinery-Gen Industrial
|
$86.46
|
+1.17
1.37% |
$88.20
|
169,771
232.56% of 50 DAV
50 DAV is 73,000
|
$87.40
-1.07%
|
5/6/2014
|
$86.46
|
PP = $87.50
|
|
MB = $91.88
|
Most Recent Note - 5/6/2014 6:29:07 PM
Y- Hit a new 52-week high with today's volume-driven gain while approaching a new pivot point. Color code was changed to yellow with new pivot point cited based upon its 3/11/14 high plus 10 cents. Gains above the pivot point backed by at least +40% above average volume may trigger a new (or add-on) technical buy signal. No resistance remains due to overhead supply. The 50 DMA line defines near-term support to watch. See the latest FSU analysis for more details and new annotated graphs.
>>> FEATURED STOCK ARTICLE : Hitting New 52-Week High and New Pivot Point Cited - 5/6/2014
View all notes |
Set NEW NOTE alert |
CANSLIM.net Company Profile |
SEC
News |
Chart |
Request a new note
C
A N
S L
I M
|
TRN
-
NYSE
Trinity Industries Inc
TRANSPORTATION - Railroads
|
$77.67
|
+0.49
0.63% |
$78.91
|
2,331,634
186.08% of 50 DAV
50 DAV is 1,253,000
|
$77.99
-0.41%
|
4/30/2014
|
$75.57
|
PP = $76.05
|
|
MB = $79.85
|
Most Recent Note - 5/6/2014 6:25:19 PM
Y - Hit another new 52-week high with today's gain above its pivot point backed by +86% above average volume while approaching its "max buy" level. Prior highs in the $75-76 area define near-term support to watch on pullbacks.
>>> FEATURED STOCK ARTICLE : Finished Near Session Lows After Encountering Distributional Pressure - 4/30/2014
View all notes |
Set NEW NOTE alert |
CANSLIM.net Company Profile |
SEC
News |
Chart |
Request a new note
C
A N
S L
I M
|
Symbol/Exchange
Company Name
Industry Group |
PRICE |
CHANGE
(%Change) |
Day High |
Volume
(% DAV)
(% 50 day avg vol) |
52 Wk Hi
% From Hi |
Featured
Date |
Price
Featured |
Pivot Featured |
|
Max Buy |
WLK
-
NYSE
Westlake Chemical Corp
CHEMICALS - Specialty Chemicals
|
$76.73
|
+1.52
2.02% |
$77.51
|
1,239,322
182.25% of 50 DAV
50 DAV is 680,000
|
$76.58
0.20%
|
4/29/2014
|
$72.79
|
PP = $69.31
|
|
MB = $72.78
|
Most Recent Note - 5/6/2014 6:27:59 PM
G - Hit yet another new 52-week high while rallying further above its "max buy" level with today's considerable gain adding to its recent spurt of volume-driven gains. Prior highs in the $69 area define near-term support to watch. Reported +28% earnings on +19% sales for the Mar '14 quarter.
>>> FEATURED STOCK ARTICLE : Technical Breakout From Double Bottom Base Pattern - 4/29/2014
View all notes |
Set NEW NOTE alert |
CANSLIM.net Company Profile |
SEC
News |
Chart |
Request a new note
C
A N
S L
I M
|
|
|
|
THESE ARE NOT BUY RECOMMENDATIONS!
Comments contained in the body of this report are technical
opinions only. The material herein has been obtained
from sources believed to be reliable and accurate, however,
its accuracy and completeness cannot be guaranteed.
This site is not an investment advisor, hence it does
not endorse or recommend any securities or other investments.
Any recommendation contained in this report may not
be suitable for all investors and it is not to be deemed
an offer or solicitation on our part with respect to
the purchase or sale of any securities. All trademarks,
service marks and trade names appearing in this report
are the property of their respective owners, and are
likewise used for identification purposes only.
This report is a service available
only to active Paid Premium Members.
You may opt-out of receiving report notifications
at any time. Questions or comments may be submitted
by writing to Premium Membership Services 665 S.E. 10 Street, Suite 201 Deerfield Beach, FL 33441-5634 or by calling 1-800-965-8307
or 954-785-1121.
|
|
|

