You are not logged in.
This means you
CAN ONLY VIEW reports that were published prior to Tuesday, April 15, 2025.
You
MUST UPGRADE YOUR MEMBERSHIP if you want to see any current reports.
AFTER MARKET UPDATE - MONDAY, MAY 5TH, 2014
Previous After Market Report Next After Market Report >>>
|
|
|
|
DOW |
+17.66 |
16,530.55 |
+0.11% |
|
Volume |
595,758,700 |
-13% |
|
Volume |
1,444,752,080 |
-16% |
|
NASDAQ |
+14.16 |
4,138.06 |
+0.34% |
|
Advancers |
1,492 |
47% |
|
Advancers |
1,176 |
42% |
|
S&P 500 |
+3.52 |
1,884.66 |
+0.19% |
|
Decliners |
1,534 |
48% |
|
Decliners |
1,517 |
54% |
|
Russell 2000 |
-2.50 |
1,126.30 |
-0.22% |
|
52 Wk Highs |
88 |
|
|
52 Wk Highs |
32 |
|
|
S&P 600 |
-1.72 |
650.84 |
-0.26% |
|
52 Wk Lows |
29 |
|
|
52 Wk Lows |
72 |
|
|
 |
Major Averages Erased Early Losses to Post Gains
Kenneth J. Gruneisen - Passed the CAN SLIM® Master's Exam
Stocks recovered from an early sell-off to post modest gains on Monday's session. The volume was reported lighter than the prior session totals on the NYSE and on the Nasdaq exchange. Decliners led advancers by a 5-4 margin on the Nasdaq exchange while on the NYSE the mix was near even. There were 28 high-ranked companies from the CANSLIM.net Leaders List that made new 52-week highs and appeared on the CANSLIM.net BreakOuts Page, down from the total of 32 stocks on the prior session. New 52-week highs outnumbered new 52-week lows on the NYSE while new lows outnumbered new highs on the Nasdaq exchange. There were 4 of the 6 high-ranked companies currently included on the Featured Stocks Page which ended the session with a gain. For the Market (M criteria) to earn the label of returning to a "confirmed uptrend" gains from at least one of the major averages into new high territory would be a welcome reassurance. Then, new buying efforts should be selective and only focused in stocks meeting all key criteria of the fact-based investment system. Keep in mind that any sustained and meaningful market advance requires leadership - a healthy crop of stocks hitting new 52-week highs.
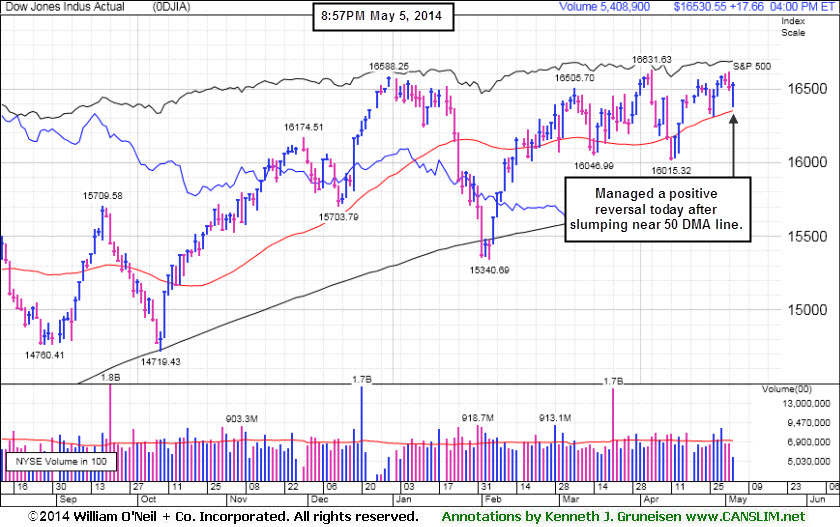
The Dow rebounded from a 136 point decline to close up 18 at 16.530. The S&P 500 added 4 points to 1884. The NASDAQ rose 14 points to 4138. An encouraging reading on the U.S. economy helped sentiment. Stocks rose after a report showed service sector activity expanded at a faster pace in April. The better-than-expected data helped offset news Chinese manufacturing contracted for a fourth consecutive month and concerns about the situation in Ukraine.
Eight of 10 sectors were higher in the S&P 500. Utilities and energy were the best performing groups. Public Service Enterprise (PSE ) and Exxon (XOM +0.9%). Financials were down the most on the session. JP Morgan Chase & Co (JPM -2.5%) following a reduced forecast for second-quarter trading revenues. In the retail space, Target (TGT -3.5%) fell after announcing the resignation of its CEO.
On the earnings front, Pfizer (PFE -2.6%) as first-quarter profit declined due to increased competition from generic drugs. Tyson Foods (TSN -9.9%) fell as it offered a full-year outlook below analyst projections.
Treasuries snapped a four day winning streak with the benchmark 10-year note down 6/32 to yield 2.61%.
The CANSLIM.net Featured Stocks Page shows the most action-worthy candidates and their latest notes and a Headline Link directs members to the latest detailed analysis with data-packed graphs annotated by a Certified expert along with links to additional resources. The Premium Member Homepage includes "dynamic archives" to all prior pay reports published. Watch for an announcement via email concerning the next WEBCAST.
PICTURED: The Dow Jones Industrial Average managed a positive reversal after slumping near its 50-day moving average (DMA) line. It is consolidating -0.6% off its all-time high.
|
 Kenneth J. Gruneisen started out as a licensed stockbroker in August 1987, a couple of months prior to the historic stock market crash that took the Dow Jones Industrial Average down -22.6% in a single day. He has published daily fact-based fundamental and technical analysis on high-ranked stocks online for two decades. Through FACTBASEDINVESTING.COM, Kenneth provides educational articles, news, market commentary, and other information regarding proven investment systems that work in good times and bad.
Comments contained in the body of this report are technical opinions only and are not necessarily those of Gruneisen Growth Corp. The material herein has been obtained from sources believed to be reliable and accurate, however, its accuracy and completeness cannot be guaranteed. Our firm, employees, and customers may effect transactions, including transactions contrary to any recommendation herein, or have positions in the securities mentioned herein or options with respect thereto. Any recommendation contained in this report may not be suitable for all investors and it is not to be deemed an offer or solicitation on our part with respect to the purchase or sale of any securities. |
|
 |
Biotech Index Led Gainers; Financials Ended Lower
Kenneth J. Gruneisen - Passed the CAN SLIM® Master's Exam
Financial shares weighed on the major averages as the Bank Index ($BKX -0.60%) and the Broker/Dealer Index ($XBD -0.52%) edged lower and the Retail Index ($RLX -0.42%) was also a negative influence. The Biotechnology Index ($BTK +2.51%) led the tech sector higher, meanwhile the Semiconductor Index ($SOX +0.08%) finished flat and the Networking Index ($NWX -0.43%) suffered a small loss. Commodity-linked groups were mixed and little changed as the Integrated Oil Index ($XOI +0.32%) posted a small gain and the Oil Services Index ($OSX -0.01%) finished flat while the Gold & Silver Index ($XAU -0.29%) edged lower.
Charts courtesy www.stockcharts.com
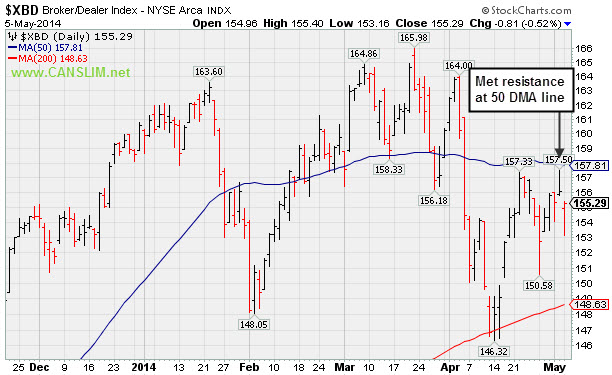
PICTURED: The Broker/Dealer Index ($XBD -0.52%) recently met resistance at its 50-day moving average (DMA) line when trying to rebound and rally from its longer term 200 DMA line.
| Oil Services |
$OSX |
293.92 |
-0.04 |
-0.01% |
+4.59% |
| Integrated Oil |
$XOI |
1,619.26 |
+5.11 |
+0.32% |
+7.73% |
| Semiconductor |
$SOX |
575.94 |
+0.45 |
+0.08% |
+7.65% |
| Networking |
$NWX |
325.60 |
-1.42 |
-0.43% |
+0.51% |
| Broker/Dealer |
$XBD |
155.29 |
-0.81 |
-0.52% |
-3.28% |
| Retail |
$RLX |
862.48 |
-3.41 |
-0.42% |
-8.23% |
| Gold & Silver |
$XAU |
92.73 |
-0.27 |
-0.29% |
+10.20% |
| Bank |
$BKX |
68.14 |
-0.41 |
-0.60% |
-1.62% |
| Biotech |
$BTK |
2,558.35 |
+62.70 |
+2.51% |
+9.78% |
|
|
|
 |
Fundamental and Technical Deterioration Raised Concerns
Kenneth J. Gruneisen - Passed the CAN SLIM® Master's Exam
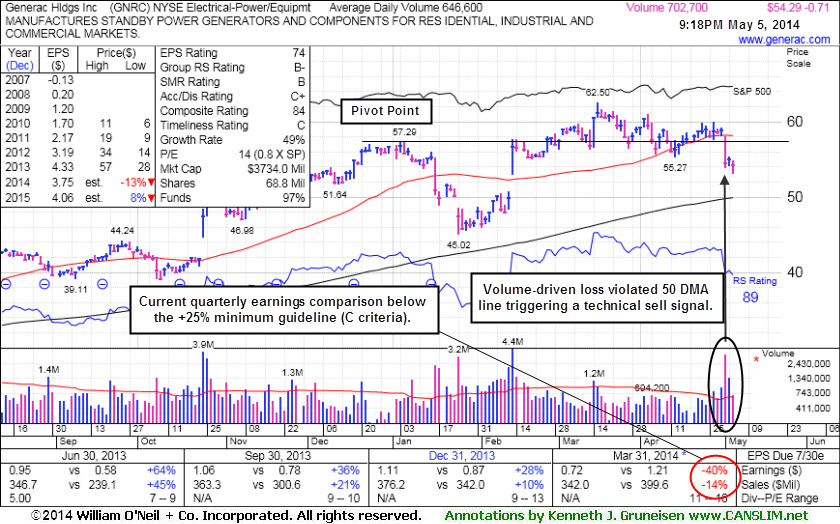
Generac Hldgs Inc (GNRC -$1.49 or -2.59% to $56.00) recently reported -40% earnings on -14% sales revenues for the Mar '14 quarter and violated support at its 50-day moving average (DMA) line with a volume-driven loss. The Electrical - Power/Equipment firm has subsequently seen its EPS rank slump to 74, below the 80+ minimum guideline for buy candidates. Prior sequential deceleration in the sales revenues growth rate was noted as a cause for concern while it was also noted that consensus estimates are calling for FY '14 earnings down -13%, and its currently low P/E valuation (0.8 X SP) suggests that the market has a timid outlook for future growth.
Technically, it also undercut its recent low ($55.27 on 4/14/14) raising greater concerns. Its color code was changed to green due to fundamental and technical deterioration. Since last shown in this FSU section on 4/11/14 with annotated graphs under the headline, "Finished Just Below its 50-Day Average Line", it did not showing compelling evidence of recent institutional accumulation and made limited headway above prior resistance in the $57 area. Members were previously cautioned - "Volume should be at least +40% above average as a stock rallies above its pivot point to trigger a proper technical buy signal."
It made limited progress since 2/14/14 mid-day report (read here) when highlighted in yellow as it returned to the Featured Stocks list with a new pivot point based on its 1/06/14 high plus 10 cents. Disciplined investors always limit losses by selling if any stock falls more than -7% from their purchase price. GNRC has seen little change lately in the number of top-rated funds owning its shares, actually reported at 438 in Sep '13 and 438 in Mar '14. However, its current Up/Down Volume Ratio of 1.3 is an unbiased indication its shares have been under accumulation over the past 50 days. Its small float of only 42.6 million shares (S criteria) can contribute to greater price volatility in the event of institutional buying or selling.
|
|
|
Color Codes Explained :
Y - Better candidates highlighted by our
staff of experts.
G - Previously featured
in past reports as yellow but may no longer be buyable under the
guidelines.
***Last / Change / Volume data in this table is the closing quote data***
Symbol/Exchange
Company Name
Industry Group |
PRICE |
CHANGE
(%Change) |
Day High |
Volume
(% DAV)
(% 50 day avg vol) |
52 Wk Hi
% From Hi |
Featured
Date |
Price
Featured |
Pivot Featured |
|
Max Buy |
EQM
-
NYSE
E Q T Midstream Partners
ENERGY - Oil and Gas Pipelines
|
$76.15
|
+0.65
0.86% |
$76.35
|
279,079
129.80% of 50 DAV
50 DAV is 215,000
|
$78.67
-3.20%
|
12/12/2013
|
$53.17
|
PP = $56.51
|
|
MB = $59.34
|
Most Recent Note - 5/2/2014 12:11:59 PM
G - Perched at an all-time high, it priced a new Public Offering of 10.75 Million common units. Fundamental concerns remain. Its 50 DMA line ($69.43) defines near-term support where a violation may trigger a technical sell signal.
>>> FEATURED STOCK ARTICLE : Stength Contiunues; Earnings Below +25% Minimum Guideline for a 2nd Quarter - 4/28/2014
View all notes |
Set NEW NOTE alert |
CANSLIM.net Company Profile |
SEC
News |
Chart |
Request a new note
C
A N
S L
I M


|
GNRC
-
NYSE
Generac Hldgs Inc
Electrical-Power/Equipmt
|
$54.29
|
-0.71
-1.29% |
$54.87
|
702,733
108.78% of 50 DAV
50 DAV is 646,000
|
$62.50
-13.14%
|
2/14/2014
|
$56.50
|
PP = $57.39
|
|
MB = $60.26
|
 Most Recent Note - 5/5/2014 9:31:24 PM
G - Reported earnings -40% on -14% sales for the Mar '14 quarter raising fundamental concerns, and it violated support at its 50 DMA line on 5/01/14 with a volume-driven loss triggering technical sell signals. See the latest FSU analysis for more details and a new annotated daily graph.
>>> FEATURED STOCK ARTICLE : Fundamental and Technical Deterioration Raised Concerns - 5/5/2014
View all notes |
Set NEW NOTE alert |
CANSLIM.net Company Profile |
SEC
News |
Chart |
Request a new note
C
A N
S L
I M
|
ICON
-
NASDAQ
Iconix Brand Group Inc
CONSUMER NON-DURABLES - Textile - Apparel Footwear
|
$42.00
|
-0.09
-0.21% |
$42.68
|
717,330
120.36% of 50 DAV
50 DAV is 596,000
|
$43.34
-3.09%
|
4/30/2014
|
$42.50
|
PP = $42.57
|
|
MB = $44.70
|
Most Recent Note - 5/5/2014 9:13:36 PM
Y - Stalled near its 52-week high following a considerable 4/30/14 volume-driven gain. No resistance remains due to overhead supply. Perched near the new pivot point, and confirming gains with above average volume could trigger a new (or add-on) technical buy signal.
>>> FEATURED STOCK ARTICLE : Rebound Above 50-Day Average Needed to Improve Outlook - 4/24/2014
View all notes |
Set NEW NOTE alert |
CANSLIM.net Company Profile |
SEC
News |
Chart |
Request a new note
C
A N
S L
I M
|
PSIX
-
NASDAQ
Power Solutions Intl Inc
Machinery-Gen Industrial
|
$85.29
|
+1.43
1.71% |
$85.71
|
101,523
141.00% of 50 DAV
50 DAV is 72,000
|
$87.40
-2.41%
|
2/28/2014
|
$74.65
|
PP = $76.93
|
|
MB = $80.78
|
Most Recent Note - 5/2/2014 5:14:38 PM
G- Challenged its 52-week high but reversed early gains to close with a loss on above average volume. No resistance remains due to overhead supply. The 50 DMA line defines near-term support to watch.
>>> FEATURED STOCK ARTICLE : Halted Slide After Slump Below 50-Day Moving Average - 4/14/2014
View all notes |
Set NEW NOTE alert |
CANSLIM.net Company Profile |
SEC
News |
Chart |
Request a new note
C
A N
S L
I M
|
TRN
-
NYSE
Trinity Industries Inc
TRANSPORTATION - Railroads
|
$77.18
|
+0.90
1.18% |
$77.99
|
1,221,887
95.46% of 50 DAV
50 DAV is 1,280,000
|
$77.45
-0.35%
|
4/30/2014
|
$75.57
|
PP = $76.05
|
|
MB = $79.85
|
Most Recent Note - 5/2/2014 5:17:18 PM
Y - Hit a new 52-week high today and closed above its pivot point with a gain backed by +82% above average volume clinching a technical buy signal. Highlighted in yellow with pivot point cited based on its 3/21/14 high plus 10 cents in the 4/30/14 mid-day report (read here). See the latest FSU analysis for more details and annotated graphs.
>>> FEATURED STOCK ARTICLE : Finished Near Session Lows After Encountering Distributional Pressure - 4/30/2014
View all notes |
Set NEW NOTE alert |
CANSLIM.net Company Profile |
SEC
News |
Chart |
Request a new note
C
A N
S L
I M
|
Symbol/Exchange
Company Name
Industry Group |
PRICE |
CHANGE
(%Change) |
Day High |
Volume
(% DAV)
(% 50 day avg vol) |
52 Wk Hi
% From Hi |
Featured
Date |
Price
Featured |
Pivot Featured |
|
Max Buy |
WLK
-
NYSE
Westlake Chemical Corp
CHEMICALS - Specialty Chemicals
|
$75.21
|
+4.35
6.14% |
$76.58
|
2,115,995
324.04% of 50 DAV
50 DAV is 653,000
|
$73.38
2.49%
|
4/29/2014
|
$72.79
|
PP = $69.31
|
|
MB = $72.78
|
Most Recent Note - 5/5/2014 2:43:19 PM
G - Color code is changed to green while hitting a new 52-week high and rallying beyond its "max buy" level with today's considerable volume-driven gain. Reported strong earnings for the Mar '14 quarter.
>>> FEATURED STOCK ARTICLE : Technical Breakout From Double Bottom Base Pattern - 4/29/2014
View all notes |
Set NEW NOTE alert |
CANSLIM.net Company Profile |
SEC
News |
Chart |
Request a new note
C
A N
S L
I M
|
|
|
|
THESE ARE NOT BUY RECOMMENDATIONS!
Comments contained in the body of this report are technical
opinions only. The material herein has been obtained
from sources believed to be reliable and accurate, however,
its accuracy and completeness cannot be guaranteed.
This site is not an investment advisor, hence it does
not endorse or recommend any securities or other investments.
Any recommendation contained in this report may not
be suitable for all investors and it is not to be deemed
an offer or solicitation on our part with respect to
the purchase or sale of any securities. All trademarks,
service marks and trade names appearing in this report
are the property of their respective owners, and are
likewise used for identification purposes only.
This report is a service available
only to active Paid Premium Members.
You may opt-out of receiving report notifications
at any time. Questions or comments may be submitted
by writing to Premium Membership Services 665 S.E. 10 Street, Suite 201 Deerfield Beach, FL 33441-5634 or by calling 1-800-965-8307
or 954-785-1121.
|
|
|

