You are not logged in.
This means you
CAN ONLY VIEW reports that were published prior to Monday, April 14, 2025.
You
MUST UPGRADE YOUR MEMBERSHIP if you want to see any current reports.
AFTER MARKET UPDATE - MONDAY, MAY 6TH, 2013
Previous After Market Report Next After Market Report >>>
|
|
|
|
DOW |
-5.07 |
14,968.89 |
-0.03% |
|
Volume |
619,526,120 |
-14% |
|
Volume |
1,467,365,300 |
-13% |
|
NASDAQ |
+14.34 |
3,392.97 |
+0.42% |
|
Advancers |
1,812 |
58% |
|
Advancers |
1,471 |
57% |
|
S&P 500 |
+3.08 |
1,617.50 |
+0.19% |
|
Decliners |
1,176 |
38% |
|
Decliners |
988 |
39% |
|
Russell 2000 |
+5.38 |
959.80 |
+0.56% |
|
52 Wk Highs |
296 |
|
|
52 Wk Highs |
180 |
|
|
S&P 600 |
+2.42 |
537.66 |
+0.45% |
|
52 Wk Lows |
11 |
|
|
52 Wk Lows |
14 |
|
|
 |
Stocks Ended Mostly Higher With Lighter Volume Totals on the Exchanges
Kenneth J. Gruneisen - Passed the CAN SLIM® Master's Exam
The major averages finished mixed on Monday. The volume totals were reported lighter than the prior session totals on the NYSE and on the Nasdaq exchange. Breadth was positive as advancers led decliners by 3-2 on the NYSE and on the Nasdaq exchange. There were 73 high-ranked companies from the CANSLIM.net Leaders List making new 52-week highs and appearing on the CANSLIM.net BreakOuts Page, down from the prior session total of 117 stocks. New 52-week highs totals contracted yet solidly outnumbered new 52-week lows on both the NYSE and the Nasdaq exchange. There were gains for 8 of the 12 high-ranked companies currently included on the Featured Stocks Page.
The major averages were little changed in a generally quiet session. The market took a breather today after Friday's advance on a report that showed nonfarm payrolls unexpectedly rose 165,000 in April. With no major economic data released, corporate earnings garnered some attention. Tyson Foods (TSN -3.33%) to pace the consumer staples sector lower after the meat processor reported disappointing quarterly results. Financials were the best performing group in the S&P 500. Bank of America Corp (BAC +5.23%) on reports it reached a settlement with bond insurer MBIA related to a dispute over bad mortgage loans. Tech also outperformed on the session as shares of Apple Inc (AAPL +2.38%) and Google Inc (GOOG +1.9%) both traded higher. BMC Software Inc (BMC unchanged at $45.42) agreed to be acquired by two private equity firms for $6.9 billion. Utilities were the worst performing sector with Entergy Corp (ETR -2.77%).
Treasuries were lower with the 10-year note down 7/32 to yield 1.76%.
The market (M criteria) saw an expansion in leadership (stocks hitting new 52-week highs) that reassured investors a confirmed uptrend is at hand. Watch for new stocks featured in the CANSLIM.net Mid-Day BreakOuts Report. Action-worthy leaders are covered on an ongoing basis with the latest notes and additional resource links included on the Featured Stocks Page. Watch for an announcement via email concerning the next WEBCAST. The webcast will also be available via an updated link highlighted at the top of the Premium Member Homepage.
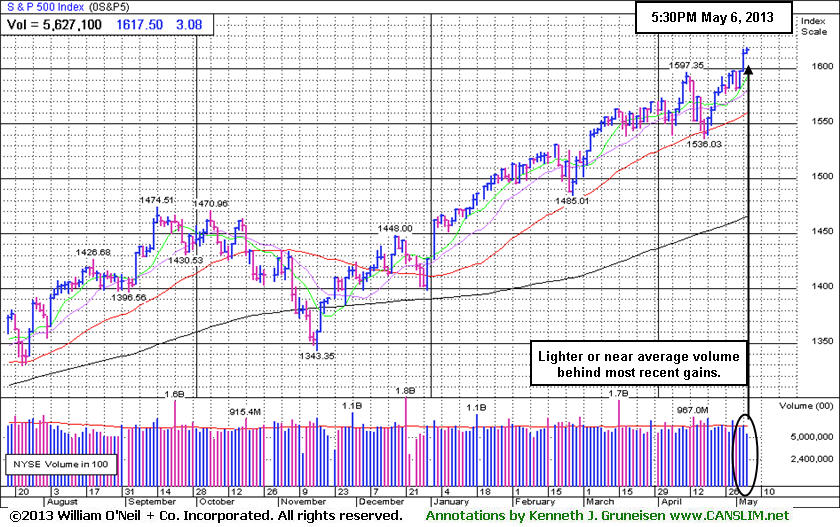
PICTURED: The S&P 500 Index has a +13.4% gain year-to-date. Its recent gains into new high territory have come on light or near average volume. Found prompt support near its 50-day moving average (DMA) line violation. The indices' rally to new highs confirmed the market's uptrend which means odds are favorable for new buying efforts in stocks meeting all of the fact-based investment system's key criteria.
|
 Kenneth J. Gruneisen started out as a licensed stockbroker in August 1987, a couple of months prior to the historic stock market crash that took the Dow Jones Industrial Average down -22.6% in a single day. He has published daily fact-based fundamental and technical analysis on high-ranked stocks online for two decades. Through FACTBASEDINVESTING.COM, Kenneth provides educational articles, news, market commentary, and other information regarding proven investment systems that work in good times and bad.
Comments contained in the body of this report are technical opinions only and are not necessarily those of Gruneisen Growth Corp. The material herein has been obtained from sources believed to be reliable and accurate, however, its accuracy and completeness cannot be guaranteed. Our firm, employees, and customers may effect transactions, including transactions contrary to any recommendation herein, or have positions in the securities mentioned herein or options with respect thereto. Any recommendation contained in this report may not be suitable for all investors and it is not to be deemed an offer or solicitation on our part with respect to the purchase or sale of any securities. |
|
 |
Financial, Retail, Tech Groups Led Gainers
Kenneth J. Gruneisen - Passed the CAN SLIM® Master's Exam
Strength in financial shares underpinned the major averages as the Bank Index ($BKX +1.30%) and the Broker/Dealer Index ($XBD +0.76%) each posted a solid gain. The Retail Index ($RLX +0.38%) edged higher and the tech sector saw gains from the Networking Index ($NWX +0.94%), Semiconductor Index ($SOX +0.57%), and the Internet Index ($IIX +0.60%). The Healthcare Index ($HMO +0.38%) posted a small gain while the Biotechnology Index ($BTK -0.11%) edged lower. The Gold & Silver Index ($XAU +0.05%) finished flat, meanwhile modest gains in energy-related shares gave the Integrated Oil Index ($XOI +0.25%) and the Oil Services Index ($OSX +0.68%) both a boost.
Charts courtesy www.stockcharts.com
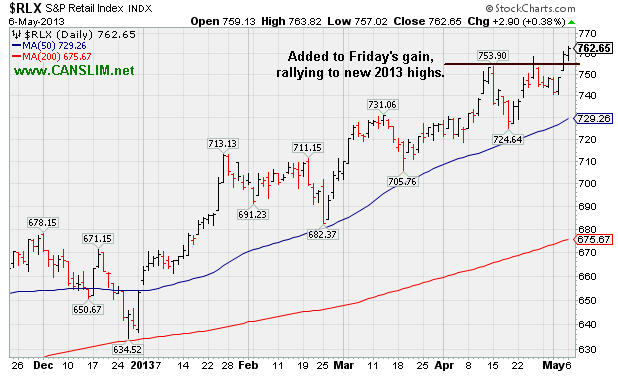
PICTURED: The Retail Index ($RLX +0.38%) added to Friday's gain, rallying to new 2013 highs. The strength in this influential index is a reassuring indicator hinting that the American consumer is not living in fear, but still out shopping and spending.
| Oil Services |
$OSX |
257.62 |
+1.75 |
+0.68% |
+17.01% |
| Healthcare |
$HMO |
2,988.80 |
+11.18 |
+0.38% |
+18.88% |
| Integrated Oil |
$XOI |
1,390.33 |
+3.49 |
+0.25% |
+11.96% |
| Semiconductor |
$SOX |
453.47 |
+2.55 |
+0.57% |
+18.07% |
| Networking |
$NWX |
227.47 |
+2.12 |
+0.94% |
+0.41% |
| Internet |
$IIX |
371.48 |
+2.22 |
+0.60% |
+13.60% |
| Broker/Dealer |
$XBD |
117.08 |
+0.88 |
+0.76% |
+24.12% |
| Retail |
$RLX |
762.65 |
+2.90 |
+0.38% |
+16.78% |
| Gold & Silver |
$XAU |
107.72 |
+0.05 |
+0.05% |
-34.95% |
| Bank |
$BKX |
57.68 |
+0.74 |
+1.30% |
+12.48% |
| Biotech |
$BTK |
1,947.15 |
-2.24 |
-0.11% |
+25.86% |
|
|
|
 |
Found Support at 50-Day Average While Forming New Base
Kenneth J. Gruneisen - Passed the CAN SLIM® Master's Exam
Often, when a leading stock is setting up to breakout of a solid base it is highlighted in CANSLIM.net's Mid-Day Breakouts Report. The most relevant factors are noted in the report which alerts prudent CANSLIM oriented investors to place the issue in their watch list. After doing any necessary backup research, the investor is prepared to act after the stock triggers a technical buy signal (breaks above its pivot point on more than +50% average turnover) but before it gets too extended from a sound base. In the event the stock fails to trigger a technical buy signal and its price declines then it will simply be removed from the watch list. Disciplined investors know to buy as near as possible to the pivot point and avoid chasing stocks after they have rallied more than +5% above their pivot point. It is crucial to always limit losses whenever any stock heads the wrong direction, and disciplined investors sell if a struggling stock ever falls more than -7% from their purchase price.
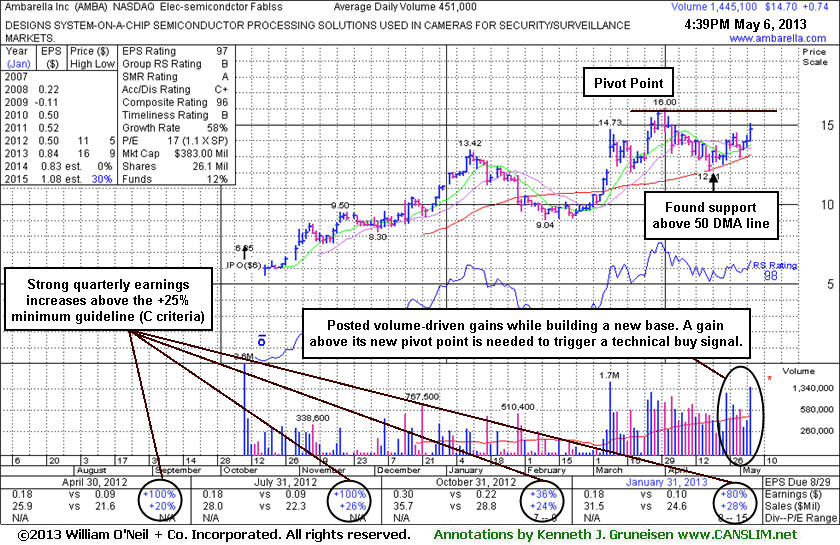
Ambarella Corporation (AMBA +$0.74 or +5.30% to $14.70) was highlighted in yellow in the earlier mid-day report (read here) and it has returned to the Featured Stocks list. The new pivot point cited is based on its 4/01/13 high plus 10 cents. Subsequent volume-driven gains above the new pivot point may trigger a new technical buy signal. Patience may be required, as it may spend more time basing, meanwhile it faces some resistance due to overhead supply up through the $16 level. It found encouraging support at its 50-day moving average (DMA) line and flashed above average volume behind recent gains while building on a new base since dropped from the Featured Stocks list on 4/18/13. Its last appearance in this FSU section with an annotated graph was on 4/17/13 under the headline, "Encountering Distributional Pressure in Recent Weeks".
The high-ranked Electronics - Semiconductor firm reported earnings +80% on +28% sales revenues for the Jan '13 quarter. Its strong quarterly earnings comparisons versus the year ago periods satisfy the C criteria with increases above the +25% minimum guideline. It also has a good annual earnings (A criteria), however it has a limited history since its IPO at $6 on 10/10/12. The number of top-rated funds owning its shares rose from 51 in Dec '12 to 68 in Mar '13, a reassuring indication concerning the I criteria. Its current Up/Down Volume Ratio of 1.4 is also an unbiased indication that its shares have been under accumulation over the past 50 days. Its small supply (S criteria) of only 13.3 million shares in the public float can contribute to great price volatility in the event of institutional buying or selling.
|
|
|
Color Codes Explained :
Y - Better candidates highlighted by our
staff of experts.
G - Previously featured
in past reports as yellow but may no longer be buyable under the
guidelines.
***Last / Change / Volume data in this table is the closing quote data***
Symbol/Exchange
Company Name
Industry Group |
PRICE |
CHANGE
(%Change) |
Day High |
Volume
(% DAV)
(% 50 day avg vol) |
52 Wk Hi
% From Hi |
Featured
Date |
Price
Featured |
Pivot Featured |
|
Max Buy |
AMBA
-
NASDAQ
Ambarella Inc
ELECTRONICS - Semiconductor - Specialized
|
$14.70
|
+0.74
5.30% |
$15.09
|
1,445,197
320.44% of 50 DAV
50 DAV is 451,000
|
$16.00
-8.13%
|
5/6/2013
|
$15.31
|
PP = $16.10
|
|
MB = $16.91
|
 Most Recent Note - 5/6/2013 6:22:44 PM
Y - Fundamentals remain strong concerning the C and A criteria. Highlighted in yellow with new pivot point cited based on its 4/01/13 high plus 10 cents in the earlier mid-day report (read here). Subsequent volume-driven gains above the new pivot point may trigger a new technical buy signal. It may spend more time basing while it faces resistance due to overhead supply up through the $16 level. Found encouraging support at its 50 DMA line and flashed above average volume behind recent gains while building on a new base. See the latest FSU analysis for more details and a new annotated graph.
>>> The latest Featured Stock Update with an annotated graph appeared on 5/6/2013. Click here.
View all notes |
Alert me of new notes |
CANSLIM.net Company Profile |
SEC |
Zacks Reports |
StockTalk |
News |
Chart |
Request a new note
C
A N
S L
I M


|
CELG
-
NASDAQ
Celgene Corp
DRUGS - Drug Manufacturers - Major
|
$121.22
|
-0.42
-0.35% |
$123.11
|
2,636,638
81.71% of 50 DAV
50 DAV is 3,226,800
|
$128.52
-5.68%
|
3/27/2013
|
$113.24
|
PP = $115.54
|
|
MB = $121.32
|
Most Recent Note - 5/6/2013 6:33:38 PM
G - Found support at its 50 DMA line as it managed a positive reversal on 5/02/13. That session's low ($114.05) defines important near-term support below its short-term average. It is extended from any sound base pattern.
>>> The latest Featured Stock Update with an annotated graph appeared on 4/19/2013. Click here.
View all notes |
Alert me of new notes |
CANSLIM.net Company Profile |
SEC |
Zacks Reports |
StockTalk |
News |
Chart |
Request a new note
C
A N
S L
I M
|
CMCSA
-
NASDAQ
Comcast Corp Cl A
MEDIA - CATV Systems
|
$42.78
|
+0.24
0.56% |
$42.84
|
7,240,790
57.91% of 50 DAV
50 DAV is 12,504,300
|
$42.75
0.07%
|
12/3/2012
|
$37.08
|
PP = $38.06
|
|
MB = $39.96
|
Most Recent Note - 5/6/2013 11:41:09 AM
G - Reported earnings +13% on +3% sales revenues for the Mar '13 quarter, the 2nd consecutive quarterly comparison with earnings well below the +25% minimum guideline (C criteria). Despite fundamental concerns repeatedly noted it has found recent support near its 50 DMA line and is perched at its 52-week high.
>>> The latest Featured Stock Update with an annotated graph appeared on 4/16/2013. Click here.
View all notes |
Alert me of new notes |
CANSLIM.net Company Profile |
SEC |
Zacks Reports |
StockTalk |
News |
Chart |
Request a new note
C
A N
S L
I M
|
EQM
-
NYSE
E Q T Midstream Partners
ENERGY - Oil and Gas Pipelines
|
$47.62
|
+1.24
2.67% |
$48.40
|
60,547
75.97% of 50 DAV
50 DAV is 79,700
|
$47.22
0.85%
|
4/25/2013
|
$40.16
|
PP = $40.84
|
|
MB = $42.88
|
Most Recent Note - 5/6/2013 6:25:39 PM
G - Hit another new 52-week high with lighter than average volume behind today's 2nd consecutive gain. Prior highs in the $40 area define initial support to watch above its 50 DMA line on pullbacks.
>>> The latest Featured Stock Update with an annotated graph appeared on 4/25/2013. Click here.
View all notes |
Alert me of new notes |
CANSLIM.net Company Profile |
SEC |
Zacks Reports |
StockTalk |
News |
Chart |
Request a new note
C
A N
S L
I M
|
FLT
-
NYSE
Fleetcor Technologies
DIVERSIFIED SERVICES - Business/Management Services
|
$81.97
|
+1.63
2.03% |
$82.00
|
1,050,320
122.90% of 50 DAV
50 DAV is 854,600
|
$85.56
-4.20%
|
3/21/2013
|
$71.14
|
PP = $73.00
|
|
MB = $76.65
|
Most Recent Note - 5/3/2013 12:24:34 PM
G - Gapped up today and hit a new high, getting more extended from any sound base pattern. Its 50 DMA line and recent low ($70.09) define near-term support where violations would raise more serious concerns and trigger worrisome technical sell signals.
>>> The latest Featured Stock Update with an annotated graph appeared on 4/15/2013. Click here.
View all notes |
Alert me of new notes |
CANSLIM.net Company Profile |
SEC |
Zacks Reports |
StockTalk |
News |
Chart |
Request a new note
C
A N
S L
I M
|
Symbol/Exchange
Company Name
Industry Group |
PRICE |
CHANGE
(%Change) |
Day High |
Volume
(% DAV)
(% 50 day avg vol) |
52 Wk Hi
% From Hi |
Featured
Date |
Price
Featured |
Pivot Featured |
|
Max Buy |
LNKD
-
NYSE
Linkedin Corp Class A
INTERNET - Internet Information Providers
|
$176.92
|
+1.33
0.76% |
$178.69
|
3,488,453
151.47% of 50 DAV
50 DAV is 2,303,000
|
$202.91
-12.81%
|
4/12/2013
|
$182.69
|
PP = $184.25
|
|
MB = $193.46
|
Most Recent Note - 5/6/2013 6:38:26 PM
G - Held its ground today near its 50 DMA line. Gapped down on 5/03/13 undercutting prior highs in the $184 area with heavy volume behind a damaging loss. Reported earnings +200% on +72% sales revenues for the Mar '13 quarter.
>>> The latest Featured Stock Update with an annotated graph appeared on 4/29/2013. Click here.
View all notes |
Alert me of new notes |
CANSLIM.net Company Profile |
SEC |
Zacks Reports |
StockTalk |
News |
Chart |
Request a new note
C
A N
S L
I M
|
MRLN
-
NASDAQ
Marlin Business Services
DIVERSIFIED SERVICES - Rental and Leasing Services
|
$25.90
|
+0.57
2.25% |
$25.97
|
17,482
65.48% of 50 DAV
50 DAV is 26,700
|
$25.97
-0.27%
|
3/15/2013
|
$22.29
|
PP = $23.18
|
|
MB = $24.34
|
Most Recent Note - 5/6/2013 6:40:04 PM
G - Traded further above its "max buy" level with today's 3rd consecutive gain backed by lighter than average volume. No resistance remains due to overhead supply. Prior highs in the $23 area define support to watch on pullbacks.
>>> The latest Featured Stock Update with an annotated graph appeared on 5/2/2013. Click here.
View all notes |
Alert me of new notes |
CANSLIM.net Company Profile |
SEC |
Zacks Reports |
StockTalk |
News |
Chart |
Request a new note
C
A N
S L
I M
|
N
-
NYSE
Netsuite Inc
DIVERSIFIED SERVICES - Business/Management Services
|
$89.46
|
-0.31
-0.35% |
$90.00
|
223,164
60.25% of 50 DAV
50 DAV is 370,400
|
$91.02
-1.71%
|
12/12/2012
|
$64.75
|
PP = $67.12
|
|
MB = $70.48
|
Most Recent Note - 5/3/2013 6:22:48 PM
G - Hit another new all-time high with today's gain. Its 50 DMA line defines important near-term support to watch. Reported earnings -33% on +32% sales revenues for the Mar '13 quarter, marking a 2nd consecutive quarterly comparison with earnings below the +25% minimum guideline (C criteria).
>>> The latest Featured Stock Update with an annotated graph appeared on 4/22/2013. Click here.
View all notes |
Alert me of new notes |
CANSLIM.net Company Profile |
SEC |
Zacks Reports |
StockTalk |
News |
Chart |
Request a new note
C
A N
S L
I M
|
PRAA
-
NASDAQ
Portfolio Recovery Assoc
DIVERSIFIED SERVICES - Business/Management Services
|
$139.25
|
+0.28
0.20% |
$139.86
|
65,824
93.37% of 50 DAV
50 DAV is 70,500
|
$140.98
-1.23%
|
5/1/2013
|
$130.77
|
PP = $127.88
|
|
MB = $134.27
|
Most Recent Note - 5/3/2013
G - Spiked further into new high territory while adding to its streak of volume-driven gains including the previously noted "breakaway gap". It is extended from any sound base and prior highs near $127 define near-term support to watch on pullbacks. Reported earnings +54% on +21% sales revenues for the Mar '13 quarter.
>>> The latest Featured Stock Update with an annotated graph appeared on 5/1/2013. Click here.
View all notes |
Alert me of new notes |
CANSLIM.net Company Profile |
SEC |
Zacks Reports |
StockTalk |
News |
Chart |
Request a new note
C
A N
S L
I M
|
PRLB
-
NYSE
Proto Labs Inc
MANUFACTURING - Small Tools and Accessories
|
$54.50
|
-0.55
-1.00% |
$55.64
|
371,575
66.99% of 50 DAV
50 DAV is 554,700
|
$55.93
-2.56%
|
5/3/2013
|
$54.77
|
PP = $54.01
|
|
MB = $56.71
|
Most Recent Note - 5/3/2013 6:56:01 PM
Y - Highlighted in yellow in the earlier mid-day report, it posted a gain above the previously cited pivot point backed by +47% above average volume while hitting a new 52-week high triggering a technical buy signal. Reported earnings +46% on +24% sales revenues for the Mar '13 quarter, continuing its strong growth trend satisfying the C criteria. See the latest FSU analysis for more details and a new annotated graph.
>>> The latest Featured Stock Update with an annotated graph appeared on 5/3/2013. Click here.
View all notes |
Alert me of new notes |
CANSLIM.net Company Profile |
SEC |
Zacks Reports |
StockTalk |
News |
Chart |
Request a new note
C
A N
S L
I M
|
Symbol/Exchange
Company Name
Industry Group |
PRICE |
CHANGE
(%Change) |
Day High |
Volume
(% DAV)
(% 50 day avg vol) |
52 Wk Hi
% From Hi |
Featured
Date |
Price
Featured |
Pivot Featured |
|
Max Buy |
RRTS
-
NYSE
Roadrunner Trans Systems
TRANSPORTATION - Air Delivery and Freight Service
|
$25.34
|
+1.10
4.54% |
$25.43
|
278,398
152.80% of 50 DAV
50 DAV is 182,200
|
$24.33
4.15%
|
4/3/2013
|
$22.77
|
PP = $23.75
|
|
MB = $24.94
|
Most Recent Note - 5/6/2013 6:28:37 PM
G - Color code is changed to green after rallying beyond its "max buy" level with today's 3rd consecutive gain backed by above average volume.
>>> The latest Featured Stock Update with an annotated graph appeared on 4/23/2013. Click here.
View all notes |
Alert me of new notes |
CANSLIM.net Company Profile |
SEC |
Zacks Reports |
StockTalk |
News |
Chart |
Request a new note
C
A N
S L
I M
|
VRX
-
NYSE
Valeant Pharmaceuticals
DRUGS - Drug Manufacturers - Other
|
$73.42
|
-0.26
-0.35% |
$74.14
|
834,318
57.02% of 50 DAV
50 DAV is 1,463,100
|
$76.57
-4.11%
|
4/30/2013
|
$60.24
|
PP = $76.66
|
|
MB = $80.49
|
Most Recent Note - 5/6/2013 6:35:45 PM
Y- Sub par earnings for the Mar '13 quarter below the +25% minimum guideline (C criteria) raised fundamental concerns. Its 50 DMA line defines important near-term support above the recent low ($69.87 on 4/04/13). Subsequent violations may trigger technical sell signals.
>>> The latest Featured Stock Update with an annotated graph appeared on 4/30/2013. Click here.
View all notes |
Alert me of new notes |
CANSLIM.net Company Profile |
SEC |
Zacks Reports |
StockTalk |
News |
Chart |
Request a new note
C
A N
S L
I M
|
|
|
|
THESE ARE NOT BUY RECOMMENDATIONS!
Comments contained in the body of this report are technical
opinions only. The material herein has been obtained
from sources believed to be reliable and accurate, however,
its accuracy and completeness cannot be guaranteed.
This site is not an investment advisor, hence it does
not endorse or recommend any securities or other investments.
Any recommendation contained in this report may not
be suitable for all investors and it is not to be deemed
an offer or solicitation on our part with respect to
the purchase or sale of any securities. All trademarks,
service marks and trade names appearing in this report
are the property of their respective owners, and are
likewise used for identification purposes only.
This report is a service available
only to active Paid Premium Members.
You may opt-out of receiving report notifications
at any time. Questions or comments may be submitted
by writing to Premium Membership Services 665 S.E. 10 Street, Suite 201 Deerfield Beach, FL 33441-5634 or by calling 1-800-965-8307
or 954-785-1121.
|
|
|

