***Last / Change / Volume quote data in this table corresponds with the timestamp on the note***
Symbol/Exchange
Company Name
Industry Group |
Last |
Chg. |
Vol
% DAV |
Date Featured |
Price Featured |
Latest Pivot Point
Featured |
Status |
| Latest Max Buy Price |
AMZN
- NASDAQ
Amazon.com Inc
INTERNET - Internet Software & Services
|
$130.85
|
+1.02
|
8,522,923
114% DAV
7,466,600
|
4/23/2010
(Date
Featured) |
$144.41
(Price
Featured) |
PP = $146.01 |
G |
| MB = $153.31 |
Most Recent Note - 5/5/2010 3:51:19 PM
G - Held its ground today after a damaging gap down on 5/04/10 violated its 50 DMA line and triggered a technical sell signal. Broader market action (M criteria) is normally expected to impact 3 out of 4 stocks, and widespread losses are adding to concerns about the current rally's tenacity. AMZN was featured in the 4/23/10 mid-day report (read here) while it was encountering distributional pressure following strong results for the March 31, 2010 quarter.
>>> The latest Featured Stock Update with an annotated graph appeared on 4/23/2010. click here.
|
|
C
A
S
I |
News |
Chart |
SEC
View all notes Alert
me of new notes
Company
Profile
|
ARUN
- NASDAQ
Aruba Networks Inc
COMPUTER HARDWARE - Networking & Communication Dev
|
$11.75
|
-0.28
|
3,025,224
208% DAV
1,457,200
|
4/29/2010
(Date
Featured) |
$13.23
(Price
Featured) |
PP = $14.12 |
G |
| MB = $14.83 |
Most Recent Note - 5/5/2010 3:55:50 PM
G - Loss today on higher volume led to trading near its January 2010 highs. Recent worrisome distributional pressure triggered technical sell signals as it violated its 50 DMA line and prior chart lows. Broader market action (M criteria) is normally expected to impact 3 out of 4 stocks, and widespread losses are adding to concerns about the current rally's tenacity.
>>> The latest Featured Stock Update with an annotated graph appeared on 4/29/2010. click here.
|
|
C
A
S
I |
News |
Chart |
SEC
View all notes Alert
me of new notes
Company
Profile
|
BIDU
- NASDAQ
Baidu Inc Ads
INTERNET - Internet Information Providers
|
$693.00
|
-15.99
|
1,285,997
84% DAV
1,525,500
|
1/13/2010
(Date
Featured) |
$431.25
(Price
Featured) |
PP = $426.75 |
G |
| MB = $448.09 |
Most Recent Note - 5/4/2010 4:15:05 PM
G - Consolidating on light volume today, closing only -3.5% off its all-time high. Its streak of 13 consecutive weekly gains leaves it very extended from a sound base. Repeatedly noted - "could produce more climactic gains, especially due to the small supply (S criteria) of shares outstanding."
>>> The latest Featured Stock Update with an annotated graph appeared on 4/20/2010. click here.
|
|
C
A
S
I |
News |
Chart |
SEC
View all notes Alert
me of new notes
Company
Profile
|
BPI
- NYSE
Bridgepoint Education
DIVERSIFIED SERVICES - Education &; Training Services
|
$24.70
|
+1.03
|
627,771
130% DAV
481,600
|
4/13/2010
(Date
Featured) |
$25.59
(Price
Featured) |
PP = $25.76 |
G |
| MB = $27.05 |
Most Recent Note - 5/5/2010 3:09:55 PM
G - After another gap down today it has managed a positive reversal, making a stand near its 50 DMA line. The 3 losses with heavy volume in the past 4 sessions indicated distributional pressure. The Commercial Services - Schools firm was featured in yellow in the 4/13/10 mid-day report (read here) as rose from a cup-with-high-handle.
>>> The latest Featured Stock Update with an annotated graph appeared on 4/13/2010. click here.
|
|
C
A
S
I |
News |
Chart |
SEC
View all notes Alert
me of new notes
Company
Profile
|
BRLI
- NASDAQ
Bio Reference Labs Inc
HEALTH SERVICES - Medical Laboratories & Researc
|
$22.92
|
-0.08
|
149,151
77% DAV
194,500
|
2/12/2010
(Date
Featured) |
$39.02
(Price
Featured) |
PP = $20.49 |
G |
| MB = $21.51 |
Most Recent Note - 5/5/2010 3:41:11 PM
G - Down slightly on below average volume today, trading up from early lows near its 50 DMA line - always an important support level to watch. Consolidating quietly after a big winning streak and a 2:1 stock split. Its weekly chart has recently been marked by many up weeks with above average volume this year.
>>> The latest Featured Stock Update with an annotated graph appeared on 4/16/2010. click here.
|
|
C
A
S
I |
News |
Chart |
SEC
View all notes Alert
me of new notes
Company
Profile
|
CISG
- NASDAQ
Cninsure Inc Ads
INSURANCE - Insurance Brokers
|
$27.56
|
-0.84
|
208,168
82% DAV
255,100
|
3/3/2010
(Date
Featured) |
$24.38
(Price
Featured) |
PP = $23.10 |
Y |
| MB = $24.26 |
Most Recent Note - 5/4/2010 4:26:16 PM
Y - Consolidating near its 52-week high. Its color code was changed to yellow again on 4/29/10, however the prior high is not considered a "pivot point" by definition since it did not form a proper new base.
>>> The latest Featured Stock Update with an annotated graph appeared on 4/19/2010. click here.
|
|
C
A
S
I |
News |
Chart |
SEC
View all notes Alert
me of new notes
Company
Profile
|
CRM
- NYSE
Salesforce.com Inc
INTERNET - Internet Software & Services
|
$86.59
|
-1.13
|
2,270,357
134% DAV
1,690,800
|
3/5/2010
(Date
Featured) |
$72.28
(Price
Featured) |
PP = $75.53 |
G |
| MB = $79.31 |
Most Recent Note - 5/4/2010 4:31:47 PM
G - Churning near its all-time high today, enduring some distributional pressure while closing the session still only -3.3% off its high. Its 50 DMA line (now $78.14) is the nearest chart support level.
>>> The latest Featured Stock Update with an annotated graph appeared on 4/21/2010. click here.
|
|
C
A
S
I |
News |
Chart |
SEC
View all notes Alert
me of new notes
Company
Profile
|
CTRP
- NASDAQ
Ctrip.com Intl Ltd Adr
LEISURE - Resorts & Casinos
|
$35.29
|
-1.31
|
1,271,616
68% DAV
1,872,500
|
3/25/2010
(Date
Featured) |
$40.74
(Price
Featured) |
PP = $39.40 |
G |
| MB = $41.37 |
Most Recent Note - 5/5/2010 3:47:12 PM
G - Loss on below average volume today raises more serious concerns, technically, as it traded under its 4/21/10 low ($35.60) and 3/22/10 low ($34.85). Only a prompt rebound above its 50 DMA would help its outlook.
>>> The latest Featured Stock Update with an annotated graph appeared on 4/12/2010. click here.
|
|
C
A
S
I |
News |
Chart |
SEC
View all notes Alert
me of new notes
Company
Profile
|
EZPW
- NASDAQ
Ezcorp Inc Cl A
SPECIALTY RETAIL - Specialty Retail, Other
|
$19.67
|
-1.41
|
888,905
161% DAV
553,600
|
4/14/2010
(Date
Featured) |
$21.80
(Price
Featured) |
PP = $22.29 |
G |
| MB = $23.40 |
Most Recent Note - 5/5/2010 2:46:04 PM
G - Considerable loss today with above average volume has led to more worrisome deterioration below its 50 DMA line. Previously noted loss on 4/30/10 triggered technical sell signals. A prompt repair of the 50 DMA breach would help its outlook, meanwhile greater concerns have been raised.
>>> The latest Featured Stock Update with an annotated graph appeared on 4/27/2010. click here.
|
|
C
A
S
I |
News |
Chart |
SEC
View all notes Alert
me of new notes
Company
Profile
|
ISRG
- NASDAQ
Intuitive Surgical Inc
HEALTH SERVICES - Medical Appliances & Equipment
|
$345.14
|
-16.58
|
597,224
105% DAV
570,800
|
4/13/2010
(Date
Featured) |
$363.46
(Price
Featured) |
PP = $367.10 |
G |
| MB = $385.46 |
Most Recent Note - 5/5/2010 2:48:27 PM
G - Gapped down today violating its recent chart low and 50 DMA line, raising more serious concerns and triggering technical sell signals. Color code is changed to green. ISRG was featured again in the 4/13/10 mid-day report (read here) with new pivot point cited based on its 3/03/10 high.
>>> The latest Featured Stock Update with an annotated graph appeared on 5/3/2010. click here.
|
|
C
A
S
I |
News |
Chart |
SEC
View all notes Alert
me of new notes
Company
Profile
|
LL
- NYSE
Lumber Liquidators Hldgs
RETAIL - Home Improvement Stores
|
$30.07
|
-1.45
|
360,270
86% DAV
418,800
|
4/22/2010
(Date
Featured) |
$29.87
(Price
Featured) |
PP = $29.03 |
G |
| MB = $30.48 |
Most Recent Note - 5/4/2010 4:41:20 PM
G - Consolidating above prior chart highs in the $28 area, its "positive reversal" on 4/28/10 was a recent sign of prompt support. First featured in yellow at $29.87 in the 4/22/10 the mid-day report (read here).
>>> The latest Featured Stock Update with an annotated graph appeared on 4/26/2010. click here.
|
|
C
A
S
I |
News |
Chart |
SEC
View all notes Alert
me of new notes
Company
Profile
|
LOPE
- NASDAQ
Grand Canyon Education
DIVERSIFIED SERVICES - Education &; Training Services
|
$25.49
|
+0.46
|
447,714
124% DAV
360,100
|
4/13/2010
(Date
Featured) |
$27.71
(Price
Featured) |
PP = $27.33 |
G |
| MB = $28.70 |
Most Recent Note - 5/5/2010 2:54:29 PM
G - Its gain today suggests that support is being found near its 50 DMA line after a recent streak of 8 consecutive losses. Many for-profit schools have encountered distributional pressure in the wake of recently proposed regulatory changes.
>>> The latest Featured Stock Update with an annotated graph appeared on 4/14/2010. click here.
|
|
C
A
S
I |
News |
Chart |
SEC
View all notes Alert
me of new notes
Company
Profile
|
PCLN
- NASDAQ
Priceline.com Inc
INTERNET - Internet Software & Services
|
$399.55
|
-4.72
|
584,812
N/A
|
11/1/2002
(Date
Featured) |
$399.55
(Price
Featured) |
PP = $428.20 |
Y |
| MB = $449.61 |
Most Recent Note - 1/2/2011
Y - Returns to Featured Stocks list with its appearance in the January 2011 CANSLIM.net News including detailed analysis and annotated daily and weekly graphs.
>>> The latest Featured Stock Update with an annotated graph appeared on 4/28/2010. click here.
|
|
C
A
S
I |
News |
Chart |
SEC
View all notes Alert
me of new notes
Company
Profile
|
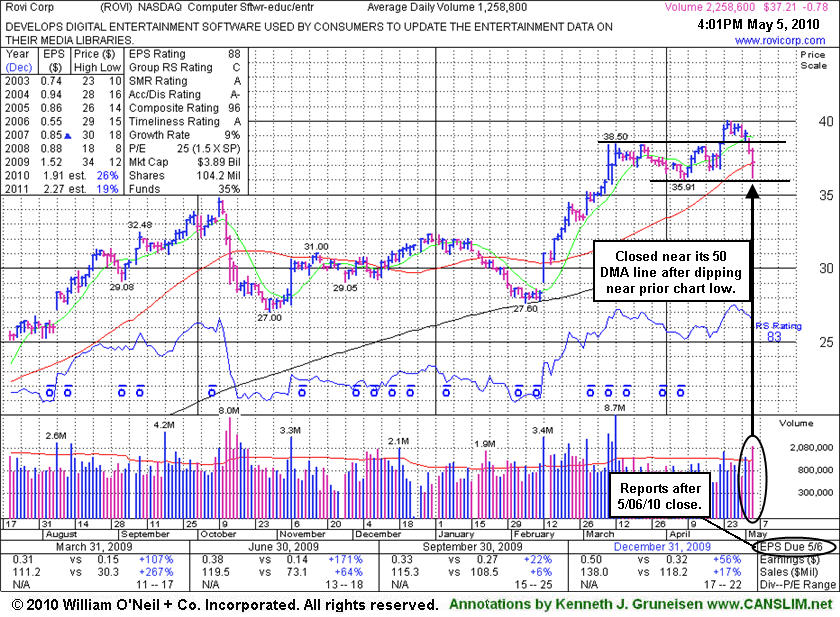
ROVI
- NASDAQ
Rovi Corp
COMPUTER SOFTWARE & SERVICES - Security Software & Services
|
$37.21
|
-0.78
|
2,258,686
178% DAV
1,269,400
|
4/20/2010
(Date
Featured) |
$37.62
(Price
Featured) |
PP = $38.60 |
G |
| MB = $40.53 |
Most Recent Note - 5/5/2010 4:11:27 PM
G - Closed near its 50 DMA line in the middle of its intra-day range after undercutting that important short-term average earlier while dipping near its recent chart low. Color code was changed to green based on the distributional action ahead of earnings news due Thursday, May 6th after the close.
>>> The latest Featured Stock Update with an annotated graph appeared on 5/5/2010. click here.
|
|
C
A
S
I |
News |
Chart |
SEC
View all notes Alert
me of new notes
Company
Profile
|
SIRO
- NASDAQ
Sirona Dental Systems
HEALTH SERVICES - Medical Instruments & Supplies
|
$38.27
|
-4.60
|
2,089,330
422% DAV
494,700
|
2/16/2010
(Date
Featured) |
$36.43
(Price
Featured) |
PP = $36.15 |
G |
| MB = $37.96 |
Most Recent Note - 5/5/2010 12:02:08 PM
G - Gapped down today after reporting +231% earnings on +15% sales revenues for the quarter ended March 31, 2010 versus the year ago period. Its considerable loss with heavy volume led to a breach of its 50 DMA line and earlier trading near its 4/08/10 low ($37.00), levels noted recently as support.
>>> The latest Featured Stock Update with an annotated graph appeared on 4/22/2010. click here.
|
|
C
A
S
I |
News |
Chart |
SEC
View all notes Alert
me of new notes
Company
Profile
|
SUMR
- NASDAQ
Summer Infant Inc
CONSUMER NON-DURABLES - Personal Products
|
$7.05
|
+0.05
|
46,998
106% DAV
44,300
|
5/4/2010
(Date
Featured) |
$6.85
(Price
Featured) |
PP = $7.09 |
Y |
| MB = $7.44 |
Most Recent Note - 5/5/2010 4:17:18 PM
Y - Held its ground today, showing resilience amid a mostly negative market. Perched near its pivot point, it was featured in the 5/04/10 mid-day report (read here) - "Inching into new high ground this week on the right side of a 7-week flat base above its 50 DMA line and well above prior chart highs in the $5 area. Color code is yellow with pivot point noted based upon its 3/15/10 high plus ten cents. Quarterly earnings (C criteria) in the 2 latest quarterly comparisons showed great increases while sales revenues growth accelerated to +27% in the period ended Mach 31, 2010. It has a good annual earnings (A criteria) history, and a small supply (S criteria) of only 11.0 million shares in the public float. Technically, a gain and strong close above its pivot point with heavy volume would trigger a buy signal."
>>> The latest Featured Stock Update with an annotated graph appeared on 5/4/2010. click here.
|
|
C
A
S
I |
News |
Chart |
SEC
View all notes Alert
me of new notes
Company
Profile
|
ULTA
- NASDAQ
Ulta Salon Cosm & Frag
SPECIALTY RETAIL - Specialty Retail, Other
|
$23.01
|
-0.92
|
254,651
59% DAV
431,100
|
3/12/2010
(Date
Featured) |
$22.81
(Price
Featured) |
PP = $21.72 |
G |
| MB = $22.81 |
Most Recent Note - 5/4/2010 4:55:14 PM
G - Consolidating on quiet volume today, closing only -10.7% off its 52-week high. A subsequent violation of its 50 DMA line or recent chart low $21.66 would trigger damaging technical sell signals.
>>> The latest Featured Stock Update with an annotated graph appeared on 4/30/2010. click here.
|
|
C
A
S
I |
News |
Chart |
SEC
View all notes Alert
me of new notes
Company
Profile
|
VIT
-
|
$23.06
|
-1.13
|
1,479,773
208% DAV
710,500
|
4/9/2010
(Date
Featured) |
$23.79
(Price
Featured) |
PP = $23.95 |
G |
| MB = $25.15 |
Most Recent Note - 5/5/2010 2:52:40 PM
G - Gapped down today and considerably undercut its 50 DMA line earlier, yet it found prompt support and is now trading above that important short-term average and in the upper third of its intra-day range. Color code is changed to green based on recent distributional action. Broader market action (M criteria) is normally expected to impact 3 out of 4 stocks, and widespread losses are adding to concerns about the current rally's tenacity.
>>> The latest Featured Stock Update with an annotated graph appeared on 4/9/2010. click here.
|
|
C
A
S
I |
News |
Chart |
SEC
View all notes Alert
me of new notes
Company
Profile
|