You are not logged in.
This means you
CAN ONLY VIEW reports that were published prior to Monday, April 14, 2025.
You
MUST UPGRADE YOUR MEMBERSHIP if you want to see any current reports.
AFTER MARKET UPDATE - WEDNESDAY, MAY 4TH, 2011
Previous After Market Report Next After Market Report >>>
|
|
|
|
DOW |
-83.93 |
12,723.58 |
-0.66% |
|
Volume |
1,090,625,010 |
+9% |
|
Volume |
2,170,314,520 |
+0% |
|
NASDAQ |
-13.39 |
2,828.23 |
-0.47% |
|
Advancers |
923 |
30% |
|
Advancers |
705 |
26% |
|
S&P 500 |
-9.30 |
1,347.32 |
-0.69% |
|
Decliners |
2,098 |
67% |
|
Decliners |
1,907 |
70% |
|
Russell 2000 |
-10.87 |
832.90 |
-1.29% |
|
52 Wk Highs |
88 |
|
|
52 Wk Highs |
52 |
|
|
S&P 600 |
-4.71 |
443.95 |
-1.05% |
|
52 Wk Lows |
28 |
|
|
52 Wk Lows |
53 |
|
|
 |
Uptrend Under Pressure As Decliners Trump Advancers
Kenneth J. Gruneisen - Passed the CAN SLIM® Master's Exam
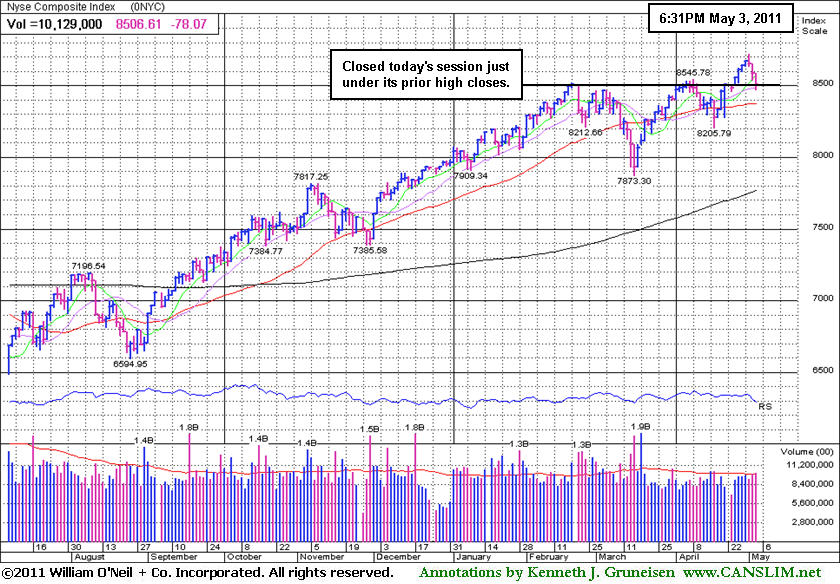
The major averages ended lower again on Wednesday. Declining issues beat advancers by more than 2-1 on the NYSE and by 5-2 on the Nasdaq exchange. Volume totals were reported higher that the prior session totals on both major stock exchanges, indicating that stocks were still enduring distributional pressure. New 52-week highs solidly outnumbered new 52-week lows on the NYSE, but on the Nasdaq exchange the totals were nearly even. There were 23 high-ranked companies from the CANSLIM.net Leaders List that made new 52-week highs and appeared on the CANSLIM.net BreakOuts Page, up slightly from the total of 17 on the prior session. On the Featured Stocks Page there were gains from only 3 of 18 high-ranked market leaders currently listed. Recent commentaries have repeatedly observed, "New set-ups with strong characteristics and fresh breakouts from high-ranked leaders have been scarce in recent weeks, even while the major averages have rallied."
The newspaper described the conditions concerning the M criteria as an "uptrend under pressure" again after Tuesday's weak session. This does not mean to run out and sell every stock you own, however, when the market is under pressure, it is not considered the best time to be entering new positions. Meanwhile, on Wednesday stocks and commodities were under selling pressure as disappointing data on the service sector and jobs overshadowed enthusiasm for mergers. The ISM non-manufacturing index for April rose at its slowest pace in eight months. Private-sector payrolls estimated by ADP gained less than forecast in April. The report raised concerns about the government jobs report on Friday.
Energy and mining companies were the hardest hit sectors as gold and silver tumbled for a third day. Crude oil fell below $110 after a report that U.S. supplies jumped more than expected. Silver prices have tumbled by -20% since Friday.
Applied Materials Inc (AMAT -0.98%) agreed to buy Varian Semiconductor Equipment (VSEA +51.3%) for $4.9 billion. Ralcorp Holdings Inc (RAH +4.9%) rallied after its board rejected a $4.9 billion offer from ConAgra Foods Inc (CAG +3.07%). Renren Inc (RENN +28.64%), the Chinese social networking site, rallied for a considerable gain on its first day of trading in New York.
Pundits have said that valuations are an increasing concern after last week's rally lifted the benchmark S&P 500 Index close to a three-year high. On Wednesday last week the Nasdaq Composite Index topped its October 2007 high. The S&P Mid-Cap 400 Index and S&P Small-Cap 600 Index both are at all-time highs.
Be ready for the May 2011 issue of CANSLIM.net News to be released soon! CANSLIM.net News includes a comprehensive summary of market action, leading industry groups, the most action-worthy leaders, and more. Only upgraded members can access CANSLIM.net News.
PICTURED: The NYSE Composite Index fell for a 3rd consecutive session and closed just under its prior high closes.
|
 Kenneth J. Gruneisen started out as a licensed stockbroker in August 1987, a couple of months prior to the historic stock market crash that took the Dow Jones Industrial Average down -22.6% in a single day. He has published daily fact-based fundamental and technical analysis on high-ranked stocks online for two decades. Through FACTBASEDINVESTING.COM, Kenneth provides educational articles, news, market commentary, and other information regarding proven investment systems that work in good times and bad.
Comments contained in the body of this report are technical opinions only and are not necessarily those of Gruneisen Growth Corp. The material herein has been obtained from sources believed to be reliable and accurate, however, its accuracy and completeness cannot be guaranteed. Our firm, employees, and customers may effect transactions, including transactions contrary to any recommendation herein, or have positions in the securities mentioned herein or options with respect thereto. Any recommendation contained in this report may not be suitable for all investors and it is not to be deemed an offer or solicitation on our part with respect to the purchase or sale of any securities. |
|
 |
Energy Group Slumping Quickly
Kenneth J. Gruneisen - Passed the CAN SLIM® Master's Exam
Energy-related shares were weaker as the Oil Services Index ($OSX -1.83%) and Integrated Oil Index ($XOI -1.77%) fell. Financial shares also had a negative influence and created a drag on the a major averages as the Broker/Dealer Index ($XBD -1.23%) and Bank Index ($BKX -0.97%) faced pressure. The Gold & Silver Index ($XAU -0.62%) and Healthcare Index ($HMO -0.90%) suffered modest losses, giving "safe haven" investors no reward. The Networking Index ($NWX -1.99%) led the tech sector lower while the Internet Index ($IIX -0.74%) and Biotechnology Index ($BTK -0.63%) were both down modestly and the Semiconductor Index ($SOX +0.06%) held its ground. The Retail Index ($RLX -0.11%) was also among the best performing standouts while it barely inched lower.
Charts courtesy www.stockcharts.com
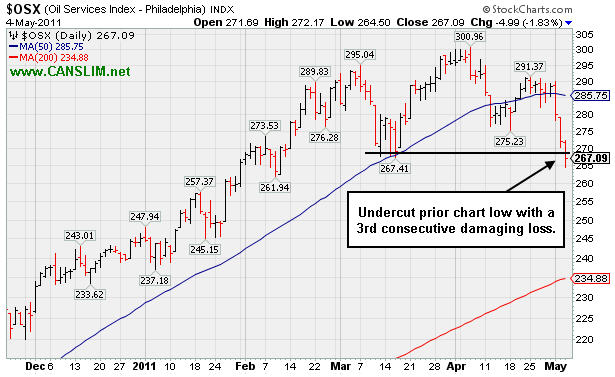
PICTURED: The Oil Services Index ($OSX -1.83%) undercut its prior chart low with a 3rd consecutive damaging loss.
| Oil Services |
$OSX |
267.09 |
-4.99 |
-1.83% |
+8.96% |
| Healthcare |
$HMO |
2,295.26 |
-20.89 |
-0.90% |
+35.65% |
| Integrated Oil |
$XOI |
1,335.10 |
-24.09 |
-1.77% |
+10.05% |
| Semiconductor |
$SOX |
439.70 |
+0.27 |
+0.06% |
+6.77% |
| Networking |
$NWX |
326.24 |
-6.61 |
-1.99% |
+16.28% |
| Internet |
$IIX |
320.68 |
-2.40 |
-0.74% |
+4.21% |
| Broker/Dealer |
$XBD |
118.85 |
-1.48 |
-1.23% |
-2.19% |
| Retail |
$RLX |
540.30 |
-0.62 |
-0.11% |
+6.28% |
| Gold & Silver |
$XAU |
208.75 |
-1.30 |
-0.62% |
-7.87% |
| Bank |
$BKX |
51.31 |
-0.50 |
-0.97% |
-1.72% |
| Biotech |
$BTK |
1,458.45 |
-9.27 |
-0.63% |
+12.39% |
|
|
|
 |
Damaging Losses Triggered Technical Sell Signals
Kenneth J. Gruneisen - Passed the CAN SLIM® Master's Exam
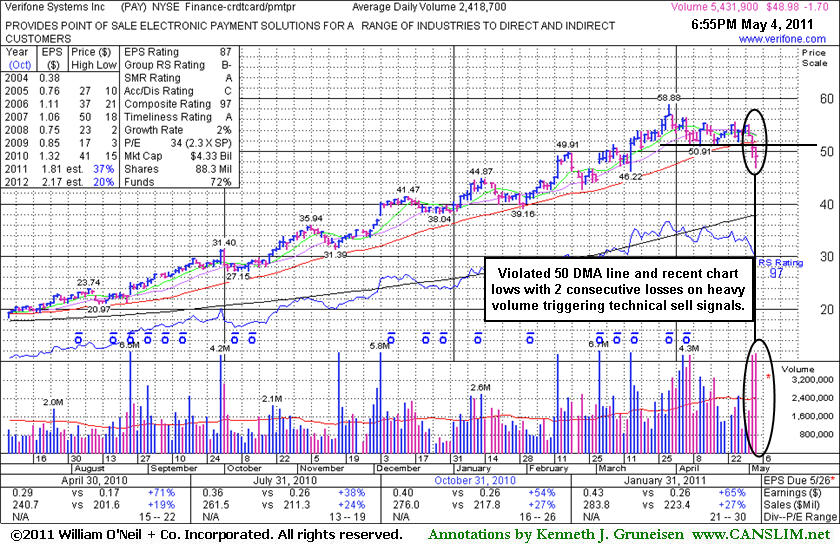
Verifone Systems Inc (PAY -$1.70 or -3.35% to $48.98) was down considerably again today with heavy volume. A violation of its 50-day moving average (DMA) line and prior chart lows on 5/03/11 with a damaging loss on above average volume raised concerns and triggered technical sell signals. It recently formed a short flat base, considered a riskier "late-stage" base, but following the deterioration its color code was changed to green. The "Ken's Mailbag" Q&A in the 4/29/11 After Market Update included more details about late-stage bases (read here).
Since its last appearance on 4/04/11 in this FSU section with detailed analysis and an annotated graph under the headline, "Volume Without Progress Indicates Distributional Pressure", its 50 DMA line was repeatedly noted as chart support to watch. A prompt rebound above its 50 DMA would help its outlook, however it may be a while before another sound base forms, and in the interim disciplined investors might look at other fresh breakouts as better buy candidates.
The number of top-rated funds owning its shares rose from 380 in March '10 to 623 in March '11, a nice reassurance concerning the I criteria. It traded up as much as +142.3% from its price when it was featured on 8/25/10 in yellow at $24.30 in the mid-day report (read here) while then rising from a cup-with-handle base. The downward turn in FY '08 annual earnings (A criteria) was previously noted as a concern, yet its recent bullish action and accelerating sales revenues and earnings growth in recent quarterly comparisons provided reassuring signs. Additionally, leadership (new highs) from other electronic payment-related firms has recently provided reassurances with respect to the L criteria of the fact-based system, however the Finance - Credit Card Payment Processing group currently has a mediocre Group RS rating of 62.
|
|
|
Color Codes Explained :
Y - Better candidates highlighted by our
staff of experts.
G - Previously featured
in past reports as yellow but may no longer be buyable under the
guidelines.
***Last / Change / Volume data in this table is the closing quote data***
Symbol/Exchange
Company Name
Industry Group |
PRICE |
CHANGE
(%Change) |
Day High |
Volume
(% DAV)
(% 50 day avg vol) |
52 Wk Hi
% From Hi |
Featured
Date |
Price
Featured |
Pivot Featured |
|
Max Buy |
AIXG
-
NASDAQ
Aixtron Se
ELECTRONICS - Semiconductor Equipment andamp; Mate
|
$40.97
|
-0.43
-1.04% |
$41.76
|
432,172
163.70% of 50 DAV
50 DAV is 264,000
|
$44.96
-8.87%
|
4/5/2011
|
$44.14
|
PP = $44.64
|
|
MB = $46.87
|
 Most Recent Note - 5/4/2011 8:11:18 PM
G - Down again today with above average volume, slumping further below its 50 DMA line. Now perched -8.9% off its all-time high. It recently found support near prior lows in the $38 area.
>>> The latest Featured Stock Update with an annotated graph appeared on 4/5/2011. Click here.
View all notes |
Alert me of new notes |
CANSLIM.net Company Profile |
SEC |
Zacks Reports |
StockTalk |
News |
Chart |
Request a new note
C
A N
S L
I M


|
BIDU
-
NASDAQ
Baidu Inc Ads
INTERNET - Internet Information Providers
|
$139.01
|
-0.83
-0.59% |
$141.85
|
13,977,593
187.95% of 50 DAV
50 DAV is 7,437,000
|
$156.04
-10.91%
|
3/17/2011
|
$121.97
|
PP = $131.73
|
|
MB = $138.32
|
Most Recent Note - 5/4/2011 8:02:24 PM
G - Closed in the upper half of its intra-day range after testing its 50 DMA line today. Recent losses on heavy volume marked worrisome distributional action while pulling back. Slumping toward its prior high near $131 defining additional support to watch below its short-term average.
>>> The latest Featured Stock Update with an annotated graph appeared on 4/7/2011. Click here.
View all notes |
Alert me of new notes |
CANSLIM.net Company Profile |
SEC |
Zacks Reports |
StockTalk |
News |
Chart |
Request a new note
C
A N
S L
I M
|
CMG
-
NYSE
Chipotle Mexican Grill
LEISURE - Restaurants
|
$260.53
|
+0.12
0.05% |
$261.40
|
1,393,064
120.57% of 50 DAV
50 DAV is 1,155,400
|
$289.35
-9.96%
|
4/1/2011
|
$274.00
|
PP = $275.10
|
|
MB = $288.86
|
Most Recent Note - 5/4/2011 8:04:55 PM
G - A positive reversal today helped it overcome an early loss and close near the session high, finishing very near its 50 DMA line. It recently negated its latest technical breakout, and it is now perched -10% off its 52-week high.
>>> The latest Featured Stock Update with an annotated graph appeared on 4/13/2011. Click here.
View all notes |
Alert me of new notes |
CANSLIM.net Company Profile |
SEC |
Zacks Reports |
StockTalk |
News |
Chart |
Request a new note
C
A N
S L
I M
|
CTSH
-
NASDAQ
Cognizant Tech Sol Cl A
COMPUTER SOFTWARE and SERVICES - Business Software and Services
|
$77.27
|
-0.25
-0.32% |
$78.49
|
3,739,559
167.84% of 50 DAV
50 DAV is 2,228,000
|
$83.48
-7.44%
|
2/7/2011
|
$75.09
|
PP = $76.46
|
|
MB = $80.28
|
Most Recent Note - 5/4/2011 8:09:39 PM
G - Small loss on above average volume today after a 5/03/11 gap down violating its 50 DMA line triggered a technical sell signal following earnings news. Increased earnings +34% on +43% sales revenues for the quarter ended March 31, 2011 versus the year ago period.
>>> The latest Featured Stock Update with an annotated graph appeared on 4/15/2011. Click here.
View all notes |
Alert me of new notes |
CANSLIM.net Company Profile |
SEC |
Zacks Reports |
StockTalk |
News |
Chart |
Request a new note
C
A N
S L
I M
|
EZPW
-
NASDAQ
Ezcorp Inc Cl A
SPECIALTY RETAIL - Specialty Retail, Other
|
$29.82
|
-0.85
-2.77% |
$30.70
|
256,185
68.87% of 50 DAV
50 DAV is 372,000
|
$33.08
-9.85%
|
2/18/2011
|
$27.94
|
PP = $30.04
|
|
MB = $31.54
|
Most Recent Note - 5/4/2011 2:17:46 PM
G - Slumping near its 50 DMA line again. After negating its recent breakout it has not formed a sound new base pattern.
>>> The latest Featured Stock Update with an annotated graph appeared on 4/11/2011. Click here.
View all notes |
Alert me of new notes |
CANSLIM.net Company Profile |
SEC |
Zacks Reports |
StockTalk |
News |
Chart |
Request a new note
C
A N
S L
I M
|
Symbol/Exchange
Company Name
Industry Group |
PRICE |
CHANGE
(%Change) |
Day High |
Volume
(% DAV)
(% 50 day avg vol) |
52 Wk Hi
% From Hi |
Featured
Date |
Price
Featured |
Pivot Featured |
|
Max Buy |
FOSL
-
NASDAQ
Fossil Inc
CONSUMER DURABLES - Recreational Goods, Other
|
$91.70
|
+0.69
0.76% |
$92.42
|
432,502
49.41% of 50 DAV
50 DAV is 875,300
|
$96.99
-5.45%
|
2/1/2011
|
$73.30
|
PP = $74.44
|
|
MB = $78.16
|
Most Recent Note - 5/4/2011 2:27:32 PM
G - It could produce more climactic gains, but it is extended from any sound base. It is consolidating in a healthy manner above its 50 DMA line and prior chart highs defining support. See latest FSU analysis for more details and a new annotated graph.
>>> The latest Featured Stock Update with an annotated graph appeared on 5/2/2011. Click here.
View all notes |
Alert me of new notes |
CANSLIM.net Company Profile |
SEC |
Zacks Reports |
StockTalk |
News |
Chart |
Request a new note
C
A N
S L
I M
|
HMSY
-
NASDAQ
H M S Holdings Corp
COMPUTER SOFTWARE and SERVICES - Healthcare Information Service
|
$75.09
|
-1.30
-1.70% |
$76.43
|
253,894
141.68% of 50 DAV
50 DAV is 179,200
|
$84.82
-11.47%
|
11/19/2010
|
$61.89
|
PP = $63.01
|
|
MB = $66.16
|
Most Recent Note - 5/4/2011 8:16:06 PM
G - Closed in the lower half of its intra-day range today with a 4th consecutive loss with above average volume Violated its 50 DMA line last week with a loss on heavy volume triggering a technical sell signal. Reported earnings +26% on +27% sales revenues for the quarter ended March 31, 2011 versus the year ago period.
>>> The latest Featured Stock Update with an annotated graph appeared on 4/26/2011. Click here.
View all notes |
Alert me of new notes |
CANSLIM.net Company Profile |
SEC |
Zacks Reports |
StockTalk |
News |
Chart |
Request a new note
C
A N
S L
I M
|
HS
-
NYSE
Healthspring Inc
HEALTH SERVICES - Health Care Plans
|
$41.49
|
-1.78
-4.11% |
$43.17
|
794,189
83.82% of 50 DAV
50 DAV is 947,500
|
$44.37
-6.49%
|
3/22/2011
|
$38.29
|
PP = $38.85
|
|
MB = $40.79
|
Most Recent Note - 5/4/2011 2:20:30 PM
G - Pulling back today on lighter volume, slumping toward prior highs after volume-driven gains. Its 50 DMA line defines important chart support.
>>> The latest Featured Stock Update with an annotated graph appeared on 4/21/2011. Click here.
View all notes |
Alert me of new notes |
CANSLIM.net Company Profile |
SEC |
Zacks Reports |
StockTalk |
News |
Chart |
Request a new note
C
A N
S L
I M
|
INFA
-
NASDAQ
Informatica Corp
COMPUTER SOFTWARE and SERVICES - Business Software and Services
|
$51.65
|
-1.13
-2.14% |
$52.89
|
1,496,865
146.77% of 50 DAV
50 DAV is 1,019,900
|
$56.49
-8.57%
|
3/24/2011
|
$50.04
|
PP = $49.86
|
|
MB = $52.35
|
Most Recent Note - 5/4/2011 8:13:37 PM
G - Down again today with above average volume indicative of distributional pressure following a negative reversal on 5/02/11 after touching a new 52-week high. Pulling back near prior highs in the $49 area and its 50 DMA line defining important support to watch.
>>> The latest Featured Stock Update with an annotated graph appeared on 4/27/2011. Click here.
View all notes |
Alert me of new notes |
CANSLIM.net Company Profile |
SEC |
Zacks Reports |
StockTalk |
News |
Chart |
Request a new note
C
A N
S L
I M
|
LULU
-
NASDAQ
Lululemon Athletica
MANUFACTURING - Textile Manufacturing
|
$93.23
|
-0.07
-0.08% |
$94.94
|
1,730,643
76.57% of 50 DAV
50 DAV is 2,260,300
|
$102.83
-9.33%
|
3/28/2011
|
$68.11
|
PP = $85.38
|
|
MB = $89.65
|
Most Recent Note - 5/3/2011 6:55:30 PM
G - Down again today, with higher volume indicative of distributional pressure. This high-ranked Retail-Apparel firm has been noted as extended from any sound base pattern. Prior highs and its 50 DMA line in the $85 area define important chart support to watch. See the latest FSU analysis for more details and a new annotated graph.
>>> The latest Featured Stock Update with an annotated graph appeared on 5/3/2011. Click here.
View all notes |
Alert me of new notes |
CANSLIM.net Company Profile |
SEC |
Zacks Reports |
StockTalk |
News |
Chart |
Request a new note
C
A N
S L
I M
|
Symbol/Exchange
Company Name
Industry Group |
PRICE |
CHANGE
(%Change) |
Day High |
Volume
(% DAV)
(% 50 day avg vol) |
52 Wk Hi
% From Hi |
Featured
Date |
Price
Featured |
Pivot Featured |
|
Max Buy |
MG
-
NYSE
Mistras Group Inc
DIVERSIFIED SERVICES - Bulding and Faci;ity Management Services
|
$16.34
|
-0.48
-2.85% |
$16.79
|
174,283
135.42% of 50 DAV
50 DAV is 128,700
|
$18.46
-11.48%
|
3/15/2011
|
$15.48
|
PP = $15.90
|
|
MB = $16.70
|
Most Recent Note - 5/4/2011 2:22:58 PM
G - Down again today and violating its 50 DMA line, raising concerns. On 5/03/11 it undercut prior highs after announcing plans for a new Public Offering.
>>> The latest Featured Stock Update with an annotated graph appeared on 4/12/2011. Click here.
View all notes |
Alert me of new notes |
CANSLIM.net Company Profile |
SEC |
Zacks Reports |
StockTalk |
News |
Chart |
Request a new note
C
A N
S L
I M
|
MWIV
-
NASDAQ
M W I Veterinary Supply
HEALTH SERVICES - Medical Instruments and; Supplies
|
$79.58
|
-1.11
-1.38% |
$81.36
|
62,004
61.63% of 50 DAV
50 DAV is 100,600
|
$84.97
-6.34%
|
11/4/2010
|
$61.79
|
PP = $59.60
|
|
MB = $62.58
|
Most Recent Note - 5/3/2011 4:17:13 PM
G - Down today with higher (near average) volume indicative of distributional pressure, finishing -5% off its all-time high. Due to report earnings on the morning of Thursday, May 5th. It is extended from any sound base pattern, and its 50 DMA line defines important support to watch. Since first featured in yellow on 7/29/10 it has traded as much as +63% higher.
>>> The latest Featured Stock Update with an annotated graph appeared on 4/8/2011. Click here.
View all notes |
Alert me of new notes |
CANSLIM.net Company Profile |
SEC |
Zacks Reports |
StockTalk |
News |
Chart |
Request a new note
C
A N
S L
I M
|
OPEN
-
NASDAQ
Opentable Inc
INTERNET - Internet Software and Services
|
$89.35
|
-15.65
-14.90% |
$96.76
|
6,402,835
531.62% of 50 DAV
50 DAV is 1,204,400
|
$118.66
-24.70%
|
3/17/2011
|
$90.71
|
PP = $96.07
|
|
MB = $100.87
|
Most Recent Note - 5/4/2011 9:42:57 AM
G - Reported earnings for the quarter ended March 31, 2011 and gapped down today, violating its 50 DMA line and recent lows triggering technical sell signals after a damaging loss on the prior session.
>>> The latest Featured Stock Update with an annotated graph appeared on 4/25/2011. Click here.
View all notes |
Alert me of new notes |
CANSLIM.net Company Profile |
SEC |
Zacks Reports |
StockTalk |
News |
Chart |
Request a new note
C
A N
S L
I M
|
PAY
-
NYSE
Verifone Systems Inc
COMPUTER HARDWARE - Transaction Automation Systems
|
$48.98
|
-1.70
-3.35% |
$50.76
|
5,452,300
229.21% of 50 DAV
50 DAV is 2,378,700
|
$58.88
-16.81%
|
4/29/2011
|
$54.73
|
PP = $58.98
|
|
MB = $61.93
|
Most Recent Note - 5/4/2011 8:18:34 PM
G - Down considerably with volume-driven losses this week violating its 50 DMA line and prior lows triggering technical sell signals. See the latest FSU analysis for more details and a new annotated graph.
>>> The latest Featured Stock Update with an annotated graph appeared on 5/4/2011. Click here.
View all notes |
Alert me of new notes |
CANSLIM.net Company Profile |
SEC |
Zacks Reports |
StockTalk |
News |
Chart |
Request a new note
C
A N
S L
I M
|
PCLN
-
NASDAQ
Priceline.Com Inc
INTERNET - Internet Software and Services
|
$537.56
|
-2.55
-0.47% |
$544.23
|
1,139,672
95.39% of 50 DAV
50 DAV is 1,194,700
|
$561.88
-4.33%
|
1/3/2011
|
$399.55
|
PP = $428.20
|
|
MB = $449.61
|
Most Recent Note - 5/3/2011 4:42:05 PM
G - Pulling back from a new 52-week high this week without great volume conviction. It may go on to produce more climactic gains, yet it has been repeatedly noted - "Extended from any sound base pattern. Its 50 DMA line has defined support throughout its advance."
>>> The latest Featured Stock Update with an annotated graph appeared on 4/20/2011. Click here.
View all notes |
Alert me of new notes |
CANSLIM.net Company Profile |
SEC |
Zacks Reports |
StockTalk |
News |
Chart |
Request a new note
C
A N
S L
I M
|
Symbol/Exchange
Company Name
Industry Group |
PRICE |
CHANGE
(%Change) |
Day High |
Volume
(% DAV)
(% 50 day avg vol) |
52 Wk Hi
% From Hi |
Featured
Date |
Price
Featured |
Pivot Featured |
|
Max Buy |
RAX
-
NYSE
Rackspace Hosting Inc
INTERNET - Internet Software and; Services
|
$41.81
|
-0.60
-1.41% |
$42.48
|
1,620,013
100.10% of 50 DAV
50 DAV is 1,618,400
|
$46.50
-10.08%
|
3/16/2011
|
$36.28
|
PP = $40.72
|
|
MB = $42.76
|
Most Recent Note - 5/3/2011 3:55:27 PM
G - Down today on higher volume indicative of distributional pressure, pulling back from its all-time high. Due to report earnings news. Prior highs near $40 define support along with its 50 DMA line.
>>> The latest Featured Stock Update with an annotated graph appeared on 4/18/2011. Click here.
View all notes |
Alert me of new notes |
CANSLIM.net Company Profile |
SEC |
Zacks Reports |
StockTalk |
News |
Chart |
Request a new note
C
A N
S L
I M
|
TIBX
-
NASDAQ
Tibco Software Inc
COMPUTER SOFTWARE and SERVICES - Business Software and Services
|
$27.67
|
-1.34
-4.62% |
$28.97
|
3,977,585
157.62% of 50 DAV
50 DAV is 2,523,600
|
$30.45
-9.13%
|
3/18/2011
|
$23.88
|
PP = $26.04
|
|
MB = $27.34
|
Most Recent Note - 5/4/2011 1:47:47 PM
G - Pulling back from its all-time high today with a 3rd consecutive loss. Prior highs and its 50 DMA line define chart support near the $26 level.
>>> The latest Featured Stock Update with an annotated graph appeared on 4/14/2011. Click here.
View all notes |
Alert me of new notes |
CANSLIM.net Company Profile |
SEC |
Zacks Reports |
StockTalk |
News |
Chart |
Request a new note
C
A N
S L
I M
|
ULTA
-
NASDAQ
Ulta Salon Cosm & Frag
SPECIALTY RETAIL - Specialty Retail, Other
|
$53.07
|
+0.67
1.28% |
$53.54
|
642,240
104.75% of 50 DAV
50 DAV is 613,100
|
$53.99
-1.70%
|
1/6/2011
|
$36.12
|
PP = $37.34
|
|
MB = $39.21
|
Most Recent Note - 5/4/2011 2:24:41 PM
G - Hovering near its all-time high, extended from any sound base pattern. Its 50 DMA line defines chart support to watch well above prior highs.
>>> The latest Featured Stock Update with an annotated graph appeared on 4/28/2011. Click here.
View all notes |
Alert me of new notes |
CANSLIM.net Company Profile |
SEC |
Zacks Reports |
StockTalk |
News |
Chart |
Request a new note
C
A N
S L
I M
|
|
|
|
THESE ARE NOT BUY RECOMMENDATIONS!
Comments contained in the body of this report are technical
opinions only. The material herein has been obtained
from sources believed to be reliable and accurate, however,
its accuracy and completeness cannot be guaranteed.
This site is not an investment advisor, hence it does
not endorse or recommend any securities or other investments.
Any recommendation contained in this report may not
be suitable for all investors and it is not to be deemed
an offer or solicitation on our part with respect to
the purchase or sale of any securities. All trademarks,
service marks and trade names appearing in this report
are the property of their respective owners, and are
likewise used for identification purposes only.
This report is a service available
only to active Paid Premium Members.
You may opt-out of receiving report notifications
at any time. Questions or comments may be submitted
by writing to Premium Membership Services 665 S.E. 10 Street, Suite 201 Deerfield Beach, FL 33441-5634 or by calling 1-800-965-8307
or 954-785-1121.
|
|
|

