You are not logged in.
This means you
CAN ONLY VIEW reports that were published prior to Tuesday, April 15, 2025.
You
MUST UPGRADE YOUR MEMBERSHIP if you want to see any current reports.
AFTER MARKET UPDATE - THURSDAY, MAY 5TH, 2011
Previous After Market Report Next After Market Report >>>
|
|
|
|
DOW |
-139.41 |
12,584.17 |
-1.10% |
|
Volume |
1,122,549,170 |
+3% |
|
Volume |
2,167,323,370 |
-0% |
|
NASDAQ |
-13.51 |
2,814.72 |
-0.48% |
|
Advancers |
1,136 |
36% |
|
Advancers |
1,003 |
37% |
|
S&P 500 |
-12.22 |
1,335.10 |
-0.91% |
|
Decliners |
1,878 |
60% |
|
Decliners |
1,587 |
58% |
|
Russell 2000 |
-3.66 |
829.24 |
-0.44% |
|
52 Wk Highs |
100 |
|
|
52 Wk Highs |
47 |
|
|
S&P 600 |
-1.63 |
442.32 |
-0.37% |
|
52 Wk Lows |
36 |
|
|
52 Wk Lows |
52 |
|
|
 |
Major Averages Continue Retreat While US Dollar Rallies
Kenneth J. Gruneisen - Passed the CAN SLIM® Master's Exam
The major averages ended lower again on Thursday. Declining issues beat advancers by about 5-3 on both the NYSE and the Nasdaq. Volume was reported higher than the prior session total on the NYSE and near the prior day's total on the Nasdaq exchange. The bias remained clearly negative as distributional pressure continued to cause technical damage. New 52-week highs outnumbered new 52-week lows on the NYSE, but on the Nasdaq exchange new lows trumped new highs. There were 29 high-ranked companies from the CANSLIM.net Leaders List that made new 52-week highs and appeared on the CANSLIM.net BreakOuts Page, up slightly from the total of 23 on the prior session. On the Featured Stocks Page there were gains from 11 of 18 the high-ranked market leaders currently listed. Recent commentaries have repeatedly observed, "New set-ups with strong characteristics and fresh breakouts from high-ranked leaders have been scarce in recent weeks, even while the major averages have rallied."
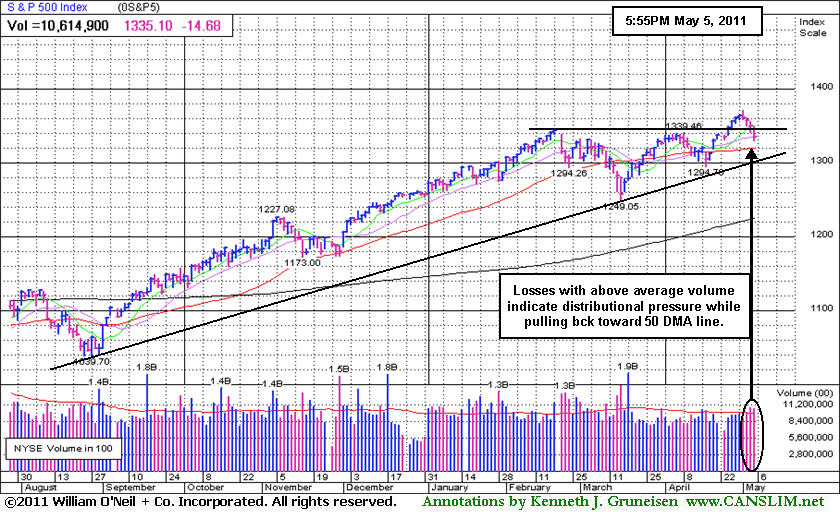
Stock averages and commodity prices dropped sharply today after a disappointing employment report raised concerns that economic growth and demand for fuel will decline. A report on jobless claims set the tone for the day. Initial claims soared by 43,000 to 474,000 in the week ended April 30. It was the highest total for initial jobless claims since August. Meanwhile, the President of the European Central Bank signaled there will be no interest rate hike in Europe in June, as many had expected.
The dollar gained the most against the euro in eight months. A strengthening dollar added to the negative tones in precious metals and other commodities. The price of oil tumbled over $9 per barrel, and closed in New York below $100 for the first time since March 17. Silver extended its biggest slump since 1983. The most active gold contract fell -2.2%.
Transportation stocks' gains kept the major averages from suffering even deeper losses on Thursday. Airlines and truck companies gained on the prospect of lower fuel prices.
The newspaper has described the conditions concerning the M criteria as an "uptrend under pressure" after recent market weakness. This does not mean to run out and sell every stock you own, however, when the market is under pressure, it is not considered the best time to be entering new positions. Pundits have said that valuations are an increasing concern after last week's rally lifted the benchmark S&P 500 Index close to a three-year high. Last week the Nasdaq Composite Index had finally topped its October 2007 high. The S&P Mid-Cap 400 Index and S&P Small-Cap 600 Index both are consolidating after having rallied to all-time highs.
The May 2011 issue of CANSLIM.net News was just released! CANSLIM.net News includes a comprehensive summary of market action, leading industry groups, the most action-worthy leaders, and more. Only upgraded members can access CANSLIM.net News.
PICTURED: The S&P 500 Index's recent losses with above average volume are indicative of distributional pressure. Since institutional investors have recently shown a bias toward dumping stocks, this serves as a reminder for investors to always stand ready to lock in gains, selling stocks on a case-by-case basis whenever technical deterioration raises concerns.
|
 Kenneth J. Gruneisen started out as a licensed stockbroker in August 1987, a couple of months prior to the historic stock market crash that took the Dow Jones Industrial Average down -22.6% in a single day. He has published daily fact-based fundamental and technical analysis on high-ranked stocks online for two decades. Through FACTBASEDINVESTING.COM, Kenneth provides educational articles, news, market commentary, and other information regarding proven investment systems that work in good times and bad.
Comments contained in the body of this report are technical opinions only and are not necessarily those of Gruneisen Growth Corp. The material herein has been obtained from sources believed to be reliable and accurate, however, its accuracy and completeness cannot be guaranteed. Our firm, employees, and customers may effect transactions, including transactions contrary to any recommendation herein, or have positions in the securities mentioned herein or options with respect thereto. Any recommendation contained in this report may not be suitable for all investors and it is not to be deemed an offer or solicitation on our part with respect to the purchase or sale of any securities. |
|
 |
Commodity-Linked Groups Punished With More Losses
Kenneth J. Gruneisen - Passed the CAN SLIM® Master's Exam
Commodity-linked groups were punished Worth large losses again as the Gold & Silver Index ($XAU -3.43%), and Integrated Oil Index ($XOI -2.50%), and Oil Services Index ($OSX -1.95%) led the market lower. Financial shares also created a drag on the market and the Bank Index ($BKX -1.33%) and Broker/Dealer Index ($XBD -0.69%) added more worrisome losses to their ongoing slumps. The Retail Index ($RLX -0.08%) was quiet, and the Internet Index ($IIX +0.02%) and Semiconductor Index ($SOX +0.15%) both inched higher while the Networking Index ($NWX +0.48%) was a standout gainer. The Biotechnology Index ($BTK -1.14%) lagged other tech indexes while the Healthcare Index ($HMO +0.29%) made limited progress.
Charts courtesy www.stockcharts.com
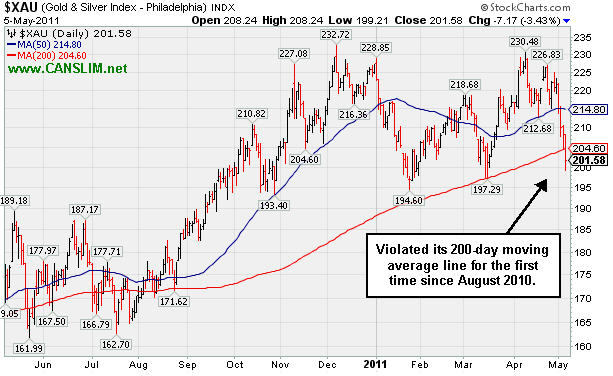
PICTURED: The Gold & Silver Index ($XAU -3.43%) violated its 200-day moving average (DMA) line for the first time since August 2010.
| Oil Services |
$OSX |
261.88 |
-5.21 |
-1.95% |
+6.84% |
| Healthcare |
$HMO |
2,302.00 |
+6.74 |
+0.29% |
+36.05% |
| Integrated Oil |
$XOI |
1,301.69 |
-33.41 |
-2.50% |
+7.30% |
| Semiconductor |
$SOX |
440.35 |
+0.65 |
+0.15% |
+6.93% |
| Networking |
$NWX |
327.81 |
+1.57 |
+0.48% |
+16.84% |
| Internet |
$IIX |
320.74 |
+0.06 |
+0.02% |
+4.23% |
| Broker/Dealer |
$XBD |
118.03 |
-0.82 |
-0.69% |
-2.87% |
| Retail |
$RLX |
539.89 |
-0.41 |
-0.08% |
+6.20% |
| Gold & Silver |
$XAU |
201.58 |
-7.17 |
-3.43% |
-11.03% |
| Bank |
$BKX |
50.63 |
-0.68 |
-1.33% |
-3.03% |
| Biotech |
$BTK |
1,441.79 |
-16.66 |
-1.14% |
+11.11% |
|
|
|
 |
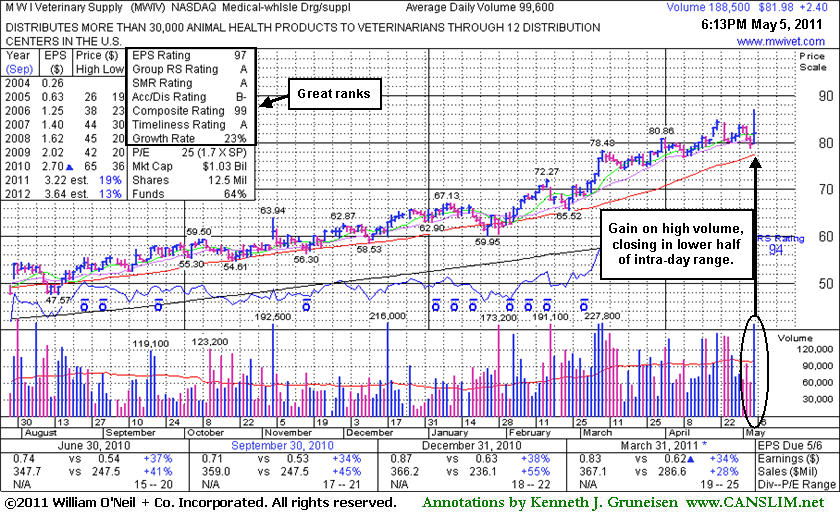
Spike to New High on Latest Strong Earnings Release
Kenneth J. Gruneisen - Passed the CAN SLIM® Master's Exam
M W I Veterinary Supply (MWIV +$2.40 or +3.02% to $81.98) posted a gain today with high volume, but closed in the lower half of its intra-day range after spiking to a new all-time high. It reported earnings +34% on +28% sales revenues for the quarter ended March 31st versus the year ago period. It has been noted as extended from any sound base pattern. Its 50-day moving average (DMA) line defines important support to watch on pullbacks.
Since its last appearance in this FSU section with an annotated graph on 4/08/11 under the headline, "Strength Continues But No Sound Base Has Formed", it made progress into new high territory, but also endured distributional pressure. It has been a long time since a sound base was formed. Disciplined investors would watch for a new base to form and wait for market conditions to signal that odds are more favorable. Sales revenues acceleration (bigger percentage increases sequentially, +34%, +41%, +45% and +55% in the Mar, Jun, Sep, and Dec '10 quarterly comparisons versus the year earlier) was noted as a very reassuring sign. The +28% sales increase in the latest period (Mar '11) still was very strong, but it broke the sequential streak of bigger sales increases. The acceleration suggests increasing demand for the company's products, which, along with the price hitting new highs, solidly satisfies the N criteria.
Its solid quarterly and annual earnings history satisfies the C and A criteria. Its small supply (S criteria) of only 12.5 million shares outstanding could contribute to greater volatility in the event of institutional buying or selling. The number of top-rated funds owning its shares rose from 255 in Mar '10 to 272 in Mar '11, a reassuring sign of support from the institutional (I criteria) crowd. From $52.05 when first featured in yellow on 7/29/10 it has now traded +67.1% higher. Patient investors may watch for it to eventually form a sound new base or look to accumulate shares at a secondary buy point when and if such circumstances should be noted.
|
|
|
Color Codes Explained :
Y - Better candidates highlighted by our
staff of experts.
G - Previously featured
in past reports as yellow but may no longer be buyable under the
guidelines.
***Last / Change / Volume data in this table is the closing quote data***
Symbol/Exchange
Company Name
Industry Group |
PRICE |
CHANGE
(%Change) |
Day High |
Volume
(% DAV)
(% 50 day avg vol) |
52 Wk Hi
% From Hi |
Featured
Date |
Price
Featured |
Pivot Featured |
|
Max Buy |
AIXG
-
NASDAQ
Aixtron Se
ELECTRONICS - Semiconductor Equipment andamp; Mate
|
$39.37
|
-1.60
-3.91% |
$39.98
|
649,137
250.05% of 50 DAV
50 DAV is 259,600
|
$44.96
-12.43%
|
4/5/2011
|
$44.14
|
PP = $44.64
|
|
MB = $46.87
|
 Most Recent Note - 5/5/2011 6:34:41 PM
G - Gapped down today for a loss on even heavier volume, slumping further below its 50 DMA line and finishing near prior chart lows in the $38 area defining support. More damaging losses would raise greater concerns. It faces overhead supply up through the $45 level.
>>> The latest Featured Stock Update with an annotated graph appeared on 4/5/2011. Click here.
View all notes |
Alert me of new notes |
CANSLIM.net Company Profile |
SEC |
Zacks Reports |
StockTalk |
News |
Chart |
Request a new note
C
A N
S L
I M


|
BIDU
-
NASDAQ
Baidu Inc Ads
INTERNET - Internet Information Providers
|
$140.19
|
+1.18
0.85% |
$142.48
|
7,572,680
97.88% of 50 DAV
50 DAV is 7,736,800
|
$156.04
-10.16%
|
3/17/2011
|
$121.97
|
PP = $131.73
|
|
MB = $138.32
|
Most Recent Note - 5/5/2011 6:36:16 PM
G - Gain on very quiet volume today halted its slide just above its 50 DMA line today. Recent losses on heavy volume marked worrisome distributional action while pulling back. Prior high near $131 defines additional support to watch below its short-term average.
>>> The latest Featured Stock Update with an annotated graph appeared on 4/7/2011. Click here.
View all notes |
Alert me of new notes |
CANSLIM.net Company Profile |
SEC |
Zacks Reports |
StockTalk |
News |
Chart |
Request a new note
C
A N
S L
I M
|
CMG
-
NYSE
Chipotle Mexican Grill
LEISURE - Restaurants
|
$265.77
|
+5.24
2.01% |
$269.08
|
1,076,385
92.87% of 50 DAV
50 DAV is 1,159,000
|
$289.35
-8.15%
|
4/1/2011
|
$274.00
|
PP = $275.10
|
|
MB = $288.86
|
Most Recent Note - 5/5/2011 6:37:46 PM
G - Gain on light volume today after a positive reversal on 5/04/11 near its 50 DMA line. It recently negated its latest technical breakout, and it is now perched -8% off its 52-week high.
>>> The latest Featured Stock Update with an annotated graph appeared on 4/13/2011. Click here.
View all notes |
Alert me of new notes |
CANSLIM.net Company Profile |
SEC |
Zacks Reports |
StockTalk |
News |
Chart |
Request a new note
C
A N
S L
I M
|
CTSH
-
NASDAQ
Cognizant Tech Sol Cl A
COMPUTER SOFTWARE and SERVICES - Business Software and Services
|
$76.52
|
-0.75
-0.97% |
$78.04
|
3,115,337
125.49% of 50 DAV
50 DAV is 2,482,500
|
$83.48
-8.34%
|
2/7/2011
|
$75.09
|
PP = $76.46
|
|
MB = $80.28
|
Most Recent Note - 5/4/2011 8:09:39 PM
G - Small loss on above average volume today after a 5/03/11 gap down violating its 50 DMA line triggered a technical sell signal following earnings news. Increased earnings +34% on +43% sales revenues for the quarter ended March 31, 2011 versus the year ago period.
>>> The latest Featured Stock Update with an annotated graph appeared on 4/15/2011. Click here.
View all notes |
Alert me of new notes |
CANSLIM.net Company Profile |
SEC |
Zacks Reports |
StockTalk |
News |
Chart |
Request a new note
C
A N
S L
I M
|
EZPW
-
NASDAQ
Ezcorp Inc Cl A
SPECIALTY RETAIL - Specialty Retail, Other
|
$29.66
|
-0.16
-0.54% |
$30.26
|
297,310
80.68% of 50 DAV
50 DAV is 368,500
|
$33.08
-10.34%
|
2/18/2011
|
$27.94
|
PP = $30.04
|
|
MB = $31.54
|
Most Recent Note - 5/4/2011 2:17:46 PM
G - Slumping near its 50 DMA line again. After negating its recent breakout it has not formed a sound new base pattern.
>>> The latest Featured Stock Update with an annotated graph appeared on 4/11/2011. Click here.
View all notes |
Alert me of new notes |
CANSLIM.net Company Profile |
SEC |
Zacks Reports |
StockTalk |
News |
Chart |
Request a new note
C
A N
S L
I M
|
Symbol/Exchange
Company Name
Industry Group |
PRICE |
CHANGE
(%Change) |
Day High |
Volume
(% DAV)
(% 50 day avg vol) |
52 Wk Hi
% From Hi |
Featured
Date |
Price
Featured |
Pivot Featured |
|
Max Buy |
FOSL
-
NASDAQ
Fossil Inc
CONSUMER DURABLES - Recreational Goods, Other
|
$93.11
|
+1.41
1.54% |
$93.63
|
625,651
72.69% of 50 DAV
50 DAV is 860,700
|
$96.99
-4.00%
|
2/1/2011
|
$73.30
|
PP = $74.44
|
|
MB = $78.16
|
Most Recent Note - 5/4/2011 2:27:32 PM
G - It could produce more climactic gains, but it is extended from any sound base. It is consolidating in a healthy manner above its 50 DMA line and prior chart highs defining support. See latest FSU analysis for more details and a new annotated graph.
>>> The latest Featured Stock Update with an annotated graph appeared on 5/2/2011. Click here.
View all notes |
Alert me of new notes |
CANSLIM.net Company Profile |
SEC |
Zacks Reports |
StockTalk |
News |
Chart |
Request a new note
C
A N
S L
I M
|
HMSY
-
NASDAQ
H M S Holdings Corp
COMPUTER SOFTWARE and SERVICES - Healthcare Information Service
|
$75.45
|
+0.36
0.48% |
$76.18
|
270,905
152.71% of 50 DAV
50 DAV is 177,400
|
$84.82
-11.05%
|
11/19/2010
|
$61.89
|
PP = $63.01
|
|
MB = $66.16
|
Most Recent Note - 5/4/2011 8:16:06 PM
G - Closed in the lower half of its intra-day range today with a 4th consecutive loss with above average volume Violated its 50 DMA line last week with a loss on heavy volume triggering a technical sell signal. Reported earnings +26% on +27% sales revenues for the quarter ended March 31, 2011 versus the year ago period.
>>> The latest Featured Stock Update with an annotated graph appeared on 4/26/2011. Click here.
View all notes |
Alert me of new notes |
CANSLIM.net Company Profile |
SEC |
Zacks Reports |
StockTalk |
News |
Chart |
Request a new note
C
A N
S L
I M
|
HS
-
NYSE
Healthspring Inc
HEALTH SERVICES - Health Care Plans
|
$42.09
|
+0.60
1.45% |
$42.43
|
818,968
88.94% of 50 DAV
50 DAV is 920,800
|
$44.37
-5.14%
|
3/22/2011
|
$38.29
|
PP = $38.85
|
|
MB = $40.79
|
Most Recent Note - 5/4/2011 2:20:30 PM
G - Pulling back today on lighter volume, slumping toward prior highs after volume-driven gains. Its 50 DMA line defines important chart support.
>>> The latest Featured Stock Update with an annotated graph appeared on 4/21/2011. Click here.
View all notes |
Alert me of new notes |
CANSLIM.net Company Profile |
SEC |
Zacks Reports |
StockTalk |
News |
Chart |
Request a new note
C
A N
S L
I M
|
INFA
-
NASDAQ
Informatica Corp
COMPUTER SOFTWARE and SERVICES - Business Software and Services
|
$51.53
|
-0.12
-0.23% |
$52.65
|
845,416
80.71% of 50 DAV
50 DAV is 1,047,500
|
$56.49
-8.78%
|
3/24/2011
|
$50.04
|
PP = $49.86
|
|
MB = $52.35
|
Most Recent Note - 5/4/2011 8:13:37 PM
G - Down again today with above average volume indicative of distributional pressure following a negative reversal on 5/02/11 after touching a new 52-week high. Pulling back near prior highs in the $49 area and its 50 DMA line defining important support to watch.
>>> The latest Featured Stock Update with an annotated graph appeared on 4/27/2011. Click here.
View all notes |
Alert me of new notes |
CANSLIM.net Company Profile |
SEC |
Zacks Reports |
StockTalk |
News |
Chart |
Request a new note
C
A N
S L
I M
|
LULU
-
NASDAQ
Lululemon Athletica
MANUFACTURING - Textile Manufacturing
|
$93.99
|
+0.76
0.82% |
$95.99
|
1,432,590
62.68% of 50 DAV
50 DAV is 2,285,600
|
$102.83
-8.60%
|
3/28/2011
|
$68.11
|
PP = $85.38
|
|
MB = $89.65
|
Most Recent Note - 5/3/2011 6:55:30 PM
G - Down again today, with higher volume indicative of distributional pressure. This high-ranked Retail-Apparel firm has been noted as extended from any sound base pattern. Prior highs and its 50 DMA line in the $85 area define important chart support to watch. See the latest FSU analysis for more details and a new annotated graph.
>>> The latest Featured Stock Update with an annotated graph appeared on 5/3/2011. Click here.
View all notes |
Alert me of new notes |
CANSLIM.net Company Profile |
SEC |
Zacks Reports |
StockTalk |
News |
Chart |
Request a new note
C
A N
S L
I M
|
Symbol/Exchange
Company Name
Industry Group |
PRICE |
CHANGE
(%Change) |
Day High |
Volume
(% DAV)
(% 50 day avg vol) |
52 Wk Hi
% From Hi |
Featured
Date |
Price
Featured |
Pivot Featured |
|
Max Buy |
MG
-
NYSE
Mistras Group Inc
DIVERSIFIED SERVICES - Bulding and Faci;ity Management Services
|
$16.00
|
-0.34
-2.08% |
$16.23
|
366,074
275.66% of 50 DAV
50 DAV is 132,800
|
$18.46
-13.33%
|
3/15/2011
|
$15.48
|
PP = $15.90
|
|
MB = $16.70
|
Most Recent Note - 5/5/2011 6:42:13 PM
G - It closed -13% off its 52-week high, down again today for a 3rd consecutive loss with above average volume since 5/02/11 news of a new Public Offering. The shares were priced at $16.00.
>>> The latest Featured Stock Update with an annotated graph appeared on 4/12/2011. Click here.
View all notes |
Alert me of new notes |
CANSLIM.net Company Profile |
SEC |
Zacks Reports |
StockTalk |
News |
Chart |
Request a new note
C
A N
S L
I M
|
MWIV
-
NASDAQ
M W I Veterinary Supply
HEALTH SERVICES - Medical Instruments and; Supplies
|
$81.98
|
+2.40
3.02% |
$86.99
|
189,961
190.72% of 50 DAV
50 DAV is 99,600
|
$84.97
-3.52%
|
11/4/2010
|
$61.79
|
PP = $59.60
|
|
MB = $62.58
|
Most Recent Note - 5/5/2011 6:44:07 PM
G - Hit a new all-time high today but closed in the lower half of its intra-day range. Reported earnings +34% on +28% sales for the quarter ended March 31st. Extended from any sound base pattern now. Its 50 DMA line defines important support to watch. See the latest FSU analysis for more details and a new annotated graph.
>>> The latest Featured Stock Update with an annotated graph appeared on 5/5/2011. Click here.
View all notes |
Alert me of new notes |
CANSLIM.net Company Profile |
SEC |
Zacks Reports |
StockTalk |
News |
Chart |
Request a new note
C
A N
S L
I M
|
OPEN
-
NASDAQ
Opentable Inc
INTERNET - Internet Software and Services
|
$90.98
|
+1.63
1.82% |
$92.88
|
1,909,206
142.88% of 50 DAV
50 DAV is 1,336,200
|
$118.66
-23.33%
|
3/17/2011
|
$90.71
|
PP = $96.07
|
|
MB = $100.87
|
Most Recent Note - 5/5/2011 6:47:18 PM
G - Held its ground today after damaging violations of its 50 DMA line and recent lows triggered technical sell signals. Reported earnings +87% on +59% sales revenues for the quarter ended March 31, 2011 versus the year ago period.
>>> The latest Featured Stock Update with an annotated graph appeared on 4/25/2011. Click here.
View all notes |
Alert me of new notes |
CANSLIM.net Company Profile |
SEC |
Zacks Reports |
StockTalk |
News |
Chart |
Request a new note
C
A N
S L
I M
|
PAY
-
NYSE
Verifone Systems Inc
COMPUTER HARDWARE - Transaction Automation Systems
|
$49.10
|
+0.12
0.24% |
$50.36
|
2,794,157
111.99% of 50 DAV
50 DAV is 2,495,000
|
$58.88
-16.61%
|
4/29/2011
|
$54.73
|
PP = $58.98
|
|
MB = $61.93
|
Most Recent Note - 5/5/2011 6:48:26 PM
G - Halted its slide today after damaging volume-driven losses this week violated its 50 DMA line and prior lows triggering technical sell signals. See the latest FSU analysis for more details and a new annotated graph.
>>> The latest Featured Stock Update with an annotated graph appeared on 5/4/2011. Click here.
View all notes |
Alert me of new notes |
CANSLIM.net Company Profile |
SEC |
Zacks Reports |
StockTalk |
News |
Chart |
Request a new note
C
A N
S L
I M
|
PCLN
-
NASDAQ
Priceline.Com Inc
INTERNET - Internet Software and Services
|
$533.97
|
-3.59
-0.67% |
$545.50
|
2,250,856
188.39% of 50 DAV
50 DAV is 1,194,800
|
$561.88
-4.97%
|
1/3/2011
|
$399.55
|
PP = $428.20
|
|
MB = $449.61
|
Most Recent Note - 5/5/2011 6:51:54 PM
G - Reported earnings +56% on +38% sales revenues fore the quarter ended March 31, 2011 versus the year ago period. Small loss on heavy volume leaves it perched only -5% off its 52-week high. It may go on to produce more climactic gains, yet it has been repeatedly noted - "Extended from any sound base pattern. Its 50 DMA line has defined support throughout its advance."
>>> The latest Featured Stock Update with an annotated graph appeared on 4/20/2011. Click here.
View all notes |
Alert me of new notes |
CANSLIM.net Company Profile |
SEC |
Zacks Reports |
StockTalk |
News |
Chart |
Request a new note
C
A N
S L
I M
|
Symbol/Exchange
Company Name
Industry Group |
PRICE |
CHANGE
(%Change) |
Day High |
Volume
(% DAV)
(% 50 day avg vol) |
52 Wk Hi
% From Hi |
Featured
Date |
Price
Featured |
Pivot Featured |
|
Max Buy |
RAX
-
NYSE
Rackspace Hosting Inc
INTERNET - Internet Software and; Services
|
$42.05
|
+0.24
0.57% |
$43.22
|
1,226,740
75.00% of 50 DAV
50 DAV is 1,635,700
|
$46.50
-9.56%
|
3/16/2011
|
$36.28
|
PP = $40.72
|
|
MB = $42.76
|
Most Recent Note - 5/3/2011 3:55:27 PM
G - Down today on higher volume indicative of distributional pressure, pulling back from its all-time high. Due to report earnings news. Prior highs near $40 define support along with its 50 DMA line.
>>> The latest Featured Stock Update with an annotated graph appeared on 4/18/2011. Click here.
View all notes |
Alert me of new notes |
CANSLIM.net Company Profile |
SEC |
Zacks Reports |
StockTalk |
News |
Chart |
Request a new note
C
A N
S L
I M
|
TIBX
-
NASDAQ
Tibco Software Inc
COMPUTER SOFTWARE and SERVICES - Business Software and Services
|
$27.56
|
-0.11
-0.40% |
$28.19
|
2,869,310
111.62% of 50 DAV
50 DAV is 2,570,500
|
$30.45
-9.49%
|
3/18/2011
|
$23.88
|
PP = $26.04
|
|
MB = $27.34
|
Most Recent Note - 5/4/2011 1:47:47 PM
G - Pulling back from its all-time high today with a 3rd consecutive loss. Prior highs and its 50 DMA line define chart support near the $26 level.
>>> The latest Featured Stock Update with an annotated graph appeared on 4/14/2011. Click here.
View all notes |
Alert me of new notes |
CANSLIM.net Company Profile |
SEC |
Zacks Reports |
StockTalk |
News |
Chart |
Request a new note
C
A N
S L
I M
|
ULTA
-
NASDAQ
Ulta Salon Cosm & Frag
SPECIALTY RETAIL - Specialty Retail, Other
|
$53.13
|
+0.06
0.11% |
$54.22
|
659,320
107.96% of 50 DAV
50 DAV is 610,700
|
$53.99
-1.59%
|
1/6/2011
|
$36.12
|
PP = $37.34
|
|
MB = $39.21
|
Most Recent Note - 5/4/2011 2:24:41 PM
G - Hovering near its all-time high, extended from any sound base pattern. Its 50 DMA line defines chart support to watch well above prior highs.
>>> The latest Featured Stock Update with an annotated graph appeared on 4/28/2011. Click here.
View all notes |
Alert me of new notes |
CANSLIM.net Company Profile |
SEC |
Zacks Reports |
StockTalk |
News |
Chart |
Request a new note
C
A N
S L
I M
|
|
|
|
THESE ARE NOT BUY RECOMMENDATIONS!
Comments contained in the body of this report are technical
opinions only. The material herein has been obtained
from sources believed to be reliable and accurate, however,
its accuracy and completeness cannot be guaranteed.
This site is not an investment advisor, hence it does
not endorse or recommend any securities or other investments.
Any recommendation contained in this report may not
be suitable for all investors and it is not to be deemed
an offer or solicitation on our part with respect to
the purchase or sale of any securities. All trademarks,
service marks and trade names appearing in this report
are the property of their respective owners, and are
likewise used for identification purposes only.
This report is a service available
only to active Paid Premium Members.
You may opt-out of receiving report notifications
at any time. Questions or comments may be submitted
by writing to Premium Membership Services 665 S.E. 10 Street, Suite 201 Deerfield Beach, FL 33441-5634 or by calling 1-800-965-8307
or 954-785-1121.
|
|
|

