***Last / Change / Volume quote data in this table corresponds with the timestamp on the note***
Symbol/Exchange
Company Name
Industry Group |
Last |
Chg. |
Vol
% DAV |
Date Featured |
Price Featured |
Latest Pivot Point
Featured |
Status |
| Latest Max Buy Price |
AMZN
- NASDAQ
Amazon.com Inc
INTERNET - Internet Software & Services
|
$129.83
|
-7.66
|
12,559,746
168% DAV
7,495,700
|
4/23/2010
(Date
Featured) |
$144.41
(Price
Featured) |
PP = $146.01 |
G |
| MB = $153.31 |
Most Recent Note - 5/4/2010 4:10:33 PM
G - Gapped down today and quickly violated its 50 DMA line with a considerable loss, raising concerns and triggering a technical sell signal. Broader market action (M criteria) is normally expected to impact 3 out of 4 stocks, and widespread losses are adding to concerns about the current rally's tenacity. AMZN was featured in the 4/23/10 mid-day report (read here) while it was encountering distributional pressure following strong results for the March 31, 2010 quarter.
>>> The latest Featured Stock Update with an annotated graph appeared on 4/23/2010. click here.
|
|
C
A
S
I |
News |
Chart |
SEC
View all notes Alert
me of new notes
Company
Profile
|
ARUN
- NASDAQ
Aruba Networks Inc
COMPUTER HARDWARE - Networking & Communication Dev
|
$12.03
|
-0.74
|
1,975,856
122% DAV
1,615,900
|
4/29/2010
(Date
Featured) |
$13.23
(Price
Featured) |
PP = $14.12 |
G |
| MB = $14.83 |
Most Recent Note - 5/4/2010 4:12:36 PM
G - Considerable loss today with above average volume undercut prior chart lows, triggering a more worrisome technical sell signal. Broader market action (M criteria) is normally expected to impact 3 out of 4 stocks, and widespread losses are adding to concerns about the current rally's tenacity.
>>> The latest Featured Stock Update with an annotated graph appeared on 4/29/2010. click here.
|
|
C
A
S
I |
News |
Chart |
SEC
View all notes Alert
me of new notes
Company
Profile
|
BIDU
- NASDAQ
Baidu Inc Ads
INTERNET - Internet Information Providers
|
$693.00
|
-15.99
|
1,285,997
84% DAV
1,525,500
|
1/13/2010
(Date
Featured) |
$431.25
(Price
Featured) |
PP = $426.75 |
G |
| MB = $448.09 |
Most Recent Note - 5/4/2010 4:15:05 PM
G - Consolidating on light volume today, closing only -3.5% off its all-time high. Its streak of 13 consecutive weekly gains leaves it very extended from a sound base. Repeatedly noted - "could produce more climactic gains, especially due to the small supply (S criteria) of shares outstanding."
>>> The latest Featured Stock Update with an annotated graph appeared on 4/20/2010. click here.
|
|
C
A
S
I |
News |
Chart |
SEC
View all notes Alert
me of new notes
Company
Profile
|
BPI
- NYSE
Bridgepoint Education
DIVERSIFIED SERVICES - Education &; Training Services
|
$23.67
|
-0.88
|
1,128,481
240% DAV
471,000
|
4/13/2010
(Date
Featured) |
$25.59
(Price
Featured) |
PP = $25.76 |
G |
| MB = $27.05 |
Most Recent Note - 5/4/2010 4:18:49 PM
G - Gappped down today for a 3rd loss marked by heavy volume in the past 4 sessions. Enduring distributional pressure while still consolidating well above its 50 DMA line. The Commercial Services - Schools firm was featured in yellow in the 4/13/10 mid-day report (read here) as rose from a cup-with-high-handle.
>>> The latest Featured Stock Update with an annotated graph appeared on 4/13/2010. click here.
|
|
C
A
S
I |
News |
Chart |
SEC
View all notes Alert
me of new notes
Company
Profile
|
BRLI
- NASDAQ
Bio Reference Labs Inc
HEALTH SERVICES - Medical Laboratories & Researc
|
$23.00
|
-0.61
|
114,550
58% DAV
196,600
|
2/12/2010
(Date
Featured) |
$39.02
(Price
Featured) |
PP = $20.49 |
G |
| MB = $21.51 |
Most Recent Note - 5/4/2010 4:24:15 PM
G - Pulling back near prior chart highs that define initial support above its 50 DMA line. Consolidating quietly after a big winning streak and a 2:1 stock split, it is near its 10-week average. Its weekly chart has recently been marked by many up weeks with above average volume this year.
>>> The latest Featured Stock Update with an annotated graph appeared on 4/16/2010. click here.
|
|
C
A
S
I |
News |
Chart |
SEC
View all notes Alert
me of new notes
Company
Profile
|
CISG
- NASDAQ
Cninsure Inc Ads
INSURANCE - Insurance Brokers
|
$27.56
|
-0.84
|
208,168
82% DAV
255,100
|
3/3/2010
(Date
Featured) |
$24.38
(Price
Featured) |
PP = $23.10 |
Y |
| MB = $24.26 |
Most Recent Note - 5/4/2010 4:26:16 PM
Y - Consolidating near its 52-week high. Its color code was changed to yellow again on 4/29/10, however the prior high is not considered a "pivot point" by definition since it did not form a proper new base.
>>> The latest Featured Stock Update with an annotated graph appeared on 4/19/2010. click here.
|
|
C
A
S
I |
News |
Chart |
SEC
View all notes Alert
me of new notes
Company
Profile
|
CRM
- NYSE
Salesforce.com Inc
INTERNET - Internet Software & Services
|
$86.59
|
-1.13
|
2,270,357
134% DAV
1,690,800
|
3/5/2010
(Date
Featured) |
$72.28
(Price
Featured) |
PP = $75.53 |
G |
| MB = $79.31 |
Most Recent Note - 5/4/2010 4:31:47 PM
G - Churning near its all-time high today, enduring some distributional pressure while closing the session still only -3.3% off its high. Its 50 DMA line (now $78.14) is the nearest chart support level.
>>> The latest Featured Stock Update with an annotated graph appeared on 4/21/2010. click here.
|
|
C
A
S
I |
News |
Chart |
SEC
View all notes Alert
me of new notes
Company
Profile
|
CTRP
- NASDAQ
Ctrip.com Intl Ltd Adr
LEISURE - Resorts & Casinos
|
$36.59
|
-0.44
|
1,774,410
95% DAV
1,875,700
|
3/25/2010
(Date
Featured) |
$40.74
(Price
Featured) |
PP = $39.40 |
G |
| MB = $41.37 |
Most Recent Note - 5/4/2010 4:37:02 PM
G - Hovering below its 50 DMA line, today it closed -13.5% off its high. Violations of its 4/21/10 low ($35.60) and 3/22/10 low ($34.85) would raise more serious concerns and trigger sell signals.
>>> The latest Featured Stock Update with an annotated graph appeared on 4/12/2010. click here.
|
|
C
A
S
I |
News |
Chart |
SEC
View all notes Alert
me of new notes
Company
Profile
|
EZPW
- NASDAQ
Ezcorp Inc Cl A
SPECIALTY RETAIL - Specialty Retail, Other
|
$21.08
|
-0.27
|
492,452
89% DAV
553,600
|
4/14/2010
(Date
Featured) |
$21.80
(Price
Featured) |
PP = $22.29 |
G |
| MB = $23.40 |
Most Recent Note - 5/4/2010 4:38:58 PM
G - Holding its ground near its 50 DMA line since the considerable loss on 4/30/10 triggered technical sell signals. The recent impact of a proposed law has fueled speculation and concern in the industry.
>>> The latest Featured Stock Update with an annotated graph appeared on 4/27/2010. click here.
|
|
C
A
S
I |
News |
Chart |
SEC
View all notes Alert
me of new notes
Company
Profile
|
ISRG
- NASDAQ
Intuitive Surgical Inc
HEALTH SERVICES - Medical Appliances & Equipment
|
$372.22
|
+11.66
|
531,823
93% DAV
572,300
|
4/13/2010
(Date
Featured) |
$363.46
(Price
Featured) |
PP = $367.10 |
Y |
| MB = $385.46 |
Most Recent Note - 5/3/2010 6:06:09 PM
Y - Consolidating quietly in a tight range near its pivot point.and above its 50 DMA line. A subsequent violation of its recent chart low or 50 DMA line could raise more serious concerns and trigger sell signals. ISRG was featured again in the 4/13/10 mid-day report (read here) with new pivot point cited based on its 3/03/10 high.
>>> The latest Featured Stock Update with an annotated graph appeared on 5/3/2010. click here.
|
|
C
A
S
I |
News |
Chart |
SEC
View all notes Alert
me of new notes
Company
Profile
|
LL
- NYSE
Lumber Liquidators Hldgs
RETAIL - Home Improvement Stores
|
$30.07
|
-1.45
|
360,270
86% DAV
418,800
|
4/22/2010
(Date
Featured) |
$29.87
(Price
Featured) |
PP = $29.03 |
G |
| MB = $30.48 |
Most Recent Note - 5/4/2010 4:41:20 PM
G - Consolidating above prior chart highs in the $28 area, its "positive reversal" on 4/28/10 was a recent sign of prompt support. First featured in yellow at $29.87 in the 4/22/10 the mid-day report (read here).
>>> The latest Featured Stock Update with an annotated graph appeared on 4/26/2010. click here.
|
|
C
A
S
I |
News |
Chart |
SEC
View all notes Alert
me of new notes
Company
Profile
|
LOPE
- NASDAQ
Grand Canyon Education
DIVERSIFIED SERVICES - Education &; Training Services
|
$25.03
|
-0.05
|
447,858
118% DAV
378,500
|
4/13/2010
(Date
Featured) |
$27.71
(Price
Featured) |
PP = $27.33 |
G |
| MB = $28.70 |
Most Recent Note - 5/4/2010 4:42:04 PM
G - Holding its ground near its 50 DMA line after a recent streak of 8 consecutive losses. Like many for-profit schools, it encountered distributional pressure in the wake of recently proposed regulatory changes.
>>> The latest Featured Stock Update with an annotated graph appeared on 4/14/2010. click here.
|
|
C
A
S
I |
News |
Chart |
SEC
View all notes Alert
me of new notes
Company
Profile
|
PCLN
- NASDAQ
Priceline.com Inc
INTERNET - Internet Software & Services
|
$399.55
|
-4.72
|
584,812
N/A
|
11/1/2002
(Date
Featured) |
$399.55
(Price
Featured) |
PP = $428.20 |
Y |
| MB = $449.61 |
Most Recent Note - 1/2/2011
Y - Returns to Featured Stocks list with its appearance in the January 2011 CANSLIM.net News including detailed analysis and annotated daily and weekly graphs.
>>> The latest Featured Stock Update with an annotated graph appeared on 4/28/2010. click here.
|
|
C
A
S
I |
News |
Chart |
SEC
View all notes Alert
me of new notes
Company
Profile
|
ROVI
- NASDAQ
Rovi Corp
COMPUTER SOFTWARE & SERVICES - Security Software & Services
|
$37.99
|
-1.15
|
1,153,787
91% DAV
1,265,900
|
4/20/2010
(Date
Featured) |
$37.62
(Price
Featured) |
PP = $38.60 |
Y |
| MB = $40.53 |
Most Recent Note - 5/4/2010 4:46:34 PM
Y - Slumped under its latest pivot point with today's loss on below average volume. Its 50 DMA line and recent chart low ($35.91 on 4/08/10) define important support to watch. Earnings news is due on May 6th.
>>> The latest Featured Stock Update with an annotated graph appeared on 4/8/2010. click here.
|
|
C
A
S
I |
News |
Chart |
SEC
View all notes Alert
me of new notes
Company
Profile
|
SIRO
- NASDAQ
Sirona Dental Systems
HEALTH SERVICES - Medical Instruments & Supplies
|
$42.87
|
+0.60
|
747,341
148% DAV
504,800
|
2/16/2010
(Date
Featured) |
$36.43
(Price
Featured) |
PP = $36.15 |
G |
| MB = $37.96 |
Most Recent Note - 5/4/2010 4:49:41 PM
G - Gain today with above average volume for a new high close before earnings news that is due pre-open on Wednesday, May 5th. Extended from any sound base, its 50 DMA line is an initial support level to watch above its 4/08/10 low ($37.00).
>>> The latest Featured Stock Update with an annotated graph appeared on 4/22/2010. click here.
|
|
C
A
S
I |
News |
Chart |
SEC
View all notes Alert
me of new notes
Company
Profile
|
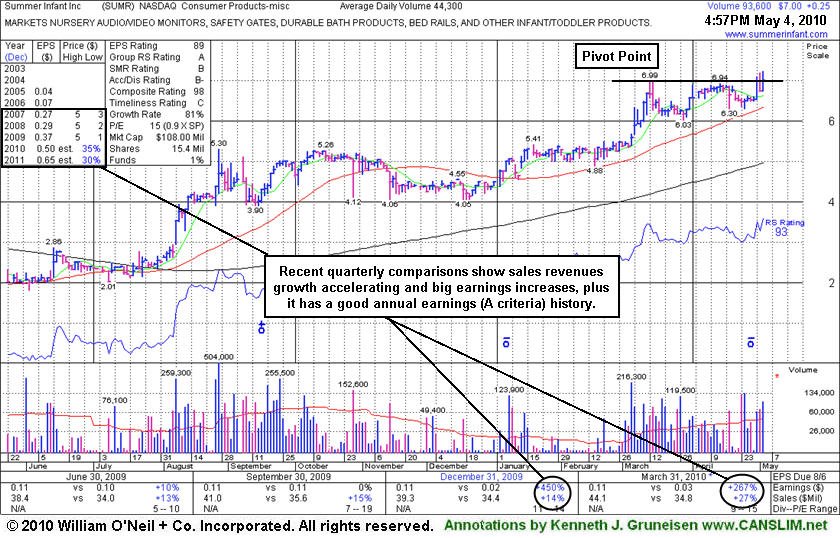
SUMR
- NASDAQ
Summer Infant Inc
CONSUMER NON-DURABLES - Personal Products
|
$7.00
|
+0.25
|
93,562
214% DAV
43,800
|
5/4/2010
(Date
Featured) |
$6.85
(Price
Featured) |
PP = $7.09 |
Y |
| MB = $7.44 |
Most Recent Note - 5/4/2010 4:53:05 PM
Y - Closed the session 2 cents above its best prior close, but not above its pivot point. Featured in the mid-day report (read here) earlier today - "Inching into new high ground this week on the right side of a 7-week flat base above its 50 DMA line and well above prior chart highs in the $5 area. Color code is yellow with pivot point noted based upon its 3/15/10 high plus ten cents. Quarterly earnings (C criteria) in the 2 latest quarterly comparisons showed great increases while sales revenues growth accelerated to +27% in the period ended Mach 31, 2010. It has a good annual earnings (A criteria) history, and a small supply (S criteria) of only 11.0 million shares in the public float. Technically, a gain and strong close above its pivot point with heavy volume would trigger a buy signal."
>>> The latest Featured Stock Update with an annotated graph appeared on 5/4/2010. click here.
|
|
C
A
S
I |
News |
Chart |
SEC
View all notes Alert
me of new notes
Company
Profile
|
ULTA
- NASDAQ
Ulta Salon Cosm & Frag
SPECIALTY RETAIL - Specialty Retail, Other
|
$23.01
|
-0.92
|
254,651
59% DAV
431,100
|
3/12/2010
(Date
Featured) |
$22.81
(Price
Featured) |
PP = $21.72 |
G |
| MB = $22.81 |
Most Recent Note - 5/4/2010 4:55:14 PM
G - Consolidating on quiet volume today, closing only -10.7% off its 52-week high. A subsequent violation of its 50 DMA line or recent chart low $21.66 would trigger damaging technical sell signals.
>>> The latest Featured Stock Update with an annotated graph appeared on 4/30/2010. click here.
|
|
C
A
S
I |
News |
Chart |
SEC
View all notes Alert
me of new notes
Company
Profile
|
VIT
-
|
$24.19
|
-1.25
|
757,802
107% DAV
708,400
|
4/9/2010
(Date
Featured) |
$23.79
(Price
Featured) |
PP = $23.95 |
Y |
| MB = $25.15 |
Most Recent Note - 5/4/2010 4:56:08 PM
Y - Gapped down today for a loss on average volume while consolidating above prior chart highs and its 50 DMA line. Broader market action (M criteria) is normally expected to impact 3 out of 4 stocks, and widespread losses are adding to concerns about the current rally's tenacity.
>>> The latest Featured Stock Update with an annotated graph appeared on 4/9/2010. click here.
|
|
C
A
S
I |
News |
Chart |
SEC
View all notes Alert
me of new notes
Company
Profile
|