You are not logged in.
This means you
CAN ONLY VIEW reports that were published prior to Tuesday, July 9, 2024.
You
MUST UPGRADE YOUR MEMBERSHIP if you want to see any current reports.
AFTER MARKET UPDATE - FRIDAY, MAY 3RD, 2024
Previous After Market Report Next After Market Report >>>
|
|
|
|
DOW |
+450.02 |
38,675.68 |
+1.18% |
|
Volume |
957,864,151 |
-11% |
|
Volume |
4,928,101,400 |
-3% |
|
NASDAQ |
+315.65 |
16,156.60 |
+1.99% |
|
Advancers |
2,085 |
75% |
|
Advancers |
2,796 |
66% |
|
S&P 500 |
+63.59 |
5,127.79 |
+1.26% |
|
Decliners |
698 |
25% |
|
Decliners |
1,453 |
34% |
|
Russell 2000 |
+19.61 |
2,035.72 |
+0.97% |
|
52 Wk Highs |
118 |
|
|
52 Wk Highs |
130 |
|
|
S&P 600 |
+10.09 |
1,301.48 |
+0.78% |
|
52 Wk Lows |
17 |
|
|
52 Wk Lows |
73 |
|
|
Conditions are technically still considered a market "correction" (M criteria), however, Friday's session was marked by a nice expansion in the list of stocks hitting new 52-week highs on both major exchanges while the Nasdaq Composite Index led its peers with a solid +2% gain. Volume was running at an above average pace all day but quieted in the final hour leaving the volume totals just below Thursday's totals at the close. Investors are still cautioned about making new buying efforts until a solid follow-through day marked by higher volume is noted confirming a new uptrend.
|
 |
Breadth Positive as Major Indices Rose With Better Leadership
Kenneth J. Gruneisen - Passed the CAN SLIM® Master's Exam
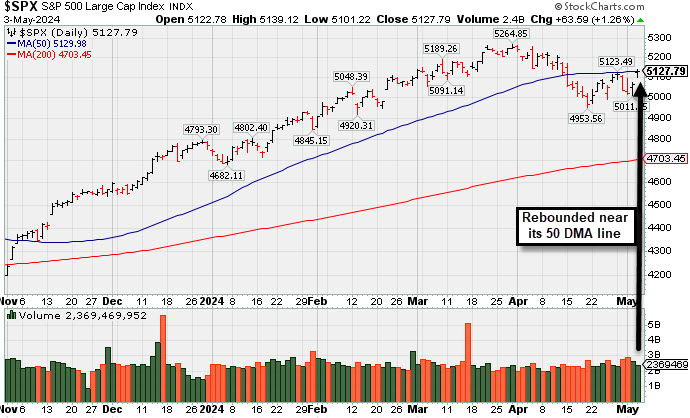
The Nasdaq Composite finished Friday's session +2.0% higher and the S&P 500 (+1.3%) rose to finish just shy of its 50-day moving average (5,129). The Russell 2000 (+1.0%) also ended higher. Volume reported was below the prior session total on the NYSE and on the Nasdaq exchange. Breadth was clearly positive as advancers led decliners by a 3-1 margin on the NYSE and by a 2-1 margin on the Nasdaq exchange. Leadership improved as there were 63 high-ranked companies from the Leaders List that hit new 52-week highs and were listed on the BreakOuts Page versus 38 on the prior session. New 52-week highs totals expanded and outnumbered shrinking new 52-week lows on the NYSE and on the Nasdaq exchange. The major indices recently signaled a market correction (M criteria). Greater caution is important for all investors until a follow-through day signals a new confirmed uptrend.
PICTURED: The S&P 500 Index rose near its 50-day moving average (DMA) line. The window remains open for a follow-through day as long as the Day 1 low is not violated. Monday's session marks Day 11 for the benchmark index's rally attempt.
Only one of the S&P 500 sectors lost ground, the energy sector (-0.1%), meanwhile the information technology (+3.0%), communication services (+1.0%), and materials (+1.0%) sectors led gainers.
A big gain in shares of Apple (AAPL +5.98%) came after reporting better-than-feared quarterly results. It also announced a $110 billion share repurchase program. Amgen (AMGN +11.82%) was a big winner after solid earnings news and a positive trial update for its weight loss drug MariTide. Meanwhile, Expedia (EXPE -15.25%), Fortinet (FTNT -9.69%), Ingersoll-Rand (IR -6.60%), and DaVita (DVA -5.48%) each suffered a big decline after reporting earnings.
The April employment report was weak enough to reduce concerns about a potential rate hike, but not weak enough to invite worries about the state of the labor market. Nonfarm payrolls increased a smaller-than-expected 175,000, average hourly earnings were up a smaller-than-expected 0.2%, the unemployment rate was up a higher-than-expected 3.9%, and the average workweek was a smaller-than-expected 34.3 hours.
Treasury yields moved lower, as the 10-yr note yield declined seven basis points to 4.50% and the 2-yr note yield declined seven basis points to 4.81%.
|
 Kenneth J. Gruneisen started out as a licensed stockbroker in August 1987, a couple of months prior to the historic stock market crash that took the Dow Jones Industrial Average down -22.6% in a single day. He has published daily fact-based fundamental and technical analysis on high-ranked stocks online for two decades. Through FACTBASEDINVESTING.COM, Kenneth provides educational articles, news, market commentary, and other information regarding proven investment systems that work in good times and bad.
Comments contained in the body of this report are technical opinions only and are not necessarily those of Gruneisen Growth Corp. The material herein has been obtained from sources believed to be reliable and accurate, however, its accuracy and completeness cannot be guaranteed. Our firm, employees, and customers may effect transactions, including transactions contrary to any recommendation herein, or have positions in the securities mentioned herein or options with respect thereto. Any recommendation contained in this report may not be suitable for all investors and it is not to be deemed an offer or solicitation on our part with respect to the purchase or sale of any securities. |
|
 |
Semiconductor, Retail, and Financial Indexes Led Group Gainers
Kenneth J. Gruneisen - Passed the CAN SLIM® Master's Exam
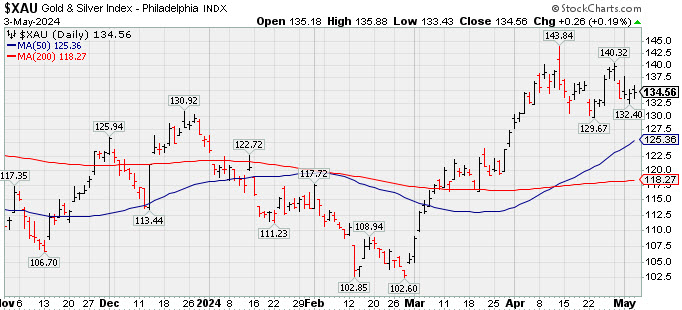
The Retail Index ($RLX +1.01%), Broker/Dealer Index ($XBD +1.21%), and the Bank Index ($BKX +0.83%) each posted a solid gain on Friday. The tech sector was led by the Semiconductor Index ($SOX +2.41%) while the Biotech Index ($BTK +0.77%) posted a smaller gain but the Networking Index ($NWX -0.15%) ended slightly in the red. The Oil Services Index ($OSX +0.57%), Integrated Oil Index ($XOI +0.12%), and the Gold & Silver Index ($XAU +0.19%) each finished the session slightly higher.
![]() PICTURED: The Gold & Silver Index ($XAU +0.19%) posted a 3rd consecutive small gain, consolidating well above its 50-day moving average (DMA) line.
| Oil Services |
$OSX |
85.36 |
+0.48 |
+0.57% |
+1.76% |
| Integrated Oil |
$XOI |
2,106.05 |
+2.62 |
+0.12% |
+13.08% |
| Semiconductor |
$SOX |
4,716.19 |
+110.84 |
+2.41% |
+12.95% |
| Networking |
$NWX |
742.42 |
-1.14 |
-0.15% |
-10.85% |
| Broker/Dealer |
$XBD |
611.83 |
+7.34 |
+1.21% |
+9.79% |
| Retail |
$RLX |
4,442.73 |
+44.23 |
+1.01% |
+14.25% |
| Gold & Silver |
$XAU |
134.56 |
+0.26 |
+0.19% |
+7.05% |
| Bank |
$BKX |
103.22 |
+0.85 |
+0.83% |
+7.50% |
| Biotech |
$BTK |
5,095.79 |
+38.82 |
+0.77% |
-5.96% |
|
|
|
 |
Featured Stocks
Kenneth J. Gruneisen - Passed the CAN SLIM® Master's Exam
|
|
|
Color Codes Explained :
Y - Better candidates highlighted by our
staff of experts.
G - Previously featured
in past reports as yellow but may no longer be buyable under the
guidelines.
***Last / Change / Volume data in this table is the closing quote data***
Symbol/Exchange
Company Name
Industry Group |
PRICE |
CHANGE
(%Change) |
Day High |
Volume
(% DAV)
(% 50 day avg vol) |
52 Wk Hi
% From Hi |
Featured
Date |
Price
Featured |
Pivot Featured |
|
Max Buy |
 AXON
-
NASDAQ
AXON
-
NASDAQ
Axon Enterprise
Security/Sfty
|
$318.55
|
+1.80
0.57% |
$321.00
|
278,915
51.18% of 50 DAV
50 DAV is 545,000
|
$329.87
-3.43%
|
4/5/2024
|
$309.90
|
PP = $325.73
|
|
MB = $342.02
|
 Most Recent Note - 5/3/2024 5:28:21 PM
Y - Posted another small gain today with below-average volume. Recently found prompt support near its 50 DMA line ($308). A gain and strong close above the pivot point backed by at least +40% above average volume is needed to trigger a proper technical buy signal. Fundamentals remain strong.
>>> FEATURED STOCK ARTICLE : Found Support Near 50-Day Moving Average After Recent Stall - 4/29/2024 |
View all notes |
Set NEW NOTE alert |
Company Profile |
SEC
News |
Chart |
Request a new note
C
A
S
I |
TDG
-
NYSE
TransDigm Group
Aerospace/Defense
|
$1,293.80
|
+22.02
1.73% |
$1,303.49
|
233,510
121.62% of 50 DAV
50 DAV is 192,000
|
$1,274.22
1.54%
|
4/12/2024
|
$1,224.21
|
PP = $1,246.32
|
|
MB = $1,308.64
|
Most Recent Note - 5/3/2024 5:30:32 PM
Y - Posted a 3rd consecutive gain today with +24% above-average volume for a new all-time high. New pivot point was cited based on its 4/04/24 high plus 10 cents. Gains above the pivot point backed by at least +40% above average volume are needed to trigger a proper technical buy signal. Its 50 DMA line ($1,211) defines near-term support to watch on pullbacks.
>>> FEATURED STOCK ARTICLE : Found Support at 50-Day Moving Average Line and Hit New High - 4/30/2024 |
View all notes |
Set NEW NOTE alert |
Company Profile |
SEC
News |
Chart |
Request a new note
C
A
S
I |
USLM
-
NASDAQ
U.S. Lime & Minerals
Bldg-Cement/Concrt/Ag
|
$340.19
|
+13.51
4.14% |
$340.64
|
24,883
108.19% of 50 DAV
50 DAV is 23,000
|
$326.68
4.14%
|
2/9/2024
|
$254.68
|
PP = $265.09
|
|
MB = $278.34
|
Most Recent Note - 5/3/2024 5:32:00 PM
G - Posted a 6th consecutive gain today with average volume and again finished near the session high for a new all-time high. Its 50 DMA line ($292.40) and recent lows define near-term support to watch. Bullish action came after it reported Mar '24 quarterly earnings +31% on +7% sales revenues versus the year-ago period.
>>> FEATURED STOCK ARTICLE : Trading in Tight Range Near High - 4/26/2024 |
View all notes |
Set NEW NOTE alert |
Company Profile |
SEC
News |
Chart |
Request a new note
C
A
S
I |
PAY
-
NYSE
Paymentus Holdings
Finance-CrdtCard/PmtPr
|
$21.02
|
+0.00
0.00% |
$21.68
|
311,166
74.80% of 50 DAV
50 DAV is 416,000
|
$25.21
-16.62%
|
3/5/2024
|
$19.97
|
PP = $18.89
|
|
MB = $19.83
|
Most Recent Note - 5/3/2024 5:29:16 PM
G - Posted a 3rd consecutive gain today with below-average volume. Found support above its 50 DMA line ($20.45). Prior highs in the $18 range define the next support. More damaging losses would raise greater concerns.
>>> FEATURED STOCK ARTICLE : Finding Support Near Prior Highs and 50-Day Moving Average - 5/1/2024 |
View all notes |
Set NEW NOTE alert |
Company Profile |
SEC
News |
Chart |
Request a new note
C
A
S
I |
|
|
|
THESE ARE NOT BUY RECOMMENDATIONS!
Comments contained in the body of this report are technical
opinions only. The material herein has been obtained
from sources believed to be reliable and accurate, however,
its accuracy and completeness cannot be guaranteed.
This site is not an investment advisor, hence it does
not endorse or recommend any securities or other investments.
Any recommendation contained in this report may not
be suitable for all investors and it is not to be deemed
an offer or solicitation on our part with respect to
the purchase or sale of any securities. All trademarks,
service marks and trade names appearing in this report
are the property of their respective owners, and are
likewise used for identification purposes only.
This report is a service available
only to active Paid Premium Members.
You may opt-out of receiving report notifications
at any time. Questions or comments may be submitted
by writing to Premium Membership Services 665 S.E. 10 Street, Suite 201 Deerfield Beach, FL 33441-5634 or by calling 1-800-965-8307
or 954-785-1121.
|
|
|