You are not logged in.
This means you
CAN ONLY VIEW reports that were published prior to Monday, April 14, 2025.
You
MUST UPGRADE YOUR MEMBERSHIP if you want to see any current reports.
AFTER MARKET UPDATE - FRIDAY, MAY 2ND, 2014
Previous After Market Report Next After Market Report >>>
|
|
|
|
DOW |
-45.98 |
16,512.89 |
-0.28% |
|
Volume |
683,660,100 |
+0% |
|
Volume |
1,715,708,860 |
-10% |
|
NASDAQ |
-3.55 |
4,123.90 |
-0.09% |
|
Advancers |
1,736 |
55% |
|
Advancers |
1,383 |
49% |
|
S&P 500 |
-2.54 |
1,881.14 |
-0.13% |
|
Decliners |
1,304 |
41% |
|
Decliners |
1,316 |
47% |
|
Russell 2000 |
+2.83 |
1,128.80 |
+0.25% |
|
52 Wk Highs |
126 |
|
|
52 Wk Highs |
43 |
|
|
S&P 600 |
+1.93 |
652.56 |
+0.30% |
|
52 Wk Lows |
17 |
|
|
52 Wk Lows |
60 |
|
|
 |
Major Averages Ended Lower Friday, Up For The Week
Kenneth J. Gruneisen - Passed the CAN SLIM® Master's Exam
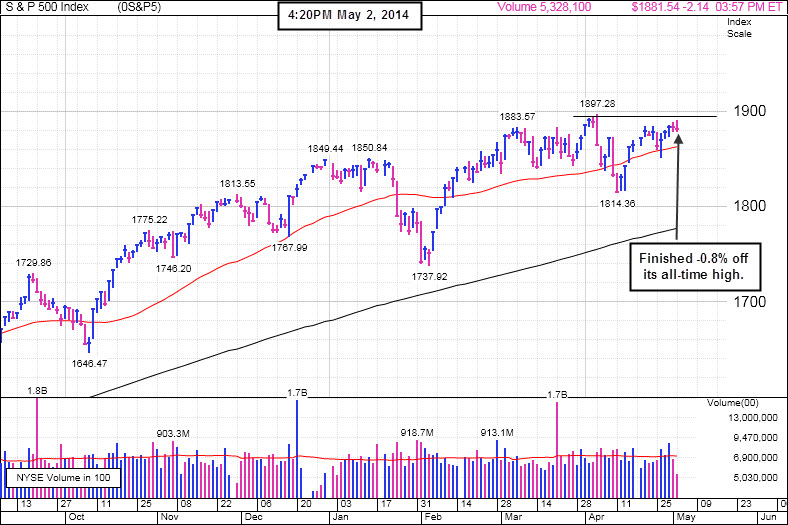
For the week, the Dow was up +0.9% the S&P 500 rose +1% and the NASDAQ advanced +1.2%. The indices finished lower on Friday's session. The volume was reported near the prior session total on the NYSE and lower on the Nasdaq exchange. Advancers led decliners by a 9-7 margin on the NYSE, but the mix was even on the Nasdaq exchange. There were 32 high-ranked companies from the CANSLIM.net Leaders List that made new 52-week highs and appeared on the CANSLIM.net BreakOuts Page, down from the total of 41 stocks on the prior session. New 52-week highs outnumbered new 52-week lows on the NYSE while new lows outnumbered new highs on the Nasdaq exchange. There were 2 of the 6 high-ranked companies currently included on the Featured Stocks Page which ended the session with a gain. The Dow Jones Industrial Average managed a new all-time high close on Wednesday's session. However, the gain was not considered enough for the Market (M criteria) to earn the label of returning to a "confirmed uptrend" per the newspaper. Therefore, confirming gains would be a welcome reassurance to still be watching for, and then any new buying efforts should be selective and only focused in stocks meeting all key criteria of the fact-based investment system. Keep in mind that any sustained and meaningful market advance requires leadership - a healthy crop of stocks hitting new 52-week highs.
The major averages ended a choppy trading session in negative territory as investors weighed a positive labor report against mounting tension in Ukraine. Non-farm payrolls unexpectedly rose 288,000 in April versus a projected 218,000 increase. The unemployment rate declined last month to 6.3%, its lowest level since September 2008.
Stocks moved lower after Russia called for a meeting of the UN Security Council over Ukraine sending its military to retake an area known as a pro-separatist stronghold.Utilities and health care were the worst performing sectors on the session with Duke Energy (DUK -2.3%) and Merck (MRQ -2.4%) ending lower. Energy and materials were the best performing groups as Exxon (XOM +0.6%) and Freeport McMoRan (FCX +1.5%) rose. On the earnings front, LinkedIn (LNKD -8.4%) fell following its reduced sales guidance. Este Lauder (EL +4.8%) was higher after raising its full-year forecast.
Treasuries were mixed with the 10-year note up 7/32 to yield 2.59%.
The CANSLIM.net Featured Stocks Page shows the most action-worthy candidates and their latest notes and a Headline Link directs members to the latest detailed analysis with data-packed graphs annotated by a Certified expert along with links to additional resources. The Premium Member Homepage includes "dynamic archives" to all prior pay reports published. Watch for an announcement via email concerning the next WEBCAST.
PICTURED: The S&P 500 Index is consolidating -0.8% off its all-time high.
|
 Kenneth J. Gruneisen started out as a licensed stockbroker in August 1987, a couple of months prior to the historic stock market crash that took the Dow Jones Industrial Average down -22.6% in a single day. He has published daily fact-based fundamental and technical analysis on high-ranked stocks online for two decades. Through FACTBASEDINVESTING.COM, Kenneth provides educational articles, news, market commentary, and other information regarding proven investment systems that work in good times and bad.
Comments contained in the body of this report are technical opinions only and are not necessarily those of Gruneisen Growth Corp. The material herein has been obtained from sources believed to be reliable and accurate, however, its accuracy and completeness cannot be guaranteed. Our firm, employees, and customers may effect transactions, including transactions contrary to any recommendation herein, or have positions in the securities mentioned herein or options with respect thereto. Any recommendation contained in this report may not be suitable for all investors and it is not to be deemed an offer or solicitation on our part with respect to the purchase or sale of any securities. |
|
 |
Financial, Commodity-Linked Groups Rose
Kenneth J. Gruneisen - Passed the CAN SLIM® Master's Exam
Financial shares were a positive influence on the major averages as the Broker/Dealer Index ($XBD +0.47%) and the Bank Index ($BKX +0.51%) rose and the Retail Index ($RLX +0.28%) eked out a small gain. Commodity-linked groups rose as the Gold & Silver Index ($XAU +2.21%) and the Oil Services Index ($OSX +0.74%) outpaced the Integrated Oil Index ($XOI +0.24%). The Semiconductor Index ($SOX +0.28%) eked out a small gain while the Biotechnology Index ($BTK -1.47%) and the Networking Index ($NWX -0.42%) both edged lower.
Charts courtesy www.stockcharts.com
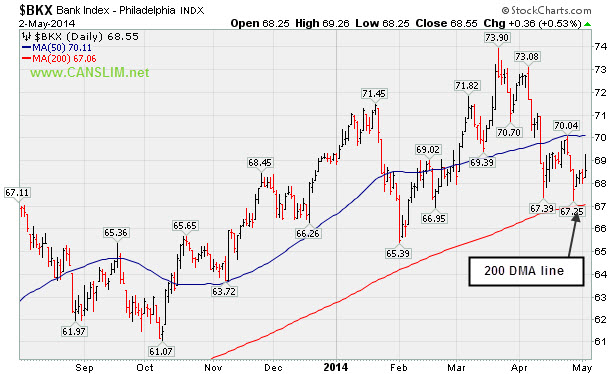
PICTURED: The Bank Index ($BKX +0.51%) halted its slide above its 200-day moving average (DMA) line.
| Oil Services |
$OSX |
293.96 |
+2.15 |
+0.74% |
+4.60% |
| Integrated Oil |
$XOI |
1,614.15 |
+3.82 |
+0.24% |
+7.39% |
| Semiconductor |
$SOX |
575.49 |
+1.63 |
+0.28% |
+7.56% |
| Networking |
$NWX |
327.02 |
-1.36 |
-0.42% |
+0.95% |
| Broker/Dealer |
$XBD |
156.10 |
+0.73 |
+0.47% |
-2.78% |
| Retail |
$RLX |
865.89 |
+2.40 |
+0.28% |
-7.86% |
| Gold & Silver |
$XAU |
93.00 |
+2.01 |
+2.21% |
+10.52% |
| Bank |
$BKX |
68.55 |
+0.35 |
+0.51% |
-1.03% |
| Biotech |
$BTK |
2,495.65 |
-37.34 |
-1.47% |
+7.09% |
|
|
|
 |
Submit Your Request for a Featured Stock Update
Kenneth J. Gruneisen - Passed the CAN SLIM® Master's Exam
Market conditions (the M criteria) are challenging at times. There are few stocks included on the Featured Stocks list and none of the companies need additional review in detail with annotated graphs. At times like these we have an opportunity to look back and review previously featured stocks which were dropped. This can serve as an educational review of the investment system's tactics. It is also a reminder that high-ranked leaders eventually fall out of favor. If you wish to request for a specific stock to receive more detailed coverage in this section please use the inquiry form to submit your request. Thank you. |
|
|
Color Codes Explained :
Y - Better candidates highlighted by our
staff of experts.
G - Previously featured
in past reports as yellow but may no longer be buyable under the
guidelines.
***Last / Change / Volume data in this table is the closing quote data***
Symbol/Exchange
Company Name
Industry Group |
PRICE |
CHANGE
(%Change) |
Day High |
Volume
(% DAV)
(% 50 day avg vol) |
52 Wk Hi
% From Hi |
Featured
Date |
Price
Featured |
Pivot Featured |
|
Max Buy |
EQM
-
NYSE
E Q T Midstream Partners
ENERGY - Oil and Gas Pipelines
|
$75.50
|
-0.58
-0.76% |
$76.90
|
5,591,170
5,225.39% of 50 DAV
50 DAV is 107,000
|
$78.67
-4.03%
|
12/12/2013
|
$53.17
|
PP = $56.51
|
|
MB = $59.34
|
 Most Recent Note - 5/2/2014 12:11:59 PM
G - Perched at an all-time high, it priced a new Public Offering of 10.75 Million common units. Fundamental concerns remain. Its 50 DMA line ($69.43) defines near-term support where a violation may trigger a technical sell signal.
>>> FEATURED STOCK ARTICLE : Stength Contiunues; Earnings Below +25% Minimum Guideline for a 2nd Quarter - 4/28/2014
View all notes |
Set NEW NOTE alert |
CANSLIM.net Company Profile |
SEC
News |
Chart |
Request a new note
C
A N
S L
I M


|
GNRC
-
NYSE
Generac Hldgs Inc
Electrical-Power/Equipmt
|
$55.00
|
+0.47
0.86% |
$55.38
|
1,377,649
218.47% of 50 DAV
50 DAV is 630,600
|
$62.50
-12.00%
|
2/14/2014
|
$56.50
|
PP = $57.39
|
|
MB = $60.26
|
Most Recent Note - 5/1/2014 11:58:44 AM
G - Reported earnings for the Mar '14 quarter and violated support at its 50 DMA line with a volume-driven loss today. Also undercut its recent low ($55.27 on 4/14/14) raising greater concerns. Color code is changed to green.
>>> FEATURED STOCK ARTICLE : Finished Just Below its 50-Day Average Line - 4/11/2014
View all notes |
Set NEW NOTE alert |
CANSLIM.net Company Profile |
SEC
News |
Chart |
Request a new note
C
A N
S L
I M
|
ICON
-
NASDAQ
Iconix Brand Group Inc
CONSUMER NON-DURABLES - Textile - Apparel Footwear
|
$42.09
|
-0.39
-0.92% |
$43.01
|
827,355
139.52% of 50 DAV
50 DAV is 593,000
|
$43.34
-2.88%
|
4/30/2014
|
$42.50
|
PP = $42.57
|
|
MB = $44.70
|
Most Recent Note - 4/30/2014 6:06:31 PM
Y - Reported earnings +33% on +11% sales revenues for the Mar '14 quarter, continuing its strong earnings track record satisfying the C criteria. Finished at the session high and a new 52-week high today with a considerable volume-driven gain. No resistance remains due to overhead supply. Color code is changed to yellow with new pivot point cited based on its 3/06/14 high plus 10 cents. Finished near the new pivot point, and confirming gains with above average volume could trigger a new technical buy signal.
>>> FEATURED STOCK ARTICLE : Rebound Above 50-Day Average Needed to Improve Outlook - 4/24/2014
View all notes |
Set NEW NOTE alert |
CANSLIM.net Company Profile |
SEC
News |
Chart |
Request a new note
C
A N
S L
I M
|
PSIX
-
NASDAQ
Power Solutions Intl Inc
Machinery-Gen Industrial
|
$83.86
|
-2.02
-2.35% |
$87.36
|
120,378
169.55% of 50 DAV
50 DAV is 71,000
|
$87.40
-4.05%
|
2/28/2014
|
$74.65
|
PP = $76.93
|
|
MB = $80.78
|
Most Recent Note - 5/2/2014 5:14:38 PM
G- Challenged its 52-week high but reversed early gains to close with a loss on above average volume. No resistance remains due to overhead supply. The 50 DMA line defines near-term support to watch.
>>> FEATURED STOCK ARTICLE : Halted Slide After Slump Below 50-Day Moving Average - 4/14/2014
View all notes |
Set NEW NOTE alert |
CANSLIM.net Company Profile |
SEC
News |
Chart |
Request a new note
C
A N
S L
I M
|
TRN
-
NYSE
Trinity Industries Inc
TRANSPORTATION - Railroads
|
$76.28
|
+1.99
2.68% |
$77.45
|
2,414,517
182.23% of 50 DAV
50 DAV is 1,325,000
|
$77.00
-0.94%
|
4/30/2014
|
$75.57
|
PP = $76.05
|
|
MB = $79.85
|
Most Recent Note - 5/2/2014 5:17:18 PM
Y - Hit a new 52-week high today and closed above its pivot point with a gain backed by +82% above average volume clinching a technical buy signal. Highlighted in yellow with pivot point cited based on its 3/21/14 high plus 10 cents in the 4/30/14 mid-day report (read here). See the latest FSU analysis for more details and annotated graphs.
>>> FEATURED STOCK ARTICLE : Finished Near Session Lows After Encountering Distributional Pressure - 4/30/2014
View all notes |
Set NEW NOTE alert |
CANSLIM.net Company Profile |
SEC
News |
Chart |
Request a new note
C
A N
S L
I M
|
Symbol/Exchange
Company Name
Industry Group |
PRICE |
CHANGE
(%Change) |
Day High |
Volume
(% DAV)
(% 50 day avg vol) |
52 Wk Hi
% From Hi |
Featured
Date |
Price
Featured |
Pivot Featured |
|
Max Buy |
WLK
-
NYSE
Westlake Chemical Corp
CHEMICALS - Specialty Chemicals
|
$70.86
|
+0.00
0.00% |
$71.47
|
812,612
123.31% of 50 DAV
50 DAV is 659,000
|
$73.38
-3.43%
|
4/29/2014
|
$72.79
|
PP = $69.31
|
|
MB = $72.78
|
Most Recent Note - 4/30/2014 12:43:10 PM
Y - Highlighted in yellow with pivot point cited based on its 4/04/14 high in the 4/29/14 mid-day report (read here). The plastics maker separated its ethylene assets into a tax-advantaged partnership in which it plans to sell shares to the public. Holding its ground today, it gapped up and tallied a considerable gain with more than 4 times average volume for a new 52-week high on the prior session triggering a technical buy signal while rallying from a "double bottom" base. Quarterly earnings increases have been above the +25% minimum (C criteria) in comparisons through Dec '13. Keep in mind that 3 out of 4 stocks tend to move in the same direction of the major averages (M criteria) and confirming gains from the major averages are still needed as reassurance the broader market is strong. See the latest FSU analysis for more details and new annotated graphs.
>>> FEATURED STOCK ARTICLE : Technical Breakout From Double Bottom Base Pattern - 4/29/2014
View all notes |
Set NEW NOTE alert |
CANSLIM.net Company Profile |
SEC
News |
Chart |
Request a new note
C
A N
S L
I M
|
|
|
|
THESE ARE NOT BUY RECOMMENDATIONS!
Comments contained in the body of this report are technical
opinions only. The material herein has been obtained
from sources believed to be reliable and accurate, however,
its accuracy and completeness cannot be guaranteed.
This site is not an investment advisor, hence it does
not endorse or recommend any securities or other investments.
Any recommendation contained in this report may not
be suitable for all investors and it is not to be deemed
an offer or solicitation on our part with respect to
the purchase or sale of any securities. All trademarks,
service marks and trade names appearing in this report
are the property of their respective owners, and are
likewise used for identification purposes only.
This report is a service available
only to active Paid Premium Members.
You may opt-out of receiving report notifications
at any time. Questions or comments may be submitted
by writing to Premium Membership Services 665 S.E. 10 Street, Suite 201 Deerfield Beach, FL 33441-5634 or by calling 1-800-965-8307
or 954-785-1121.
|
|
|

