You are not logged in.
This means you
CAN ONLY VIEW reports that were published prior to Monday, April 14, 2025.
You
MUST UPGRADE YOUR MEMBERSHIP if you want to see any current reports.
AFTER MARKET UPDATE - TUESDAY, APRIL 30TH, 2013
Previous After Market Report Next After Market Report >>>
|
|
|
|
DOW |
+21.05 |
14,839.80 |
+0.14% |
|
Volume |
886,974,070 |
+48% |
|
Volume |
1,870,844,980 |
+28% |
|
NASDAQ |
+21.77 |
3,328.79 |
+0.66% |
|
Advancers |
1,998 |
64% |
|
Advancers |
1,501 |
58% |
|
S&P 500 |
+3.96 |
1,597.57 |
+0.25% |
|
Decliners |
991 |
32% |
|
Decliners |
974 |
38% |
|
Russell 2000 |
+5.03 |
947.46 |
+0.53% |
|
52 Wk Highs |
300 |
|
|
52 Wk Highs |
145 |
|
|
S&P 600 |
+2.72 |
529.60 |
+0.52% |
|
52 Wk Lows |
14 |
|
|
52 Wk Lows |
22 |
|
|
 |
Indices Finish April on a High Note
Kenneth J. Gruneisen - Passed the CAN SLIM® Master's Exam
Stocks finished the month of April on a positive note as the major averages overcame early weakness and finished higher on Tuesday. The volume totals on the exchanges were reported higher than the prior session totals on the NYSE and on the Nasdaq exchange, indicating an increase in institutional buying demand. Breadth was positive as advancers outnumbered decliners by 2-1 on the NYSE and by 3-2 on the Nasdaq exchange. New 52-week highs totals solidly outnumbered new 52-week lows on both the NYSE and the Nasdaq exchange. There were 51 high-ranked companies from the CANSLIM.net Leaders List making new 52-week highs and appearing on the CANSLIM.net BreakOuts Page, down from the prior session total of 60 stocks. There were gains for 6 of the 11 high-ranked companies currently included on the Featured Stocks Page.
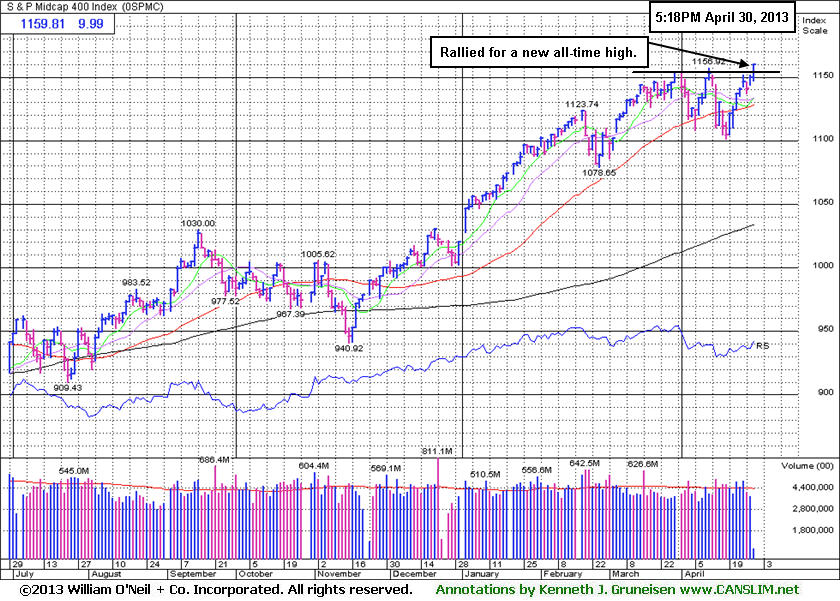
The Dow erased an earlier loss of as much as 84 points to close up 20 points to 14,839. The S&P 500 Index posted a fresh all-time high as it gained over 3 points to 1,597. The Nasdaq Composite Index rose above its best level since November 2000 as it advanced 21 points to 3,328. The Dow increased over +1.7% in April, the S&P 500 rose for the sixth-straight month with a gain of +1.8% and the Nasdaq Composite Index was up nearly +1.9%.
Encouraging updates on housing and the consumer helped lift the market higher. The S&P/Case-Schiller Home Price Index increased in February by the most since May 2006 and consumer confidence surprisingly rose to a five-month high in April. Investors overlooked a separate report which showed business activity unexpectedly shrank in April to the lowest level since September 2009.
Overall, most sectors finished higher on Tuesday's session. Technology paced the advance for a second day as Apple Inc (AAPL +2.94%) continued to bounce higher. Energy stocks were also among the best performers as Halliburton Co (HAL +2.89%) rallied. Express Scripts Holding Co (ESRX +1.59%) and The Hartford Financial Services Group Inc (HIG +3.23%) rose after their fresh earnings news, meanwhile Newmont Mining Corp (NEM -4.62%) and Masco Corp (MAS -4.80%) fell after their earnings reports.
In fixed-income, Treasuries were virtually unchanged as the 10-year note finished flat to yield 1.67%.
The market (M criteria) is considered to be back in a "confirmed uptrend" because of the new closing highs from both the Nasdaq Composite and the S&P 500 Index on Monday. Although none of the major averages produced a solid follow-through-day within the most favorable period between Days 4-7 of the new rally attempt, the new highs from the indices argue sufficiently that the prior uptrend has resumed. Another encouraging characteristic of the current market is the latest expansion in leadership (stocks hitting new 52-week highs).
Watch for an announcement via email concerning the next WEBCAST. The webcast will also be available via an updated link highlighted at the top of the Premium Member Homepage.
PICTURED: The S&P Mid-Cap 400 Index rallied and hit a new 2013 high. It promptly repaired the recent violation of its 50-day moving average (DMA) line
|
 Kenneth J. Gruneisen started out as a licensed stockbroker in August 1987, a couple of months prior to the historic stock market crash that took the Dow Jones Industrial Average down -22.6% in a single day. He has published daily fact-based fundamental and technical analysis on high-ranked stocks online for two decades. Through FACTBASEDINVESTING.COM, Kenneth provides educational articles, news, market commentary, and other information regarding proven investment systems that work in good times and bad.
Comments contained in the body of this report are technical opinions only and are not necessarily those of Gruneisen Growth Corp. The material herein has been obtained from sources believed to be reliable and accurate, however, its accuracy and completeness cannot be guaranteed. Our firm, employees, and customers may effect transactions, including transactions contrary to any recommendation herein, or have positions in the securities mentioned herein or options with respect thereto. Any recommendation contained in this report may not be suitable for all investors and it is not to be deemed an offer or solicitation on our part with respect to the purchase or sale of any securities. |
|
 |
Retail, Financial, Tech, and Defensive Groups Rose
Kenneth J. Gruneisen - Passed the CAN SLIM® Master's Exam
The Retail Index ($RLX +0.40%) posted a small gain and financial shares were also a positive influence on the major averages as the Broker/Dealer Index ($XBD +0.71%) outpaced the Bank Index ($BKX +0.18%) for Tuesday's mostly positive session. The Networking Index ($NWX +2.12%) led the tech sector higher, followed by the Semiconductor Index ($SOX +0.81%) and the Internet Index ($IIX +0.64%) each with a more modest gain of under +1% while the Biotechnology Index ($BTK -0.00%) finished flat. The Healthcare Index ($HMO +0.52%), Oil Services Index ($OSX +0.74%), and the Gold & Silver Index ($XAU +1.37%) had a positive bias.
Charts courtesy www.stockcharts.com
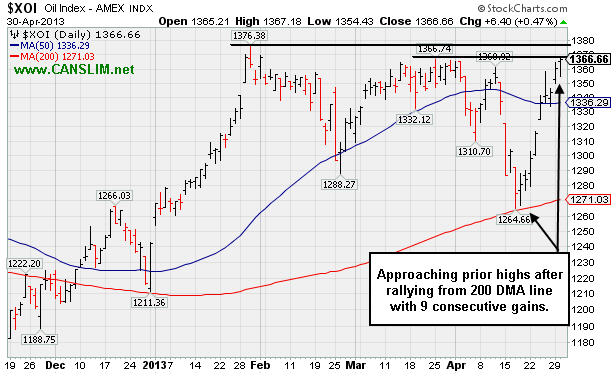
PICTURED: The Integrated Oil Index ($XOI +0.47%) is approaching prior highs after rallying from its 200-day moving average (DMA) line with 9 consecutive gains.
| Oil Services |
$OSX |
249.42 |
+1.83 |
+0.74% |
+13.29% |
| Healthcare |
$HMO |
2,947.76 |
+15.27 |
+0.52% |
+17.25% |
| Integrated Oil |
$XOI |
1,366.66 |
+6.40 |
+0.47% |
+10.05% |
| Semiconductor |
$SOX |
444.36 |
+3.56 |
+0.81% |
+15.70% |
| Networking |
$NWX |
225.40 |
+4.67 |
+2.12% |
-0.51% |
| Internet |
$IIX |
363.27 |
+2.32 |
+0.64% |
+11.09% |
| Broker/Dealer |
$XBD |
112.87 |
+0.80 |
+0.71% |
+19.65% |
| Retail |
$RLX |
748.03 |
+2.97 |
+0.40% |
+14.54% |
| Gold & Silver |
$XAU |
109.36 |
+1.48 |
+1.37% |
-33.96% |
| Bank |
$BKX |
56.88 |
+0.10 |
+0.18% |
+10.92% |
| Biotech |
$BTK |
1,931.57 |
-0.09 |
-0.00% |
+24.86% |
|
|
|
 |
Earnings News Due Soon; New Base Has Formed
Kenneth J. Gruneisen - Passed the CAN SLIM® Master's Exam
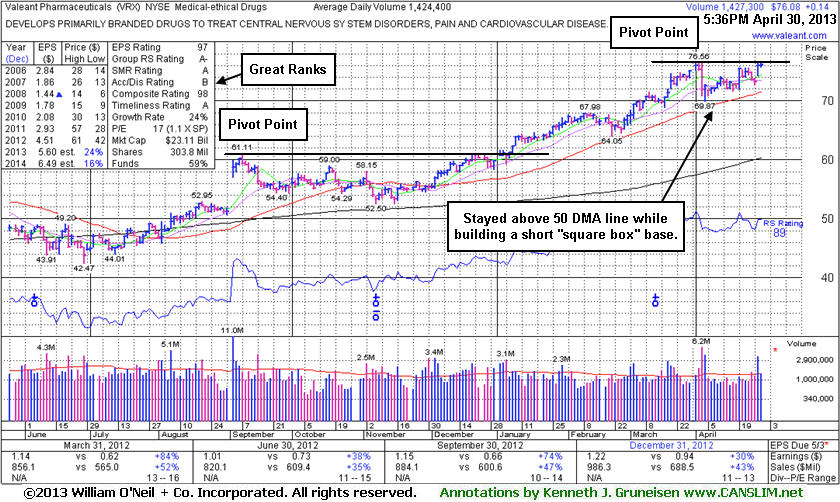
Valeant Pharmaceuticals (VRX +$0.14 or +0.18% to $76.08) held its ground today following a gap up and volume-driven gain on the prior session. It has formed a short square box base and the color code was changed to yellow with new pivot point cited based on its 4/02/13 high plus 10 cents. Subsequent volume-driven gains above its pivot point may trigger a new (or add-on) technical buy signal. Its recent the recent low ($69.87 on 4/04/13) defines important near-term support below its 50-day moving average (DMA) line where violations may trigger technical sell signals.
Keep in mind that VRX is due to report earnings before the open on Thursday, May 2nd, and volume and volatility often increase near earnings news. The high-ranked Medical - Ethical Drugs firm was last shown in this FSU section on 4/08/13 with an annotated graph under the headline, "Pullback Near 50-day Moving Average on M&A News ", while consolidating above its 50-day moving average (DMA) line. A short new base of sufficient length has formed while it stayed above its 50-day moving average (DMA) line during the latest consolidation. On 4/03/13 it pulled back on heavy volume after agreeing to an increased offer price of $24.00 cash for it to acquire Obagi Medical Products, yet it stayed above its 50 DMA line.
The number of top-rated funds owning its shares rose from 818 in Mar '12 in to 942 in Mar '13, a reassuring trend concerning the I criteria. Its current Up/Down Volume Ratio of 1.3 is also an unbiased indication that its shares have been under accumulation over the past 50 days. Quarterly earnings increases (C criteria) have been strong and well above the +25% guideline. A downturn in FY '07 and '08 earnings (A criteria) has been followed by a strong earnings rebound in recent years. Return On Equity is currently reported at 37%, well above the 17% minimum guideline of the fact-based system.
|
|
|
Color Codes Explained :
Y - Better candidates highlighted by our
staff of experts.
G - Previously featured
in past reports as yellow but may no longer be buyable under the
guidelines.
***Last / Change / Volume data in this table is the closing quote data***
Symbol/Exchange
Company Name
Industry Group |
PRICE |
CHANGE
(%Change) |
Day High |
Volume
(% DAV)
(% 50 day avg vol) |
52 Wk Hi
% From Hi |
Featured
Date |
Price
Featured |
Pivot Featured |
|
Max Buy |
CELG
-
NASDAQ
Celgene Corp
DRUGS - Drug Manufacturers - Major
|
$118.07
|
-0.40
-0.34% |
$119.46
|
3,864,338
118.52% of 50 DAV
50 DAV is 3,260,600
|
$128.52
-8.13%
|
3/27/2013
|
$113.24
|
PP = $115.54
|
|
MB = $121.32
|
 Most Recent Note - 4/30/2013 6:07:42 PM
G - Enduring more distributional pressure yet still stubbornly holding its ground only -8.1% off its high. It is extended from any sound base. Its 50 DMA line ($113 now) defines important near-term support to watch.
>>> The latest Featured Stock Update with an annotated graph appeared on 4/19/2013. Click here.
View all notes |
Alert me of new notes |
CANSLIM.net Company Profile |
SEC |
Zacks Reports |
StockTalk |
News |
Chart |
Request a new note
C
A N
S L
I M


|
CMCSA
-
NASDAQ
Comcast Corp Cl A
MEDIA - CATV Systems
|
$41.30
|
-0.19
-0.46% |
$41.68
|
8,874,233
67.94% of 50 DAV
50 DAV is 13,062,200
|
$42.61
-3.07%
|
12/3/2012
|
$37.08
|
PP = $38.06
|
|
MB = $39.96
|
Most Recent Note - 4/26/2013 4:28:11 PM
G - Rebounded above its 50 DMA line with higher volume behind its gain, helping its technical stance improve. Fundamental concerns were repeatedly noted after sub par earnings results for the Dec '12 quarter.
>>> The latest Featured Stock Update with an annotated graph appeared on 4/16/2013. Click here.
View all notes |
Alert me of new notes |
CANSLIM.net Company Profile |
SEC |
Zacks Reports |
StockTalk |
News |
Chart |
Request a new note
C
A N
S L
I M
|
EMN
-
NYSE
Eastman Chemical Co
CHEMICALS - Chemicals - Major Diversified
|
$66.65
|
-1.62
-2.37% |
$68.26
|
2,375,345
140.20% of 50 DAV
50 DAV is 1,694,200
|
$75.18
-11.35%
|
4/26/2013
|
$69.57
|
PP = $73.83
|
|
MB = $77.52
|
Most Recent Note - 4/30/2013 5:56:32 PM
G - Slumped further below its 50 DMA line today and its color code is changed to green after 3 consecutive losses backed by above average volume indicating distributional pressure. A prompt rebound above its 50 DMA line is needed for its outlook to improve. Subsequent volume-driven gains above the pivot point are needed to trigger a proper technical buy signal from the "double bottom" base pattern noted before disciplined investors may consider taking action. See the latest FSU analysis for more details and a new annotated graph.
>>> The latest Featured Stock Update with an annotated graph appeared on 4/26/2013. Click here.
View all notes |
Alert me of new notes |
CANSLIM.net Company Profile |
SEC |
Zacks Reports |
StockTalk |
News |
Chart |
Request a new note
C
A N
S L
I M
|
EQM
-
NYSE
E Q T Midstream Partners
ENERGY - Oil and Gas Pipelines
|
$46.30
|
+2.35
5.35% |
$47.22
|
241,927
338.36% of 50 DAV
50 DAV is 71,500
|
$44.12
4.94%
|
4/25/2013
|
$40.16
|
PP = $40.84
|
|
MB = $42.88
|
Most Recent Note - 4/30/2013 2:11:39 PM
G - Getting very extended from the prior base with today's 7th consecutive gain. Prior highs in the $40 area define initial support to watch above its 50 DMA line on pullbacks.
>>> The latest Featured Stock Update with an annotated graph appeared on 4/25/2013. Click here.
View all notes |
Alert me of new notes |
CANSLIM.net Company Profile |
SEC |
Zacks Reports |
StockTalk |
News |
Chart |
Request a new note
C
A N
S L
I M
|
FLT
-
NYSE
Fleetcor Technologies
DIVERSIFIED SERVICES - Business/Management Services
|
$76.90
|
+1.46
1.94% |
$77.14
|
1,183,145
148.38% of 50 DAV
50 DAV is 797,400
|
$78.87
-2.50%
|
3/21/2013
|
$71.14
|
PP = $73.00
|
|
MB = $76.65
|
Most Recent Note - 4/30/2013 6:10:16 PM
G - Posted a gain with above average volume, trading within close striking distance of its 52-week high. Color code was changed to green after it finished above its "max buy" level. More damaging losses below the 50 DMA line or recent low ($70.09) would raise more serious concerns and trigger a worrisome technical sell signal.
>>> The latest Featured Stock Update with an annotated graph appeared on 4/15/2013. Click here.
View all notes |
Alert me of new notes |
CANSLIM.net Company Profile |
SEC |
Zacks Reports |
StockTalk |
News |
Chart |
Request a new note
C
A N
S L
I M
|
Symbol/Exchange
Company Name
Industry Group |
PRICE |
CHANGE
(%Change) |
Day High |
Volume
(% DAV)
(% 50 day avg vol) |
52 Wk Hi
% From Hi |
Featured
Date |
Price
Featured |
Pivot Featured |
|
Max Buy |
LNKD
-
NYSE
Linkedin Corp Class A
INTERNET - Internet Information Providers
|
$192.09
|
+3.70
1.96% |
$193.37
|
2,252,103
109.52% of 50 DAV
50 DAV is 2,056,300
|
$191.78
0.16%
|
4/12/2013
|
$182.69
|
PP = $184.25
|
|
MB = $193.46
|
Most Recent Note - 4/30/2013 5:58:23 PM
Y - Hit another new 52-week high today with near average volume behind its gain. Recent gains lacked the necessary volume conviction to trigger a proper new (or add-on) technical buy signal. Its 50 DMA line and recent low define important near-term chart support to watch. See the latest FSU analysis for more details and a new annotated graph.
>>> The latest Featured Stock Update with an annotated graph appeared on 4/29/2013. Click here.
View all notes |
Alert me of new notes |
CANSLIM.net Company Profile |
SEC |
Zacks Reports |
StockTalk |
News |
Chart |
Request a new note
C
A N
S L
I M
|
MRLN
-
NASDAQ
Marlin Business Services
DIVERSIFIED SERVICES - Rental and Leasing Services
|
$24.23
|
+0.71
3.02% |
$24.46
|
31,665
120.86% of 50 DAV
50 DAV is 26,200
|
$24.93
-2.81%
|
3/15/2013
|
$22.29
|
PP = $23.18
|
|
MB = $24.34
|
Most Recent Note - 4/30/2013 5:59:58 PM
Y - Finished 2 cents below its best close of 2013 with today's gain backed by only +20% above average volume. Action has not been indicative of great new institutional buying demand, yet no resistance remains due to overhead supply.
>>> The latest Featured Stock Update with an annotated graph appeared on 4/9/2013. Click here.
View all notes |
Alert me of new notes |
CANSLIM.net Company Profile |
SEC |
Zacks Reports |
StockTalk |
News |
Chart |
Request a new note
C
A N
S L
I M
|
MWIV
-
NASDAQ
M W I Veterinary Supply
HEALTH SERVICES - Medical Instruments and; Supplies
|
$117.71
|
-1.07
-0.90% |
$119.28
|
117,846
208.58% of 50 DAV
50 DAV is 56,500
|
$137.18
-14.19%
|
3/4/2013
|
$130.90
|
PP = $129.45
|
|
MB = $135.92
|
Most Recent Note - 4/30/2013 6:04:39 PM
Fell today with above average volume indicative of distributional pressure. Its Relative Strength rating has slumped to 67, below the 80+ minimum guideline for buy candidates. It will be dropped from the Featured Stocks list tonight. Due to report earnings news for the latest quarter on the morning of Thursday, May 2, 2013. Volume and volatility often increase near earnings news.
>>> The latest Featured Stock Update with an annotated graph appeared on 4/24/2013. Click here.
View all notes |
Alert me of new notes |
CANSLIM.net Company Profile |
SEC |
Zacks Reports |
StockTalk |
News |
Chart |
Request a new note
C
A N
S L
I M
|
N
-
NYSE
Netsuite Inc
DIVERSIFIED SERVICES - Business/Management Services
|
$87.96
|
-0.74
-0.83% |
$88.14
|
405,098
107.40% of 50 DAV
50 DAV is 377,200
|
$89.19
-1.38%
|
12/12/2012
|
$64.75
|
PP = $67.12
|
|
MB = $70.48
|
Most Recent Note - 4/29/2013 12:22:08 PM
G - Reported earnings -33% on +32% sales revenues for the Mar '13 quarter, marking a 2nd consecutive quarterly comparison with earnings below the +25% minimum guideline (C criteria). Despite fundamental concerns raised it is rallying for another new all-time high with today's 5th consecutive gain. Its 50 DMA line defines important near-term support to watch.
>>> The latest Featured Stock Update with an annotated graph appeared on 4/22/2013. Click here.
View all notes |
Alert me of new notes |
CANSLIM.net Company Profile |
SEC |
Zacks Reports |
StockTalk |
News |
Chart |
Request a new note
C
A N
S L
I M
|
RRTS
-
NYSE
Roadrunner Trans Systems
TRANSPORTATION - Air Delivery and Freight Service
|
$22.51
|
-0.15
-0.66% |
$22.80
|
107,626
62.14% of 50 DAV
50 DAV is 173,200
|
$23.88
-5.74%
|
4/3/2013
|
$22.77
|
PP = $23.75
|
|
MB = $24.94
|
Most Recent Note - 4/30/2013 6:05:45 PM
G - Holding its ground stubbornly but still lingering below its 50 DMA line after failing to trigger a new buy signal since featured on 4/03/13. A rebound above that important short-term average would help its outlook improve.
>>> The latest Featured Stock Update with an annotated graph appeared on 4/23/2013. Click here.
View all notes |
Alert me of new notes |
CANSLIM.net Company Profile |
SEC |
Zacks Reports |
StockTalk |
News |
Chart |
Request a new note
C
A N
S L
I M
|
Symbol/Exchange
Company Name
Industry Group |
PRICE |
CHANGE
(%Change) |
Day High |
Volume
(% DAV)
(% 50 day avg vol) |
52 Wk Hi
% From Hi |
Featured
Date |
Price
Featured |
Pivot Featured |
|
Max Buy |
VRX
-
NYSE
Valeant Pharmaceuticals
DRUGS - Drug Manufacturers - Other
|
$76.08
|
+0.14
0.18% |
$76.46
|
1,427,321
100.21% of 50 DAV
50 DAV is 1,424,400
|
$76.57
-0.64%
|
4/30/2013
|
$60.24
|
PP = $76.66
|
|
MB = $80.49
|
Most Recent Note - 4/30/2013 6:14:09 PM
Y- Gapped up on the prior session and tallied a volume-driven gain. It has formed a short square box base and the color code was changed to yellow with new pivot point cited based on its 4/02/13 high plus 10 cents. A volume-driven gain above its pivot point may trigger a new (or add-on) technical buy signal. Its 50 DMA line defines near-term support above recent the recent low ($69.87 on 4/04/13) where violations may trigger technical sell signals. Due to report earnings before the open on Thursday, May 2nd, and volume and volatility often increase near earnings news. See the latest FSU analysis for more details and a new annotated graph.
>>> The latest Featured Stock Update with an annotated graph appeared on 4/30/2013. Click here.
View all notes |
Alert me of new notes |
CANSLIM.net Company Profile |
SEC |
Zacks Reports |
StockTalk |
News |
Chart |
Request a new note
C
A N
S L
I M
|
|
|
|
THESE ARE NOT BUY RECOMMENDATIONS!
Comments contained in the body of this report are technical
opinions only. The material herein has been obtained
from sources believed to be reliable and accurate, however,
its accuracy and completeness cannot be guaranteed.
This site is not an investment advisor, hence it does
not endorse or recommend any securities or other investments.
Any recommendation contained in this report may not
be suitable for all investors and it is not to be deemed
an offer or solicitation on our part with respect to
the purchase or sale of any securities. All trademarks,
service marks and trade names appearing in this report
are the property of their respective owners, and are
likewise used for identification purposes only.
This report is a service available
only to active Paid Premium Members.
You may opt-out of receiving report notifications
at any time. Questions or comments may be submitted
by writing to Premium Membership Services 665 S.E. 10 Street, Suite 201 Deerfield Beach, FL 33441-5634 or by calling 1-800-965-8307
or 954-785-1121.
|
|
|

