You are not logged in.
This means you
CAN ONLY VIEW reports that were published prior to Monday, April 14, 2025.
You
MUST UPGRADE YOUR MEMBERSHIP if you want to see any current reports.
AFTER MARKET UPDATE - TUESDAY, APRIL 29TH, 2014
Previous After Market Report Next After Market Report >>>
|
|
|
|
DOW |
+86.63 |
16,535.37 |
+0.53% |
|
Volume |
723,786,930 |
-10% |
|
Volume |
1,787,078,390 |
-19% |
|
NASDAQ |
+29.56 |
4,103.96 |
+0.73% |
|
Advancers |
1,835 |
58% |
|
Advancers |
1,412 |
51% |
|
S&P 500 |
+8.90 |
1,878.33 |
+0.48% |
|
Decliners |
1,226 |
39% |
|
Decliners |
1,230 |
45% |
|
Russell 2000 |
+3.77 |
1,120.83 |
+0.34% |
|
52 Wk Highs |
117 |
|
|
52 Wk Highs |
29 |
|
|
S&P 600 |
+1.82 |
648.26 |
+0.28% |
|
52 Wk Lows |
27 |
|
|
52 Wk Lows |
56 |
|
|
 |
Indices Rose With Lighter Volume Totals Behind Gains
Kenneth J. Gruneisen - Passed the CAN SLIM® Master's Exam
The major averages rose on Tuesday’s session. The volume totals were lighter versus the prior session totals on the Nasdaq exchange and on the NYSE. Advancers led decliners by a 3-2 margin on the NYSE but advancers led by a narrower 7-6 margin on the Nasdaq exchange. There were 15 high-ranked companies from the CANSLIM.net Leaders List that made new 52-week highs and appeared on the CANSLIM.net BreakOuts Page, down a notch from the total of 16 stocks on the prior session. New 52-week highs outnumbered new 52-week lows on the NYSE while new lows outnumbered new highs on the Nasdaq exchange. There were gains for 2 of the 5 of the high-ranked companies currently included on the Featured Stocks Page posted a gain. The setback on Friday left investors still waiting for more significant gains from the major indices backed by heavier volume, action which would be a meaningful improvement that more convincingly argues the Market (M criteria) is shifting back to a confirmed uptrend. Meanwhile, caution is still warranted. Keep in mind that any sustained and meaningful market advance requires leadership - a healthy crop of stocks hitting new 52-week highs.
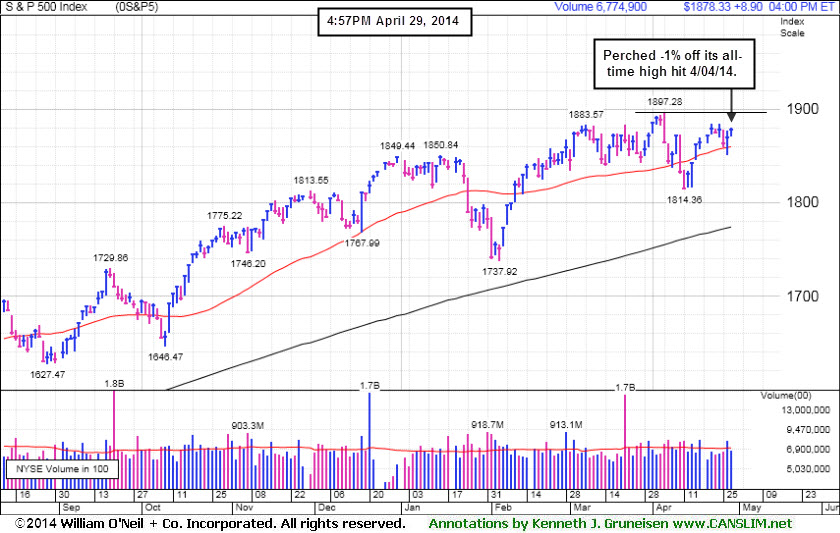
On Tuesday's session the Dow rose 87 points to 16,535. The S&P 500 gained 9 points to 1,878. The NASDAQ finished 29 points higher at 4,103.
The major averages climbed amid a round of positive corporate profit releases. Merck (MRK +3.60%) rose as quarterly results exceeded analyst estimates. Shares of Twitter (TWTR +4.64%) rose ahead of its scheduled earnings release.
On the economic front, the Case/Shiller index showed home prices rose +12.9% in February from a year ago. The Conference Board revealed consumer confidence unexpectedly dipped in April. Attention was also on the Fed. The central bank is expected to taper its monthly bond purchases to $45 billion at the conclusion of its two-day policy meeting Wednesday.
Eight of 10 sectors were higher on the session. Materials and financials were the best performing groups. Dow Chemical (DOW +2.98%) increased on its positive earnings results. Shares of Ameriprise Financial (AMP +5.84%) rose after quarterly profits topped estimates and increased its share buyback. Consumer discretionary and utilities sat out Tuesday's advance. Coach (COH -9.34%) fell hard after the handbag maker reported North American sales declined -21% due to increased competition and bad weather. Edison International (EIX -0.54%) edged lower.
Treasuries were little changed. The 10-year note was up 3/32 to yield 2.69%.
The CANSLIM.net Featured Stocks Page shows the most action-worthy candidates and their latest notes and a Headline Link directs members to the latest detailed analysis with data-packed graphs annotated by a Certified expert along with links to additional resources. The Premium Member Homepage includes "dynamic archives" to all prior pay reports published. Watch for an announcement via email concerning the next WEBCAST.
PICTURED: The S&P 500 Index is consolidating above its 50-day moving average (DMA) line and perched -1% off its all-time high hit on 4/04/14.
|
 Kenneth J. Gruneisen started out as a licensed stockbroker in August 1987, a couple of months prior to the historic stock market crash that took the Dow Jones Industrial Average down -22.6% in a single day. He has published daily fact-based fundamental and technical analysis on high-ranked stocks online for two decades. Through FACTBASEDINVESTING.COM, Kenneth provides educational articles, news, market commentary, and other information regarding proven investment systems that work in good times and bad.
Comments contained in the body of this report are technical opinions only and are not necessarily those of Gruneisen Growth Corp. The material herein has been obtained from sources believed to be reliable and accurate, however, its accuracy and completeness cannot be guaranteed. Our firm, employees, and customers may effect transactions, including transactions contrary to any recommendation herein, or have positions in the securities mentioned herein or options with respect thereto. Any recommendation contained in this report may not be suitable for all investors and it is not to be deemed an offer or solicitation on our part with respect to the purchase or sale of any securities. |
|
 |
Financial, Tech, Retail, and Gold & Silver Indexes Rose
Kenneth J. Gruneisen - Passed the CAN SLIM® Master's Exam
Financial shares were a positive influence on the major averages on Tuesday as the Bank Index ($BKX +0.80%) and the Broker/Dealer Index ($XBD +1.06%) both rose. The Semiconductor Index ($SOX +0.78%) and the Networking Index ($NWX +1.15%) posted modest gains and the Biotechnology Index ($BTK +2.95%) was a standout tech sector gainer.The Retail Index ($RLX +0.36%) eked out a small gain. The Integrated Oil Index ($XOI +0.45%) posted a modest gain while the Oil Services Index ($OSX +0.06%) finished flat. The Gold & Silver Index ($XAU +1.65%) also ratcheted higher.
Charts courtesy www.stockcharts.com
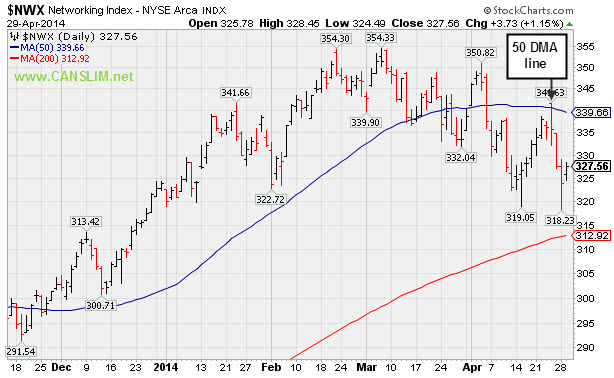
PICTURED: The Networking Index ($NWX +1.15%) is consolidating near recent lows above its 200-day moving average (DMA) line after meeting resistance at its 50 DMA line last week.
| Oil Services |
$OSX |
292.65 |
+0.18 |
+0.06% |
+4.13% |
| Integrated Oil |
$XOI |
1,608.53 |
+7.15 |
+0.45% |
+7.01% |
| Semiconductor |
$SOX |
572.99 |
+4.44 |
+0.78% |
+7.09% |
| Networking |
$NWX |
327.56 |
+3.73 |
+1.15% |
+1.12% |
| Broker/Dealer |
$XBD |
154.35 |
+1.62 |
+1.06% |
-3.87% |
| Retail |
$RLX |
857.77 |
+3.05 |
+0.36% |
-8.73% |
| Gold & Silver |
$XAU |
92.88 |
+1.51 |
+1.65% |
+10.37% |
| Bank |
$BKX |
68.26 |
+0.54 |
+0.80% |
-1.44% |
| Biotech |
$BTK |
2,494.46 |
+71.59 |
+2.95% |
+7.04% |
|
|
|
 |
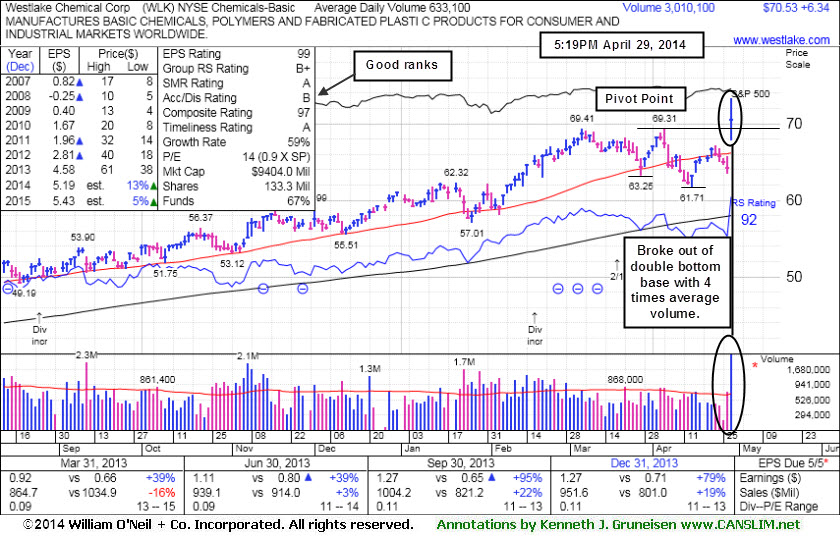
Technical Breakout From Double Bottom Base Pattern
Kenneth J. Gruneisen - Passed the CAN SLIM® Master's Exam
Westlake Chemical Corp (WLK +$6.34 or +9.88% to $70.53) was highlighter in yellow with pivot point cited based on its 4/04/14 high in the earlier mid-day report (read here). The plastics maker separated its ethylene assets into a tax-advantaged partnership in which it plans to sell shares to the public. It gapped up today for a considerable volume-driven gain and a new 52-week high, rallying from a "double bottom" base. While the stock's bullish action triggered a technical buy signal, members were cautioned that 3 out of 4 stocks tend to move in the same direction of the major averages (M criteria). Confirming gains from the major averages are still needed as reassurance the broader market is strong.
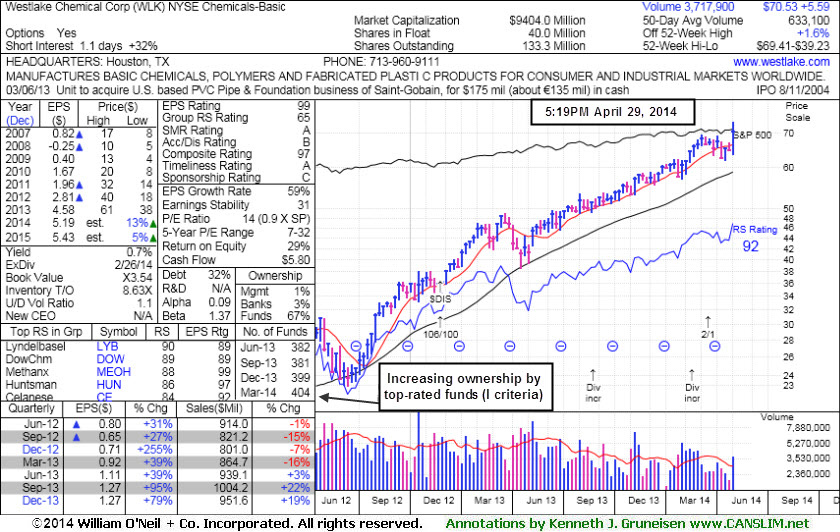
It has earned good ranks and its quarterly earnings increases have been above the +25% minimum (C criteria) in recent comparisons through Dec '13. Its annual earnings growth rate (A criteria) has also been strong after a downturn in FY '08 and '09. The number of top-rated funds owning its shares rose from 381 in Sep '13 to 404 in Mar '14, a reassuring trend concerning the I criteria. Although the Chemicals - Basic industry group has a mediocre 65 Group Relative Strength, strong action and leadership from others in the group is a reassuring sign concerning the L criteria.
|
|
|
Color Codes Explained :
Y - Better candidates highlighted by our
staff of experts.
G - Previously featured
in past reports as yellow but may no longer be buyable under the
guidelines.
***Last / Change / Volume data in this table is the closing quote data***
Symbol/Exchange
Company Name
Industry Group |
PRICE |
CHANGE
(%Change) |
Day High |
Volume
(% DAV)
(% 50 day avg vol) |
52 Wk Hi
% From Hi |
Featured
Date |
Price
Featured |
Pivot Featured |
|
Max Buy |
EQM
-
NYSE
E Q T Midstream Partners
ENERGY - Oil and Gas Pipelines
|
$75.64
|
-0.16
-0.21% |
$76.08
|
64,145
58.31% of 50 DAV
50 DAV is 110,000
|
$77.77
-2.74%
|
12/12/2013
|
$53.17
|
PP = $56.51
|
|
MB = $59.34
|
Most Recent Note - 4/24/2014 6:08:34 PM
G - Hovering at its all-time high and in strong shape, technically, despite fundamental concerns recently noted. Its 50 DMA line ($68.61) defines near-term support where a violation may trigger a technical sell signal.
>>> FEATURED STOCK ARTICLE : Stength Contiunues; Earnings Below +25% Minimum Guideline for a 2nd Quarter - 4/28/2014
View all notes |
Set NEW NOTE alert |
CANSLIM.net Company Profile |
SEC
News |
Chart |
Request a new note
C
A N
S L
I M


|
GNRC
-
NYSE
Generac Hldgs Inc
Electrical-Power/Equipmt
|
$58.56
|
-0.20
-0.34% |
$59.09
|
623,771
103.79% of 50 DAV
50 DAV is 601,000
|
$62.50
-6.30%
|
2/14/2014
|
$56.50
|
PP = $57.39
|
|
MB = $60.26
|
Most Recent Note - 4/24/2014 6:10:00 PM
Y - Edged higher today for its 8th consecutive small gain on below average volume. Found support near its 50 DMA line and prior highs in the $57 area recently. More damaging losses below its recent low ($55.27 on 4/14/14) would raise greater concerns.
>>> FEATURED STOCK ARTICLE : Finished Just Below its 50-Day Average Line - 4/11/2014
View all notes |
Set NEW NOTE alert |
CANSLIM.net Company Profile |
SEC
News |
Chart |
Request a new note
C
A N
S L
I M
|
ICON
-
NASDAQ
Iconix Brand Group Inc
CONSUMER NON-DURABLES - Textile - Apparel Footwear
|
$39.82
|
+0.14
0.35% |
$40.00
|
743,070
129.68% of 50 DAV
50 DAV is 573,000
|
$42.47
-6.23%
|
3/7/2014
|
$41.46
|
PP = $40.88
|
|
MB = $42.92
|
Most Recent Note - 4/28/2014 12:00:23 PM
G - Small gap up today, rebounding near its 50 DMA line (now $39.49). Faces a little near-term resistance due to overhead supply up through the $42 level.
>>> FEATURED STOCK ARTICLE : Rebound Above 50-Day Average Needed to Improve Outlook - 4/24/2014
View all notes |
Set NEW NOTE alert |
CANSLIM.net Company Profile |
SEC
News |
Chart |
Request a new note
C
A N
S L
I M
|
PSIX
-
NASDAQ
Power Solutions Intl Inc
Machinery-Gen Industrial
|
$81.50
|
+0.00
0.00% |
$82.20
|
84,211
122.04% of 50 DAV
50 DAV is 69,000
|
$87.40
-6.75%
|
2/28/2014
|
$74.65
|
PP = $76.93
|
|
MB = $80.78
|
 Most Recent Note - 4/29/2014 5:36:40 PM
G- Stubbornly holding its ground perched within close striking distance of its 52-week high. The recent low ($66.03 on 4/07/14) defines important near-term support below the 50 DMA line where further deterioration would raise greater concerns.
>>> FEATURED STOCK ARTICLE : Halted Slide After Slump Below 50-Day Moving Average - 4/14/2014
View all notes |
Set NEW NOTE alert |
CANSLIM.net Company Profile |
SEC
News |
Chart |
Request a new note
C
A N
S L
I M
|
WLK
-
NYSE
Westlake Chemical Corp
CHEMICALS - Specialty Chemicals
|
$70.53
|
+6.34
9.88% |
$73.38
|
3,010,299
475.56% of 50 DAV
50 DAV is 633,000
|
$69.41
1.61%
|
4/29/2014
|
$72.79
|
PP = $69.31
|
|
MB = $72.78
|
Most Recent Note - 4/29/2014 5:40:00 PM
Y - Highlighted in yellow with pivot point cited based on its 4/04/14 high in the earlier mid-day report (read here). The plastics maker separated its ethylene assets into a tax-advantaged partnership in which it plans to sell shares to the public. Gapped up and tallied a considerable gain with more than 4 times average volume for a new 52-week high, triggering a technical buy signal while rallying from a "double bottom" base. Quarterly earnings increases have been above the +25% minimum (C criteria) in comparisons through Dec '13. Keep in mind that 3 out of 4 stocks tend to move in the same direction of the major averages (M criteria) and confirming gains from the major averages are still needed as reassurance the broader market is strong. See the latest FSU analysis for more details and new annotated graphs.
>>> FEATURED STOCK ARTICLE : Technical Breakout From Double Bottom Base Pattern - 4/29/2014
View all notes |
Set NEW NOTE alert |
CANSLIM.net Company Profile |
SEC
News |
Chart |
Request a new note
C
A N
S L
I M
|
Symbol/Exchange
Company Name
Industry Group |
PRICE |
CHANGE
(%Change) |
Day High |
Volume
(% DAV)
(% 50 day avg vol) |
52 Wk Hi
% From Hi |
Featured
Date |
Price
Featured |
Pivot Featured |
|
Max Buy |
|
|
|
THESE ARE NOT BUY RECOMMENDATIONS!
Comments contained in the body of this report are technical
opinions only. The material herein has been obtained
from sources believed to be reliable and accurate, however,
its accuracy and completeness cannot be guaranteed.
This site is not an investment advisor, hence it does
not endorse or recommend any securities or other investments.
Any recommendation contained in this report may not
be suitable for all investors and it is not to be deemed
an offer or solicitation on our part with respect to
the purchase or sale of any securities. All trademarks,
service marks and trade names appearing in this report
are the property of their respective owners, and are
likewise used for identification purposes only.
This report is a service available
only to active Paid Premium Members.
You may opt-out of receiving report notifications
at any time. Questions or comments may be submitted
by writing to Premium Membership Services 665 S.E. 10 Street, Suite 201 Deerfield Beach, FL 33441-5634 or by calling 1-800-965-8307
or 954-785-1121.
|
|
|

