You are not logged in.
This means you
CAN ONLY VIEW reports that were published prior to Tuesday, February 18, 2025.
You
MUST UPGRADE YOUR MEMBERSHIP if you want to see any current reports.
AFTER MARKET UPDATE - MONDAY, APRIL 28TH, 2014
Previous After Market Report Next After Market Report >>>
|
|
|
|
DOW |
+87.28 |
16,448.74 |
+0.53% |
|
Volume |
803,866,390 |
+18% |
|
Volume |
2,196,362,870 |
+13% |
|
NASDAQ |
-1.16 |
4,074.40 |
-0.03% |
|
Advancers |
1,599 |
50% |
|
Advancers |
1,003 |
36% |
|
S&P 500 |
+6.03 |
1,869.43 |
+0.32% |
|
Decliners |
1,459 |
46% |
|
Decliners |
1,726 |
61% |
|
Russell 2000 |
-5.97 |
1,117.06 |
-0.53% |
|
52 Wk Highs |
95 |
|
|
52 Wk Highs |
23 |
|
|
S&P 600 |
-3.29 |
646.44 |
-0.51% |
|
52 Wk Lows |
52 |
|
|
52 Wk Lows |
107 |
|
|
 |
Major Averages Ended Mostly Higher While Breadth Was Negative
Kenneth J. Gruneisen - Passed the CAN SLIM® Master's Exam
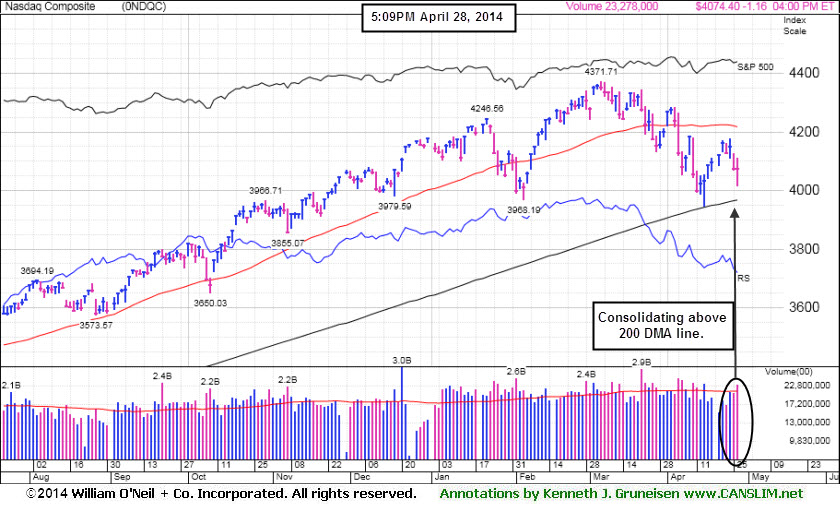
Stocks were up on Monday’s session. The Dow gained 87 points to 16,448. The S&P 500 rose 6 points to 1,869. The NASDAQ recovered from a 61 point decline to close down a point at 4,074. The volume total rose versus the prior session on the Nasdaq exchange and on the NYSE. Decliners led advancers by a narrow margin on the NYSE while decliners led advancers by a 3-2 margin on the Nasdaq exchange. There were 16 high-ranked companies from the CANSLIM.net Leaders List that made new 52-week highs and appeared on the CANSLIM.net BreakOuts Page, up from the total of 11 stocks on the prior session. New 52-week highs outnumbered new 52-week lows on the NYSE while new lows outnumbered new highs on the Nasdaq exchange. There were gains for 3 of the 4 of the high-ranked companies currently included on the Featured Stocks Page posted a gain. The setback on Friday left investors still waiting for more significant gains from the major indices backed by heavier volume, action which would be a meaningful improvement that more convincingly argues the Market (M criteria) is shifting back to a confirmed uptrend. Meanwhile, caution is still warranted. Keep in mind that any sustained and meaningful market advance requires leadership - a healthy crop of stocks hitting new 52-week highs.
The major averages were mostly higher as M&A news in the health care sector offset weakness in financials. Pfizer (PFE +4.2%) amid reports the drug maker is attempting to renew takeover talks with AstraZeneca. Bank of America (BAC -6.2%) after suspending its dividend and buyback due to an error in calculating its capital ratios.
On the economic front, a report showed pending home sales unexpectedly rose 3.4% in March. Among earnings releases, Corning (GLW +1.1%) after quarterly results topped consensus estimates. Investors also kept an eye on Eastern Europe as the U.S. and European Union announced additional sanctions against Russia over the conflict in Ukraine.
Seven of 10 sectors in the S&P 500 were up. Telecom and technology rose the most on the session. AT&T (T +1.7%). Apple (AAPL +3.9%) to counter Facebook (FB +2.7%). Materials were the worst performing group. Shares of Newmont Mining (NEM -6.7%).
Treasuries declined with the 10-year note off 9/32 to yield 2.70%.
The CANSLIM.net Featured Stocks Page shows the most action-worthy candidates and their latest notes and a Headline Link directs members to the latest detailed analysis with data-packed graphs annotated by a Certified expert along with links to additional resources. The Premium Member Homepage includes "dynamic archives" to all prior pay reports published. Watch for an announcement via email concerning the next WEBCAST.
PICTURED: The Nasdaq Composite Index slumped toward its 50-day moving average (DMA) line.
|
 Kenneth J. Gruneisen started out as a licensed stockbroker in August 1987, a couple of months prior to the historic stock market crash that took the Dow Jones Industrial Average down -22.6% in a single day. He has published daily fact-based fundamental and technical analysis on high-ranked stocks online for two decades. Through FACTBASEDINVESTING.COM, Kenneth provides educational articles, news, market commentary, and other information regarding proven investment systems that work in good times and bad.
Comments contained in the body of this report are technical opinions only and are not necessarily those of Gruneisen Growth Corp. The material herein has been obtained from sources believed to be reliable and accurate, however, its accuracy and completeness cannot be guaranteed. Our firm, employees, and customers may effect transactions, including transactions contrary to any recommendation herein, or have positions in the securities mentioned herein or options with respect thereto. Any recommendation contained in this report may not be suitable for all investors and it is not to be deemed an offer or solicitation on our part with respect to the purchase or sale of any securities. |
|
 |
Financial, Tech, and Gold & Silver Indexes Fell
Kenneth J. Gruneisen - Passed the CAN SLIM® Master's Exam
The financial group was a negative influence on the major averages as the Bank Index ($BKX -1.21%) and the Broker/Dealer Index ($XBD -1.07%) fell on Monday. The Networking Index ($NWX -1.14%) and Semiconductor Index ($SOX -0.64%) weighed negatrively onthe tech-heavy Nasdaq while the Biotechnology Index ($BTK +0.26%) eked out a smal gain. Energy-related shares were mixed as the Integrated Oil Index ($XOI +0.72%) rose while the Oil Services Index ($OSX -1.08%) fell. The Gold & Silver Index ($XAU -2.08%) was a standout decliner.
Charts courtesy www.stockcharts.com
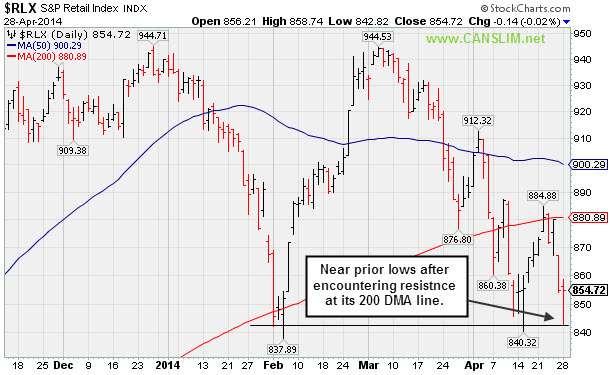
PICTURED: The Retail Index ($RLX -0.02%) finished flat. It is sputtering near prior lows after encountering resistance at its longer-term 200-day moving average line.
| Oil Services |
$OSX |
292.47 |
-3.19 |
-1.08% |
+4.07% |
| Integrated Oil |
$XOI |
1,601.38 |
+11.41 |
+0.72% |
+6.54% |
| Semiconductor |
$SOX |
568.55 |
-3.64 |
-0.64% |
+6.27% |
| Networking |
$NWX |
323.83 |
-3.75 |
-1.14% |
-0.03% |
| Broker/Dealer |
$XBD |
152.73 |
-1.65 |
-1.07% |
-4.88% |
| Retail |
$RLX |
854.72 |
-0.14 |
-0.02% |
-9.05% |
| Gold & Silver |
$XAU |
91.37 |
-1.94 |
-2.08% |
+8.58% |
| Bank |
$BKX |
67.72 |
-0.83 |
-1.21% |
-2.22% |
| Biotech |
$BTK |
2,422.86 |
+6.33 |
+0.26% |
+3.97% |
|
|
|
 |
Stength Contiunues; Earnings Below +25% Minimum Guideline for a 2nd Quarter
Kenneth J. Gruneisen - Passed the CAN SLIM® Master's Exam
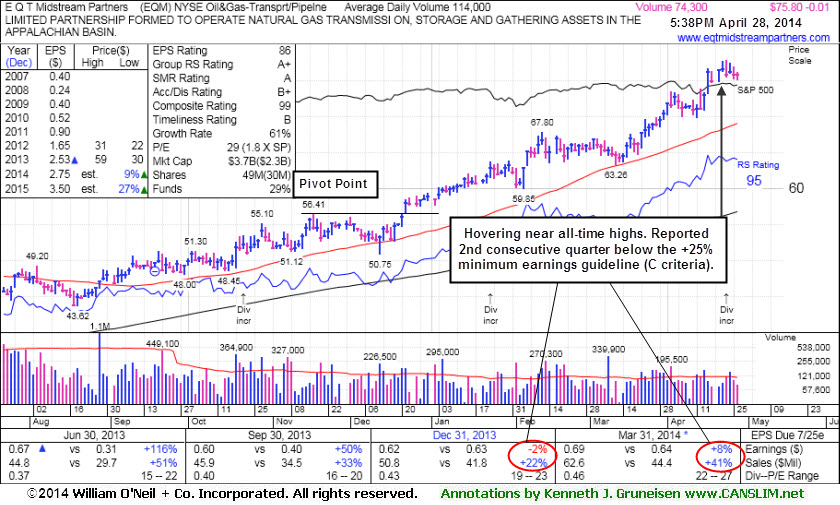
E Q T Midstream Partners (EQM -$0.01 or -0.01% to $75.80) has been stubbornly holding its ground and making gradual progress. It reported earnings +8% on +41% sales revenues for the Mar '14 quarter, a 2nd consecutive quarterly comparison below the +25% minimum earnings guideline (C criteria). Its 50-day moving average (DMA) line ($69.01 now) defines near-term support where a subsequent violation may trigger a technical sell signal.
Its last appearance in this FSU section was on 4/09/14 under the headline, "Technical Strength Continues Despite Fundamental Concerns". It traded up as much as +46.27% since first highlighted in yellow in the 12/12/13 mid-day report (read here) with new pivot point cited based on its 11/18/13 high plus 10 cents. The fact-based system suggests watching for technical sell signals rather than selling purely on fundmentals, yet is wise to sometimes lock in gains at the +20% level. For those watching it and still giving it the benefit of the doubt, its 50-day moving average (DMA) line defines support for the nearc term, while subsequent violations may trigger more worrisome technical sell signals.
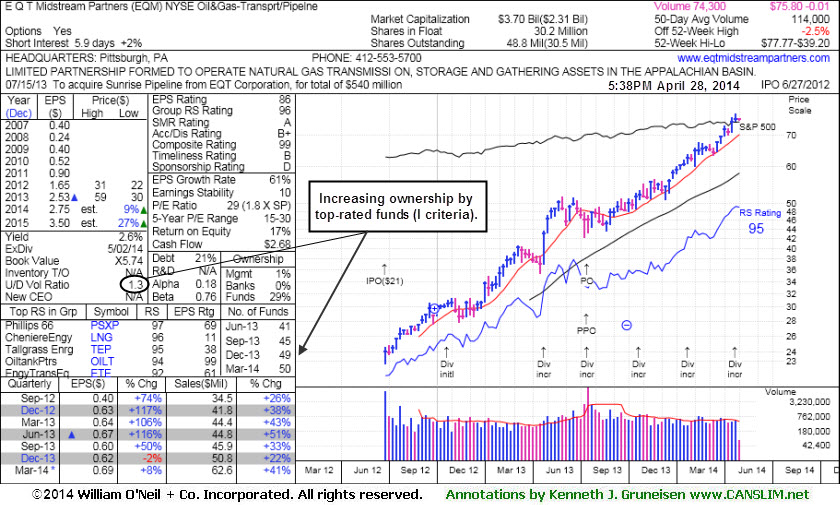
It completed a new Public Offering on 7/16/13, then made gradual progress afterward. This MLP in the Natural Gas business has seen the number of top-rated funds owning its shares rise from 20 in Jun '12 to 50 in Mar '14, a reassuring sign concerning the I criteria. Its Up/Down Volume Ratio of 1.3 is an unbiased indication its shares have been under accumulation over the past 50 days.
|
|
|
Color Codes Explained :
Y - Better candidates highlighted by our
staff of experts.
G - Previously featured
in past reports as yellow but may no longer be buyable under the
guidelines.
***Last / Change / Volume data in this table is the closing quote data***
Symbol/Exchange
Company Name
Industry Group |
PRICE |
CHANGE
(%Change) |
Day High |
Volume
(% DAV)
(% 50 day avg vol) |
52 Wk Hi
% From Hi |
Featured
Date |
Price
Featured |
Pivot Featured |
|
Max Buy |
EQM
-
NYSE
E Q T Midstream Partners
ENERGY - Oil and Gas Pipelines
|
$75.80
|
-0.01
-0.01% |
$76.15
|
74,360
65.23% of 50 DAV
50 DAV is 114,000
|
$77.77
-2.53%
|
12/12/2013
|
$53.17
|
PP = $56.51
|
|
MB = $59.34
|
Most Recent Note - 4/24/2014 6:08:34 PM
G - Hovering at its all-time high and in strong shape, technically, despite fundamental concerns recently noted. Its 50 DMA line ($68.61) defines near-term support where a violation may trigger a technical sell signal.
>>> FEATURED STOCK ARTICLE : Stength Contiunues; Earnings Below +25% Minimum Guideline for a 2nd Quarter - 4/28/2014
View all notes |
Set NEW NOTE alert |
CANSLIM.net Company Profile |
SEC
News |
Chart |
Request a new note
C
A N
S L
I M


|
GNRC
-
NYSE
Generac Hldgs Inc
Electrical-Power/Equipmt
|
$58.76
|
+0.71
1.22% |
$59.99
|
801,568
119.28% of 50 DAV
50 DAV is 672,000
|
$62.50
-5.98%
|
2/14/2014
|
$56.50
|
PP = $57.39
|
|
MB = $60.26
|
Most Recent Note - 4/24/2014 6:10:00 PM
Y - Edged higher today for its 8th consecutive small gain on below average volume. Found support near its 50 DMA line and prior highs in the $57 area recently. More damaging losses below its recent low ($55.27 on 4/14/14) would raise greater concerns.
>>> FEATURED STOCK ARTICLE : Finished Just Below its 50-Day Average Line - 4/11/2014
View all notes |
Set NEW NOTE alert |
CANSLIM.net Company Profile |
SEC
News |
Chart |
Request a new note
C
A N
S L
I M
|
ICON
-
NASDAQ
Iconix Brand Group Inc
CONSUMER NON-DURABLES - Textile - Apparel Footwear
|
$39.68
|
+0.81
2.08% |
$39.97
|
991,973
171.92% of 50 DAV
50 DAV is 577,000
|
$42.47
-6.56%
|
3/7/2014
|
$41.46
|
PP = $40.88
|
|
MB = $42.92
|
 Most Recent Note - 4/28/2014 12:00:23 PM
G - Small gap up today, rebounding near its 50 DMA line (now $39.49). Faces a little near-term resistance due to overhead supply up through the $42 level.
>>> FEATURED STOCK ARTICLE : Rebound Above 50-Day Average Needed to Improve Outlook - 4/24/2014
View all notes |
Set NEW NOTE alert |
CANSLIM.net Company Profile |
SEC
News |
Chart |
Request a new note
C
A N
S L
I M
|
PSIX
-
NASDAQ
Power Solutions Intl Inc
Machinery-Gen Industrial
|
$81.50
|
+0.39
0.48% |
$82.10
|
108,614
159.73% of 50 DAV
50 DAV is 68,000
|
$87.40
-6.75%
|
2/28/2014
|
$74.65
|
PP = $76.93
|
|
MB = $80.78
|
Most Recent Note - 4/24/2014 6:07:20 PM
G- Posted a gain today with higher volume and it is perched within close striking distance of its 52-week high. The recent low ($66.03 on 4/07/14) defines important near-term support below the 50 DMA line where further deterioration would raise greater concerns.
>>> FEATURED STOCK ARTICLE : Halted Slide After Slump Below 50-Day Moving Average - 4/14/2014
View all notes |
Set NEW NOTE alert |
CANSLIM.net Company Profile |
SEC
News |
Chart |
Request a new note
C
A N
S L
I M
|
|
|
|
THESE ARE NOT BUY RECOMMENDATIONS!
Comments contained in the body of this report are technical
opinions only. The material herein has been obtained
from sources believed to be reliable and accurate, however,
its accuracy and completeness cannot be guaranteed.
This site is not an investment advisor, hence it does
not endorse or recommend any securities or other investments.
Any recommendation contained in this report may not
be suitable for all investors and it is not to be deemed
an offer or solicitation on our part with respect to
the purchase or sale of any securities. All trademarks,
service marks and trade names appearing in this report
are the property of their respective owners, and are
likewise used for identification purposes only.
This report is a service available
only to active Paid Premium Members.
You may opt-out of receiving report notifications
at any time. Questions or comments may be submitted
by writing to Premium Membership Services 665 S.E. 10 Street, Suite 201 Deerfield Beach, FL 33441-5634 or by calling 1-800-965-8307
or 954-785-1121.
|
|
|

