You are not logged in.
This means you
CAN ONLY VIEW reports that were published prior to Monday, April 14, 2025.
You
MUST UPGRADE YOUR MEMBERSHIP if you want to see any current reports.
AFTER MARKET UPDATE - FRIDAY, APRIL 29TH, 2011
Previous After Market Report Next After Market Report >>>
|
|
|
|
DOW |
+47.23 |
12,810.54 |
+0.37% |
|
Volume |
975,222,440 |
+1% |
|
Volume |
2,385,044,820 |
+24% |
|
NASDAQ |
+1.01 |
2,873.54 |
+0.04% |
|
Advancers |
1,958 |
62% |
|
Advancers |
1,433 |
53% |
|
S&P 500 |
+3.13 |
1,363.61 |
+0.23% |
|
Decliners |
1,049 |
33% |
|
Decliners |
1,164 |
43% |
|
Russell 2000 |
+3.74 |
865.29 |
+0.43% |
|
52 Wk Highs |
361 |
|
|
52 Wk Highs |
200 |
|
|
S&P 600 |
+0.72 |
457.95 |
+0.16% |
|
52 Wk Lows |
13 |
|
|
52 Wk Lows |
20 |
|
|
Today we have a question from a member concerning "late-stage" bases. Many members have told us they enjoy the occasional "Ken's Mailbag" included below the FSU table near the bottom of the evening report. These segments share a recent Q&A between CANSLIM.net's founder, Kenneth J. Gruneisen, and a member who has written in with a question concerning our services or a stock they are curious about. Please feel free to submit your questions or any feedback you have for us via the inquiry form - click here.
|
 |
Major Averages Finished April At New Recovery Highs
Kenneth J. Gruneisen - Passed the CAN SLIM® Master's Exam
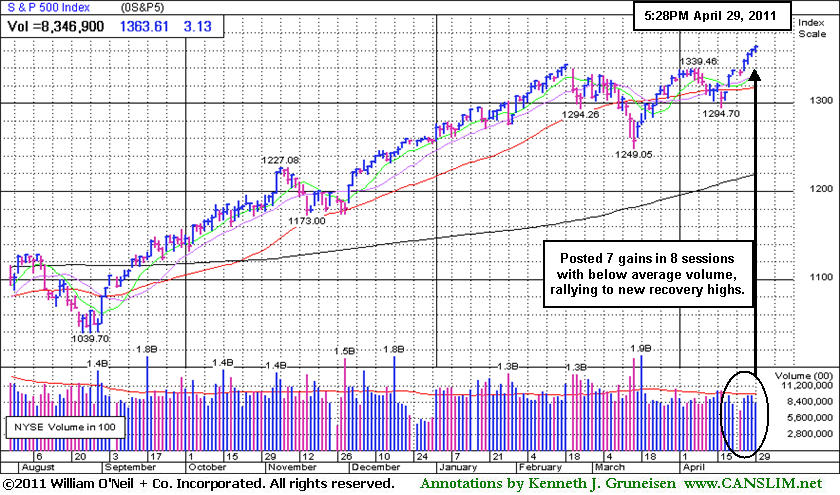
For the week the Dow Jones Industrial Average rose +2.4%, the S&P 500 Index gained +2.0%, and the Nasdaq Composite Index was up +1.9%. Volume totals were reported slightly higher than the prior session totals on both major stock exchanges, inflated by month-end window dressing. Advancing issues beat decliners by 9-5 on the NYSE and by 4-3 on the Nasdaq. New 52-week highs solidly outnumbered new 52-week lows on the NYSE and on the Nasdaq exchange. There were 101 high-ranked companies from the CANSLIM.net Leaders List that made new 52-week highs and appeared on the CANSLIM.net BreakOuts Page, up from the total of 82 on the prior session. On the Featured Stocks Page there were gains from 15 of the 20 high-ranked market leaders currently listed. New set-ups with strong characteristics and fresh breakouts from high-ranked leaders have been scarce in recent weeks, even while the major averages have rallied.
Earnings were the focus on Wall Street, yet gold gained 1% to a record settlement price in New York over $1,556 an ounce as the dollar continued its descent. Energy stocks came up winners as oil capped an eighth straight month of gains, settling at nearly $114 per barrel in New York.
The Dow added to its best weekly gain in a month, while the Nasdaq struggled in quiet trading before closing slightly higher. Caterpillar Inc (CAT +2.5%), Merck & Co Inc (MRK +0.50%), and Chevron Corp (CVX +0.58%) helped the Dow advance after each company reported better-than-expected profits. Microsoft Corp (MSFT -2.96%) and Research in Motion Ltd (RIMM -14.03%) were a drag on the tech-heavy Nasdaq Composite Index . Microsoft posted disappointing sales in its Windows division, while Research in Motion cut its earnings forecast.
On Wednesday this week the Nasdaq Composite Index topped its October 2007 high. Regular readers of this commentary may recall earlier this year as we observed the S&P Mid-Cap 400 Index and S&P Small-Cap 600 Index each hitting new all-time highs. Earnings reports will continue to be a factor next week, and volume and volatility are often greater near earnings announcements.
Be ready for the May 2011 issue of CANSLIM.net News to be released soon! CANSLIM.net News includes a comprehensive summary of market action, leading industry groups, the most action-worthy leaders, and more. Only upgraded members can access CANSLIM.net News.
PICTURED: The S&P 500 Index has posted gains in 7 of the past 8 sessions with below average volume while rallying to new recovery highs. The benchmark index rallied +2.8% during the month of April.
|
 Kenneth J. Gruneisen started out as a licensed stockbroker in August 1987, a couple of months prior to the historic stock market crash that took the Dow Jones Industrial Average down -22.6% in a single day. He has published daily fact-based fundamental and technical analysis on high-ranked stocks online for two decades. Through FACTBASEDINVESTING.COM, Kenneth provides educational articles, news, market commentary, and other information regarding proven investment systems that work in good times and bad.
Comments contained in the body of this report are technical opinions only and are not necessarily those of Gruneisen Growth Corp. The material herein has been obtained from sources believed to be reliable and accurate, however, its accuracy and completeness cannot be guaranteed. Our firm, employees, and customers may effect transactions, including transactions contrary to any recommendation herein, or have positions in the securities mentioned herein or options with respect thereto. Any recommendation contained in this report may not be suitable for all investors and it is not to be deemed an offer or solicitation on our part with respect to the purchase or sale of any securities. |
|
 |
Commodity-Linked Groups Posted Best Gains
Kenneth J. Gruneisen - Passed the CAN SLIM® Master's Exam
Commodity-linked groups posted gains as the Gold & Silver Index ($XAU +0.83%), Oil Services Index ($OSX +0.67%), and Integrated Oil Index ($XOI +1.89%) finished higher on Friday. Modest losses from the influential Retail Index ($RLX -0.36%) and financial groups including the Broker/Dealer Index ($XBD -0.24%) and Bank Index ($BKX -0.23%) weighed on the major averages, limiting their ability to make greater progress. The Semiconductor Index ($SOX +0.45%) and Networking Index ($NWX +0.57%) made modest gains but the Internet Index ($IIX -0.16%) ended with a small loss and the Biotechnology Index ($BTK -1.88%) was a laggard. The Healthcare Index ($HMO -0.51%) also pulled back.
Charts courtesy www.stockcharts.com
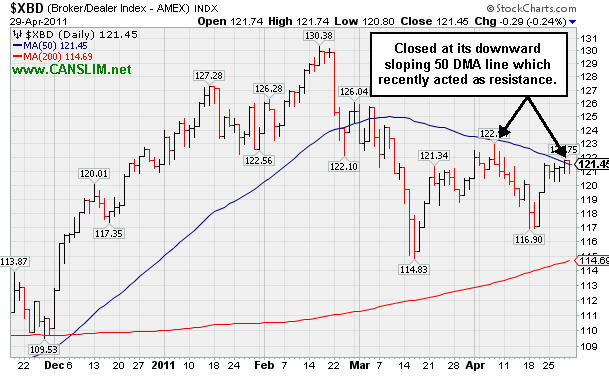
PICTURED: The Broker/Dealer Index ($XBD -0.24%) closed at its downward sloping 50-day moving average (DMA) line which recently acted as resistance.
| Oil Services |
$OSX |
288.33 |
+1.91 |
+0.67% |
+17.63% |
| Healthcare |
$HMO |
2,331.04 |
-11.97 |
-0.51% |
+37.77% |
| Integrated Oil |
$XOI |
1,402.96 |
+25.96 |
+1.89% |
+15.64% |
| Semiconductor |
$SOX |
449.56 |
+2.02 |
+0.45% |
+9.16% |
| Networking |
$NWX |
340.54 |
+1.93 |
+0.57% |
+21.38% |
| Internet |
$IIX |
326.69 |
-0.52 |
-0.16% |
+6.16% |
| Broker/Dealer |
$XBD |
121.45 |
-0.30 |
-0.24% |
-0.06% |
| Retail |
$RLX |
540.50 |
-1.95 |
-0.36% |
+6.32% |
| Gold & Silver |
$XAU |
222.22 |
+1.83 |
+0.83% |
-1.92% |
| Bank |
$BKX |
51.53 |
-0.12 |
-0.23% |
-1.30% |
| Biotech |
$BTK |
1,462.10 |
-28.06 |
-1.88% |
+12.67% |
|
|
|
 |
Overhead Supply Can Be the Source of Resistance
Kenneth J. Gruneisen - Passed the CAN SLIM® Master's Exam
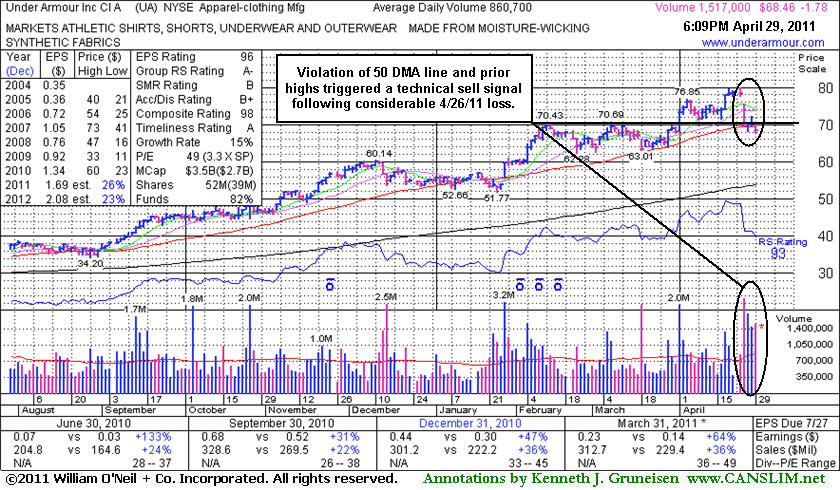
Under Armour Inc (UA -$1.78 or -2.53% to $68.46) suffered another damaging loss today with above average volume that led to a close below its 50-day moving average (DMA) line and under prior chart highs. The deterioration raised concerns and triggered a technical sell signal. Following its last appearance in this FSU section on 4/01/11 with an annotated graph under the headline, "Under Accumulation", it soon traded above its 2007 all-time high ($73.40) and rallied even further with above average volume. However, it was down considerably with heavy volume on 4/26/11 after reporting earnings +64% on +36% sales revenues for the quarter ended March 31, 2011 versus the year ago period.
A prompt rebound above that short-term average would help its outlook. That is where institutional owners often accumulate more shares and add to current holdings when they view a company's outlook as still favorable. Whenever a stock slices below the 50 DMA line and volume swells behind damaging losses, concerns increase because it is clear some institutional holders are headed for the exits, rather than accumulating near that important short-term average. While above average demand recently drove it to new highs, one must wonder where the enthusiastic buyers are hiding as it suddenly gives back the hard fought gains and falls on even heavier volume. The number of top-rated funds owning its shares rose from 308 in Mar '10 to 415 in Mar '11, so it had been showing very reassuring signs concerning the I criteria.
Rather than bargain hunting, disciplined investors might sooner consider any fresh breakouts that might emerge. Keep in mind that UA now faces resistance due to overhead supply created while it traded at higher levels for the past month. Earlier notes had acknowledged the downward turn in annual earnings (A criteria) in FY '08, a concern with respect to the fact-based investment system.
|
|
|
Color Codes Explained :
Y - Better candidates highlighted by our
staff of experts.
G - Previously featured
in past reports as yellow but may no longer be buyable under the
guidelines.
***Last / Change / Volume data in this table is the closing quote data***
Symbol/Exchange
Company Name
Industry Group |
PRICE |
CHANGE
(%Change) |
Day High |
Volume
(% DAV)
(% 50 day avg vol) |
52 Wk Hi
% From Hi |
Featured
Date |
Price
Featured |
Pivot Featured |
|
Max Buy |
AIXG
-
NASDAQ
Aixtron Se
ELECTRONICS - Semiconductor Equipment andamp; Mate
|
$42.45
|
+0.34
0.81% |
$42.88
|
223,916
86.02% of 50 DAV
50 DAV is 260,300
|
$44.96
-5.58%
|
4/5/2011
|
$44.14
|
PP = $44.64
|
|
MB = $46.87
|
Most Recent Note - 4/28/2011 10:54:28 AM
G - Gapped down today after a solid gain and strong close on the prior session, slumping back near its 50 DMA line. Still perched only -6.1% off its all-time high. Rebound above its 50 DMA was noted as a technical improvement that helped its outlook after it recently found support near prior lows in the $38 area.
>>> The latest Featured Stock Update with an annotated graph appeared on 4/5/2011. Click here.
View all notes |
Alert me of new notes |
CANSLIM.net Company Profile |
SEC |
Zacks Reports |
StockTalk |
News |
Chart |
Request a new note
C
A N
S L
I M


|
BIDU
-
NASDAQ
Baidu Inc Ads
INTERNET - Internet Information Providers
|
$148.52
|
+0.27
0.18% |
$150.89
|
8,932,495
122.43% of 50 DAV
50 DAV is 7,295,900
|
$156.04
-4.82%
|
3/17/2011
|
$121.97
|
PP = $131.73
|
|
MB = $138.32
|
Most Recent Note - 4/28/2011 12:26:21 PM
G - Reported earnings +129% on +96% sales revenues for the quarter ended March 31, 2011 versus the year ago period. Touched another new all-time high early today then reversed into the red. It has been repeatedly noted - "Extended from its latest base. Prior high near $131 defines initial chart support to watch near its rising 50 DMA line."
>>> The latest Featured Stock Update with an annotated graph appeared on 4/7/2011. Click here.
View all notes |
Alert me of new notes |
CANSLIM.net Company Profile |
SEC |
Zacks Reports |
StockTalk |
News |
Chart |
Request a new note
C
A N
S L
I M
|
CMG
-
NYSE
Chipotle Mexican Grill
LEISURE - Restaurants
|
$266.79
|
+1.15
0.43% |
$268.00
|
663,752
56.76% of 50 DAV
50 DAV is 1,169,300
|
$289.35
-7.80%
|
4/1/2011
|
$274.00
|
PP = $275.10
|
|
MB = $288.86
|
Most Recent Note - 4/27/2011 4:59:48 PM
G - Small loss today came on 8 times average volume while it nearly tested its 50 DMA line ($261.81 now), an important chart support level. Recently negated its latest technical breakout. Gapped down on 4/21/11 after reporting earnings +23% on +24% sales revenues for the quarter ended March 31, 2011 versus the year ago period, its weakest earnings increase in years, and below the +25% guideline.
>>> The latest Featured Stock Update with an annotated graph appeared on 4/13/2011. Click here.
View all notes |
Alert me of new notes |
CANSLIM.net Company Profile |
SEC |
Zacks Reports |
StockTalk |
News |
Chart |
Request a new note
C
A N
S L
I M
|
CTSH
-
NASDAQ
Cognizant Tech Sol Cl A
COMPUTER SOFTWARE and SERVICES - Business Software and Services
|
$82.90
|
+1.46
1.79% |
$83.23
|
3,036,975
139.18% of 50 DAV
50 DAV is 2,182,000
|
$82.93
-0.04%
|
2/7/2011
|
$75.09
|
PP = $76.46
|
|
MB = $80.28
|
Most Recent Note - 4/27/2011 5:23:06 PM
G - Holding its ground -1.4% off its all-time high. Reporting earnings on Tuesday, May 3rd before the open. Last week it tested prior highs in the $77-78 area and its 50 DMA line and found prompt support.
>>> The latest Featured Stock Update with an annotated graph appeared on 4/15/2011. Click here.
View all notes |
Alert me of new notes |
CANSLIM.net Company Profile |
SEC |
Zacks Reports |
StockTalk |
News |
Chart |
Request a new note
C
A N
S L
I M
|
DECK
-
NASDAQ
Deckers Outdoor Corp
CONSUMER NON-DURABLES - Textile - Apparel Footwear
|
$84.86
|
-9.59
-10.15% |
$89.67
|
3,948,447
296.94% of 50 DAV
50 DAV is 1,329,700
|
$97.00
-12.52%
|
2/3/2011
|
$79.61
|
PP = $82.67
|
|
MB = $86.80
|
 Most Recent Note - 4/29/2011 5:10:43 PM
Raising serious concerns, it violated its 50 DMA line and closed near the session low with a damaging gap down and loss today triggering a technical sell signal. The heavy distributional pressure followed an earnings report with an increase less than the investment system's +25% minimum guideline. Reported earnings only +7% on +31% sales revenues for the quarter ended March 31, 2011 versus the year ago period. Based on the fundamental and technical weakness it will be dropped from the featured stocks list tonight.
>>> The latest Featured Stock Update with an annotated graph appeared on 4/6/2011. Click here.
View all notes |
Alert me of new notes |
CANSLIM.net Company Profile |
SEC |
Zacks Reports |
StockTalk |
News |
Chart |
Request a new note
C
A N
S L
I M
|
Symbol/Exchange
Company Name
Industry Group |
PRICE |
CHANGE
(%Change) |
Day High |
Volume
(% DAV)
(% 50 day avg vol) |
52 Wk Hi
% From Hi |
Featured
Date |
Price
Featured |
Pivot Featured |
|
Max Buy |
EZPW
-
NASDAQ
Ezcorp Inc Cl A
SPECIALTY RETAIL - Specialty Retail, Other
|
$31.49
|
+0.55
1.78% |
$31.88
|
265,003
71.58% of 50 DAV
50 DAV is 370,200
|
$33.08
-4.81%
|
2/18/2011
|
$27.94
|
PP = $30.04
|
|
MB = $31.54
|
Most Recent Note - 4/28/2011 5:20:24 PM
G - Closed near the session high today, rebounding further above its 50 DMA line and prior highs in the $29-30 area after negating its recent breakout. It has not formed a sound new base pattern. Reported earnings +31% on +21% sales revenues for the quarter ended March 31, 2011 versus the year ago period.
>>> The latest Featured Stock Update with an annotated graph appeared on 4/11/2011. Click here.
View all notes |
Alert me of new notes |
CANSLIM.net Company Profile |
SEC |
Zacks Reports |
StockTalk |
News |
Chart |
Request a new note
C
A N
S L
I M
|
FOSL
-
NASDAQ
Fossil Inc
CONSUMER DURABLES - Recreational Goods, Other
|
$95.78
|
-0.09
-0.09% |
$96.25
|
599,628
67.99% of 50 DAV
50 DAV is 882,000
|
$96.99
-1.25%
|
2/1/2011
|
$73.30
|
PP = $74.44
|
|
MB = $78.16
|
Most Recent Note - 4/27/2011 5:28:24 PM
G - Stubbornly holding its ground with volume totals cooling while perched near its all-time high. Previously noted - "It rallied more than +108% higher in 8 months since first featured in yellow in the 8/10/10 mid-day report (read here). It could produce more climactic gains, but recently it has been noted - "Extended from any sound base. Prior highs in the $83-85 area define chart support to watch above its 50 DMA line."
>>> The latest Featured Stock Update with an annotated graph appeared on 3/30/2011. Click here.
View all notes |
Alert me of new notes |
CANSLIM.net Company Profile |
SEC |
Zacks Reports |
StockTalk |
News |
Chart |
Request a new note
C
A N
S L
I M
|
HMSY
-
NASDAQ
H M S Holdings Corp
COMPUTER SOFTWARE and SERVICES - Healthcare Information Service
|
$78.71
|
-1.55
-1.93% |
$79.95
|
814,038
487.45% of 50 DAV
50 DAV is 167,000
|
$84.82
-7.20%
|
11/19/2010
|
$61.89
|
PP = $63.01
|
|
MB = $66.16
|
Most Recent Note - 4/29/2011 4:30:43 PM
G - Finished near the middle of its intra-day range -7.2% below its all-time high. A gap down today technically violated its 50 DMA line with a loss on heavy volume after reporting earnings +26% on +27% sales revenues for the quarter ended March 31, 2011 versus the year ago period.
>>> The latest Featured Stock Update with an annotated graph appeared on 4/26/2011. Click here.
View all notes |
Alert me of new notes |
CANSLIM.net Company Profile |
SEC |
Zacks Reports |
StockTalk |
News |
Chart |
Request a new note
C
A N
S L
I M
|
HS
-
NYSE
Healthspring Inc
HEALTH SERVICES - Health Care Plans
|
$41.49
|
+0.27
0.66% |
$41.53
|
1,763,092
197.97% of 50 DAV
50 DAV is 890,600
|
$41.53
-0.10%
|
3/22/2011
|
$38.29
|
PP = $38.85
|
|
MB = $40.79
|
Most Recent Note - 4/29/2011 4:32:16 PM
G - Small gain today with above average volume, rising further above its "max buy" level. Its 50 DMA line ($37.99 now) defines important support above recent lows in the $35.50 area.
>>> The latest Featured Stock Update with an annotated graph appeared on 4/21/2011. Click here.
View all notes |
Alert me of new notes |
CANSLIM.net Company Profile |
SEC |
Zacks Reports |
StockTalk |
News |
Chart |
Request a new note
C
A N
S L
I M
|
INFA
-
NASDAQ
Informatica Corp
COMPUTER SOFTWARE and SERVICES - Business Software and Services
|
$56.01
|
+1.31
2.39% |
$56.33
|
1,321,118
130.79% of 50 DAV
50 DAV is 1,010,100
|
$55.10
1.65%
|
3/24/2011
|
$50.04
|
PP = $49.86
|
|
MB = $52.35
|
Most Recent Note - 4/29/2011 4:22:18 PM
G - Small gap up gain today with above average volume for another new 52-week high, getting more extended from its latest base. Prior highs in the $49 area define support to watch coinciding with its 50 DMA line.
>>> The latest Featured Stock Update with an annotated graph appeared on 4/27/2011. Click here.
View all notes |
Alert me of new notes |
CANSLIM.net Company Profile |
SEC |
Zacks Reports |
StockTalk |
News |
Chart |
Request a new note
C
A N
S L
I M
|
Symbol/Exchange
Company Name
Industry Group |
PRICE |
CHANGE
(%Change) |
Day High |
Volume
(% DAV)
(% 50 day avg vol) |
52 Wk Hi
% From Hi |
Featured
Date |
Price
Featured |
Pivot Featured |
|
Max Buy |
LULU
-
NASDAQ
Lululemon Athletica
MANUFACTURING - Textile Manufacturing
|
$100.05
|
+0.72
0.72% |
$100.67
|
1,001,591
44.59% of 50 DAV
50 DAV is 2,246,000
|
$102.83
-2.70%
|
3/28/2011
|
$68.11
|
PP = $85.38
|
|
MB = $89.65
|
Most Recent Note - 4/27/2011 4:50:48 PM
G - Perched near its all-time high, this high-ranked Retail-Apparel firm is extended from any sound base pattern. Prior highs and its 50 DMA line in the $85 area define important chart support to watch.
>>> The latest Featured Stock Update with an annotated graph appeared on 3/31/2011. Click here.
View all notes |
Alert me of new notes |
CANSLIM.net Company Profile |
SEC |
Zacks Reports |
StockTalk |
News |
Chart |
Request a new note
C
A N
S L
I M
|
MG
-
NYSE
Mistras Group Inc
DIVERSIFIED SERVICES - Bulding and Faci;ity Management Services
|
$18.32
|
+0.06
0.33% |
$18.38
|
72,688
56.92% of 50 DAV
50 DAV is 127,700
|
$18.46
-0.76%
|
3/15/2011
|
$15.48
|
PP = $15.90
|
|
MB = $16.70
|
Most Recent Note - 4/27/2011 5:34:52 PM
G - Stubbornly holding its ground, extended from any sound base pattern. Its 50 DMA line and prior highs define important support to watch.
>>> The latest Featured Stock Update with an annotated graph appeared on 4/12/2011. Click here.
View all notes |
Alert me of new notes |
CANSLIM.net Company Profile |
SEC |
Zacks Reports |
StockTalk |
News |
Chart |
Request a new note
C
A N
S L
I M
|
MWIV
-
NASDAQ
M W I Veterinary Supply
HEALTH SERVICES - Medical Instruments and; Supplies
|
$83.17
|
+1.82
2.24% |
$83.91
|
78,186
75.91% of 50 DAV
50 DAV is 103,000
|
$84.97
-2.12%
|
11/4/2010
|
$61.79
|
PP = $59.60
|
|
MB = $62.58
|
Most Recent Note - 4/29/2011 4:24:38 PM
G - Gain today with quiet volume, finishing -2.2% off its all-time high. Extended from any sound base pattern, its 50 DMA line defines important support to watch. Since first featured in yellow on 7/29/10 it has traded as much as +63% higher.
>>> The latest Featured Stock Update with an annotated graph appeared on 4/8/2011. Click here.
View all notes |
Alert me of new notes |
CANSLIM.net Company Profile |
SEC |
Zacks Reports |
StockTalk |
News |
Chart |
Request a new note
C
A N
S L
I M
|
OPEN
-
NASDAQ
Opentable Inc
INTERNET - Internet Software and Services
|
$111.29
|
+2.57
2.36% |
$111.54
|
644,925
54.21% of 50 DAV
50 DAV is 1,189,600
|
$118.66
-6.21%
|
3/17/2011
|
$90.71
|
PP = $96.07
|
|
MB = $100.87
|
Most Recent Note - 4/29/2011 4:20:08 PM
G - Reporting earnings on Tuesday, May 3rd for the quarter ended March 31, 2011. It could produce more climactic gains, but has been repeatedly noted - "Extended from its latest base. Prior highs near $96 and its 50 DMA line define support to watch on pullbacks."
>>> The latest Featured Stock Update with an annotated graph appeared on 4/25/2011. Click here.
View all notes |
Alert me of new notes |
CANSLIM.net Company Profile |
SEC |
Zacks Reports |
StockTalk |
News |
Chart |
Request a new note
C
A N
S L
I M
|
PAY
-
NYSE
Verifone Systems Inc
COMPUTER HARDWARE - Transaction Automation Systems
|
$54.82
|
+1.18
2.20% |
$54.97
|
1,337,450
55.72% of 50 DAV
50 DAV is 2,400,300
|
$58.88
-6.90%
|
4/29/2011
|
$54.73
|
PP = $58.98
|
|
MB = $61.93
|
Most Recent Note - 4/29/2011 4:18:12 PM
Y - It has been consolidating above its 50 DMA line ($51.56 now) and formed a short flat base, albeit a riskier "late-stage" base. Color code is changed to yellow with a new pivot point cited based on its 52-week high plus 10 cents. The "Ken's Mailbag" Q&A in today's After Market Update includes more details about late-stage bases.
>>> The latest Featured Stock Update with an annotated graph appeared on 4/4/2011. Click here.
View all notes |
Alert me of new notes |
CANSLIM.net Company Profile |
SEC |
Zacks Reports |
StockTalk |
News |
Chart |
Request a new note
C
A N
S L
I M
|
Symbol/Exchange
Company Name
Industry Group |
PRICE |
CHANGE
(%Change) |
Day High |
Volume
(% DAV)
(% 50 day avg vol) |
52 Wk Hi
% From Hi |
Featured
Date |
Price
Featured |
Pivot Featured |
|
Max Buy |
PCLN
-
NASDAQ
Priceline.Com Inc
INTERNET - Internet Software and Services
|
$547.01
|
-3.02
-0.55% |
$556.27
|
1,131,257
96.29% of 50 DAV
50 DAV is 1,174,900
|
$551.17
-0.75%
|
1/3/2011
|
$399.55
|
PP = $428.20
|
|
MB = $449.61
|
Most Recent Note - 4/27/2011 5:37:39 PM
G - Stubbornly holding its ground near its 52-week high with volume totals cooling. It may go on to produce more climactic gains, yet it has been repeatedly noted - "Extended from any sound base pattern. Its 50 DMA line has defined support throughout its advance."
>>> The latest Featured Stock Update with an annotated graph appeared on 4/20/2011. Click here.
View all notes |
Alert me of new notes |
CANSLIM.net Company Profile |
SEC |
Zacks Reports |
StockTalk |
News |
Chart |
Request a new note
C
A N
S L
I M
|
RAX
-
NYSE
Rackspace Hosting Inc
INTERNET - Internet Software and; Services
|
$46.19
|
+0.43
0.94% |
$46.50
|
963,217
59.81% of 50 DAV
50 DAV is 1,610,500
|
$46.28
-0.19%
|
3/16/2011
|
$36.28
|
PP = $40.72
|
|
MB = $42.76
|
Most Recent Note - 4/27/2011 4:45:46 PM
G - Rallied for a new all-time high today, getting more extended from any sound base. Prior highs near $40 define support above its 50 DMA line.
>>> The latest Featured Stock Update with an annotated graph appeared on 4/18/2011. Click here.
View all notes |
Alert me of new notes |
CANSLIM.net Company Profile |
SEC |
Zacks Reports |
StockTalk |
News |
Chart |
Request a new note
C
A N
S L
I M
|
TIBX
-
NASDAQ
Tibco Software Inc
COMPUTER SOFTWARE and SERVICES - Business Software and Services
|
$29.99
|
+0.34
1.15% |
$30.45
|
2,598,965
105.04% of 50 DAV
50 DAV is 2,474,300
|
$30.20
-0.70%
|
3/18/2011
|
$23.88
|
PP = $26.04
|
|
MB = $27.34
|
Most Recent Note - 4/27/2011 5:16:43 PM
G - Quietly holding its ground near its all-time high, extended from any sound base after a spurt of volume-driven gains. As previously noted, support is defined by prior highs in the $25-26 area and its 50 DMA line.
>>> The latest Featured Stock Update with an annotated graph appeared on 4/14/2011. Click here.
View all notes |
Alert me of new notes |
CANSLIM.net Company Profile |
SEC |
Zacks Reports |
StockTalk |
News |
Chart |
Request a new note
C
A N
S L
I M
|
UA
-
NYSE
Under Armour Inc Cl A
CONSUMER NON-DURABLES - Textile - Apparel Clothing
|
$68.46
|
-1.78
-2.53% |
$70.30
|
1,517,157
176.27% of 50 DAV
50 DAV is 860,700
|
$80.00
-14.43%
|
3/31/2011
|
$68.04
|
PP = $70.79
|
|
MB = $74.33
|
Most Recent Note - 4/29/2011 6:35:32 PM
G - Loss today with above average volume led to a close below its 50 DMA line and under prior chart highs, raising concerns and triggering a technical sell signal. See the latest FSU analysis for details and a new annotated graph.
>>> The latest Featured Stock Update with an annotated graph appeared on 4/29/2011. Click here.
View all notes |
Alert me of new notes |
CANSLIM.net Company Profile |
SEC |
Zacks Reports |
StockTalk |
News |
Chart |
Request a new note
C
A N
S L
I M
|
ULTA
-
NASDAQ
Ulta Salon Cosm & Frag
SPECIALTY RETAIL - Specialty Retail, Other
|
$53.19
|
+0.38
0.72% |
$53.37
|
294,215
47.65% of 50 DAV
50 DAV is 617,500
|
$53.99
-1.48%
|
1/6/2011
|
$36.12
|
PP = $37.34
|
|
MB = $39.21
|
Most Recent Note - 4/28/2011 6:54:20 PM
G - Extended from any sound base now. Its 50 DMA line defines chart support to watch well above prior highs. See the latest FSU analysis for more details and a new annotated graph.
>>> The latest Featured Stock Update with an annotated graph appeared on 4/28/2011. Click here.
View all notes |
Alert me of new notes |
CANSLIM.net Company Profile |
SEC |
Zacks Reports |
StockTalk |
News |
Chart |
Request a new note
C
A N
S L
I M
|
Symbol/Exchange
Company Name
Industry Group |
PRICE |
CHANGE
(%Change) |
Day High |
Volume
(% DAV)
(% 50 day avg vol) |
52 Wk Hi
% From Hi |
Featured
Date |
Price
Featured |
Pivot Featured |
|
Max Buy |
|
 |
| Subscriber Questions: |
April 27, 2011 |
Dear Ken,
I'm having a great experience with your picks I just wished I jumped in sooner! Great work on your featured stock list and everything in it! I wanted to ask you about BIDU. You have repeatedly mentioned late-stage breakouts are more risky and prone to failure Can you explain what a late stage breakout means? And how do you count bases? Is it always 5 weeks in length? I believe late stage breakouts has something to do with less supply available for accumulation by institutions, but I'm not sure. Thanks Andy |
| Ken's Response: |
April 28, 2011 |
Dear Andy,
Thanks very much for the positive feedback!
It can be tricky to count the stages since they may not all be perfect by-the-book base patterns. After you have seen 3 or 4 sound bases and breakouts that worked out, you are probably better off looking for a time to be selling, rather than looking to just get on board with a brand new entry.
The term "late-stage" is explained as follows on page 268 of the 4th edition of "How to Make Money in Stocks":
"Sell when your stock makes a new high in price off a third- or fourth-stage base. The third time is seldom a charm in the stock market. By then, an advancing stock has become too obvious, and almost everyone sees it. These late-stage base patterns are often faulty, appearing wider and looser. As much as 80% of fourth-stage bases should fail, but you have to be right in determining that this is a fourth-stage base."
I would count BIDU in the "obvious" category by now. It is not near its latest sound base which was cleared on 3/23/11.
The 5-week flat base is the minimum length base pattern among the basic and most popular bases the investment system has long recognized. An advanced base which we also may occasionally note in our analysis could include a "3-weeks tight", but this rare pattern requires a considerable run up of +70-100% in the past 9-16 weeks following a breakout from an earlier sound base pattern, followed by 3 very tight closes on its weekly chart. The phrase 'late-stage" is only appropriate when there were multiple bases formed and the stock has already enjoyed a considerable rally from its first-stage breakout.
Please feel free to contact me directly or let me know if I can be of any further help to you.
Best regards,

Kenneth J. Gruneisen
Founder & Contributing Writer for CANSLIM.net
www.canslim.net |
|
|
|
THESE ARE NOT BUY RECOMMENDATIONS!
Comments contained in the body of this report are technical
opinions only. The material herein has been obtained
from sources believed to be reliable and accurate, however,
its accuracy and completeness cannot be guaranteed.
This site is not an investment advisor, hence it does
not endorse or recommend any securities or other investments.
Any recommendation contained in this report may not
be suitable for all investors and it is not to be deemed
an offer or solicitation on our part with respect to
the purchase or sale of any securities. All trademarks,
service marks and trade names appearing in this report
are the property of their respective owners, and are
likewise used for identification purposes only.
This report is a service available
only to active Paid Premium Members.
You may opt-out of receiving report notifications
at any time. Questions or comments may be submitted
by writing to Premium Membership Services 665 S.E. 10 Street, Suite 201 Deerfield Beach, FL 33441-5634 or by calling 1-800-965-8307
or 954-785-1121.
|
|
|

