***Last / Change / Volume quote data in this table corresponds with the timestamp on the note***
Symbol/Exchange
Company Name
Industry Group |
Last |
Chg. |
Vol
% DAV |
Date Featured |
Price Featured |
Latest Pivot Point
Featured |
Status |
| Latest Max Buy Price |
AMZN
- NASDAQ
Amazon.com Inc
INTERNET - Internet Software & Services
|
$141.73
|
+2.38
|
6,293,992
83% DAV
7,616,300
|
4/23/2010
(Date
Featured) |
$144.41
(Price
Featured) |
PP = $146.01 |
G |
| MB = $153.31 |
Most Recent Note - 4/29/2010 4:33:38 PM
G - It was featured in the 4/23/10 mid-day report (read here) while encountering distributional pressure following strong results for the March 31, 2010 quarter. Stocks that are "healthy" do not drift more than -7% below their pivot point after a fresh buy signal, which emphasizes the importance of buying as near the pivot point as possible.
>>> The latest Featured Stock Update with an annotated graph appeared on 4/23/2010. click here.
|
|
C
A
S
I |
News |
Chart |
SEC
View all notes Alert
me of new notes
Company
Profile
|
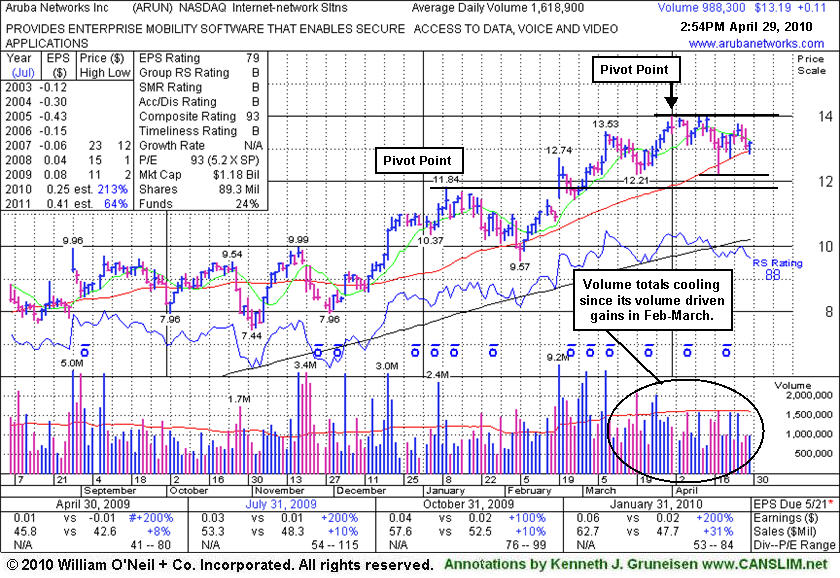
ARUN
- NASDAQ
Aruba Networks Inc
COMPUTER HARDWARE - Networking & Communication Dev
|
$13.27
|
+0.19
|
1,170,913
72% DAV
1,627,700
|
4/29/2010
(Date
Featured) |
$13.23
(Price
Featured) |
PP = $14.12 |
Y |
| MB = $14.83 |
Most Recent Note - 4/29/2010 4:21:36 PM
Y - Consolidating near its 50 DMA line, its color code was changed to yellow and new pivot point cited based upon its 5-week flat base. Confirming gains with volume may trigger a new buy signal, meanwhile the recent chart low ($12.21 on 3/19/10) helps define the next nearest chart support level above its old pivot point.
>>> The latest Featured Stock Update with an annotated graph appeared on 4/29/2010. click here.
|
|
C
A
S
I |
News |
Chart |
SEC
View all notes Alert
me of new notes
Company
Profile
|
BIDU
- NASDAQ
Baidu Inc Ads
INTERNET - Internet Information Providers
|
$709.87
|
+88.49
|
3,687,007
254% DAV
1,449,200
|
1/13/2010
(Date
Featured) |
$431.25
(Price
Featured) |
PP = $426.75 |
G |
| MB = $448.09 |
Most Recent Note - 4/29/2010 4:23:38 PM
G - Gapped up today for a considerable gain with more than twice its average volume after reporting great results for the quarter ended March 31, 2010 with impressive acceleration in sales revenues (+60%) and earnings (+144%). A streak of 12 consecutive weekly gains had it extended from a sound base. Repeatedly noted - "could produce more climactic gains, especially due to the small supply (S criteria) of shares outstanding."
>>> The latest Featured Stock Update with an annotated graph appeared on 4/20/2010. click here.
|
|
C
A
S
I |
News |
Chart |
SEC
View all notes Alert
me of new notes
Company
Profile
|
BPI
- NYSE
Bridgepoint Education
DIVERSIFIED SERVICES - Education &; Training Services
|
$25.25
|
-0.40
|
860,771
189% DAV
455,300
|
4/13/2010
(Date
Featured) |
$25.59
(Price
Featured) |
PP = $25.76 |
G |
| MB = $27.05 |
Most Recent Note - 4/29/2010 4:38:08 PM
G - Today's early loss led to trading below its 4/23/10 low ($24.30), and based on weakness its color code was changed to green. It has encountered distributional pressure, yet its close in the upper third of its intra-day range was a sign of prompt support well above its 50 DMA line. The Commercial Services - Schools firm was featured in yellow in the 4/13/10 mid-day report (read here) as rose from a cup-with-high-handle.
>>> The latest Featured Stock Update with an annotated graph appeared on 4/13/2010. click here.
|
|
C
A
S
I |
News |
Chart |
SEC
View all notes Alert
me of new notes
Company
Profile
|
BRLI
- NASDAQ
Bio Reference Labs Inc
HEALTH SERVICES - Medical Laboratories & Researc
|
$24.19
|
+0.42
|
150,058
76% DAV
197,100
|
2/12/2010
(Date
Featured) |
$39.02
(Price
Featured) |
PP = $20.49 |
G |
| MB = $21.51 |
Most Recent Note - 4/29/2010 4:40:28 PM
G - Prior chart highs and its 50 DMA line are support levels to watch while it is consolidating after a big winning streak and a 2:1 stock split.
>>> The latest Featured Stock Update with an annotated graph appeared on 4/16/2010. click here.
|
|
C
A
S
I |
News |
Chart |
SEC
View all notes Alert
me of new notes
Company
Profile
|
CISG
- NASDAQ
Cninsure Inc Ads
INSURANCE - Insurance Brokers
|
$28.24
|
+0.84
|
263,911
104% DAV
253,400
|
3/3/2010
(Date
Featured) |
$24.38
(Price
Featured) |
PP = $23.10 |
Y |
| MB = $24.26 |
Most Recent Note - 4/29/2010 5:15:25 PM
Y - Rallied near its 52-week high with a gain today on average volume. In the Certification they teach that a valid "second chance" entry point after a breakout occurs may be anywhere after a successful test of support at the stock's 10-week average, up to as much as +5% above its post-breakout high (in this case $28.62 +5% or $29.95). Its color code is changed to yellow, however the prior high is not considered a "pivot point" by definition since it did not form a proper new base. Its 50 DMA line and recent lows define important support near earlier chart highs. CISG traded up as much as +17.4% since first featured in yellow in the 3/03/10 mid-day report (read here).
>>> The latest Featured Stock Update with an annotated graph appeared on 4/19/2010. click here.
|
|
C
A
S
I |
News |
Chart |
SEC
View all notes Alert
me of new notes
Company
Profile
|
CRM
- NYSE
Salesforce.com Inc
INTERNET - Internet Software & Services
|
$88.14
|
+1.99
|
1,018,521
59% DAV
1,721,500
|
3/5/2010
(Date
Featured) |
$72.28
(Price
Featured) |
PP = $75.53 |
G |
| MB = $79.31 |
Most Recent Note - 4/29/2010 5:18:25 PM
G - Stubbornly holding its ground near all-time highs with volume totals cooling for the past week. It is extended from prior chart highs and well above its "max buy" level. Patience may allow disciplined investors to accumulate shares without chasing it too far from a sound base.
>>> The latest Featured Stock Update with an annotated graph appeared on 4/21/2010. click here.
|
|
C
A
S
I |
News |
Chart |
SEC
View all notes Alert
me of new notes
Company
Profile
|
CTRP
- NASDAQ
Ctrip.com Intl Ltd Adr
LEISURE - Resorts & Casinos
|
$37.52
|
-0.40
|
1,879,067
99% DAV
1,898,100
|
3/25/2010
(Date
Featured) |
$40.74
(Price
Featured) |
PP = $39.40 |
Y |
| MB = $41.37 |
Most Recent Note - 4/29/2010 5:22:23 PM
Y - Slumped to another close below its 50 DMA line today. Violation of its 4/21/10 low ($35.60) would complete a bearish head-and-shoulders type pattern formed over the past 8 weeks and could raise more serious concerns. In recent months it has encountered stubborn resistance in the $40 area. Confirming gains with heavy volume for new high closes would be a welcome reassurance shares are being accumulated. Distributional pressure has been noted since the 3/25/10 Stock Bulletin was published (read here).
>>> The latest Featured Stock Update with an annotated graph appeared on 4/12/2010. click here.
|
|
C
A
S
I |
News |
Chart |
SEC
View all notes Alert
me of new notes
Company
Profile
|
EZPW
- NASDAQ
Ezcorp Inc Cl A
SPECIALTY RETAIL - Specialty Retail, Other
|
$22.54
|
+0.15
|
330,190
61% DAV
541,700
|
4/14/2010
(Date
Featured) |
$21.80
(Price
Featured) |
PP = $22.29 |
Y |
| MB = $23.40 |
Most Recent Note - 4/29/2010 5:23:47 PM
Y - It edged back above its pivot point today with a gain on light volume after a considerable loss on 4/27/10 with above average volume raised concerns. Rose from a 5-week flat base with no overhead supply to act as resistance for this high-ranked Finance - Consumer/Commercial Loans firm.
>>> The latest Featured Stock Update with an annotated graph appeared on 4/27/2010. click here.
|
|
C
A
S
I |
News |
Chart |
SEC
View all notes Alert
me of new notes
Company
Profile
|
ISRG
- NASDAQ
Intuitive Surgical Inc
HEALTH SERVICES - Medical Appliances & Equipment
|
$368.38
|
+8.29
|
388,005
67% DAV
578,800
|
4/13/2010
(Date
Featured) |
$363.46
(Price
Featured) |
PP = $367.10 |
Y |
| MB = $385.46 |
Most Recent Note - 4/29/2010 5:25:44 PM
Y - Today's gain with light volume helped it close back above its pivot point. A subsequent violation of its recent chart low or 50 DMA line could raise more serious concerns and trigger sell signals. ISRG was featured again in the 4/13/10 mid-day report (read here) with new pivot point cited based on its 3/03/10 high.
>>> The latest Featured Stock Update with an annotated graph appeared on 4/7/2010. click here.
|
|
C
A
S
I |
News |
Chart |
SEC
View all notes Alert
me of new notes
Company
Profile
|
LL
- NYSE
Lumber Liquidators Hldgs
RETAIL - Home Improvement Stores
|
$31.23
|
+0.49
|
334,155
80% DAV
419,000
|
4/22/2010
(Date
Featured) |
$29.87
(Price
Featured) |
PP = $29.03 |
G |
| MB = $30.48 |
Most Recent Note - 4/29/2010 5:29:23 PM
G - Edged higher today. Following earnings news it gapped down on 4/28/10, then managed a "positive reversal" to close back above its max buy level. That session's low now defines a near-term support level closely coinciding with its old chart highs in the $28 area. First featured in yellow at $29.87 in the 4/22/10 the mid-day report (read here).
>>> The latest Featured Stock Update with an annotated graph appeared on 4/26/2010. click here.
|
|
C
A
S
I |
News |
Chart |
SEC
View all notes Alert
me of new notes
Company
Profile
|
LOPE
- NASDAQ
Grand Canyon Education
DIVERSIFIED SERVICES - Education &; Training Services
|
$24.85
|
-0.11
|
953,002
263% DAV
362,300
|
4/13/2010
(Date
Featured) |
$27.71
(Price
Featured) |
PP = $27.33 |
G |
| MB = $28.70 |
Most Recent Note - 4/29/2010 5:40:53 PM
G - Intra-day it violated its 50 DMA line, then rebound to close above its short-term average and in the upper third of its wide trading range. Its encouraging finish was a sign of prompt support, yet it still posted a 7th consecutive loss. Many for-profit schools have seen recent distributional pressure in the wake of proposed regulatory changes.
>>> The latest Featured Stock Update with an annotated graph appeared on 4/14/2010. click here.
|
|
C
A
S
I |
News |
Chart |
SEC
View all notes Alert
me of new notes
Company
Profile
|
PCLN
- NASDAQ
Priceline.com Inc
INTERNET - Internet Software & Services
|
$399.55
|
-4.72
|
584,812
N/A
|
11/1/2002
(Date
Featured) |
$399.55
(Price
Featured) |
PP = $428.20 |
Y |
| MB = $449.61 |
Most Recent Note - 1/2/2011
Y - Returns to Featured Stocks list with its appearance in the January 2011 CANSLIM.net News including detailed analysis and annotated daily and weekly graphs.
>>> The latest Featured Stock Update with an annotated graph appeared on 4/28/2010. click here.
|
|
C
A
S
I |
News |
Chart |
SEC
View all notes Alert
me of new notes
Company
Profile
|
ROVI
- NASDAQ
Rovi Corp
COMPUTER SOFTWARE & SERVICES - Security Software & Services
|
$39.56
|
+0.02
|
682,908
53% DAV
1,300,000
|
4/20/2010
(Date
Featured) |
$37.62
(Price
Featured) |
PP = $38.60 |
Y |
| MB = $40.53 |
Most Recent Note - 4/29/2010 5:51:00 PM
Y - Stubbornly holding its ground, quietly hovering -1% off its 52-week high without encountering any worrisome distributional pressure in many weeks. Its 50 DMA line and recent chart low ($35.91 on 4/08/10) define important support to watch. Earnings news is due on May 6th.
>>> The latest Featured Stock Update with an annotated graph appeared on 4/8/2010. click here.
|
|
C
A
S
I |
News |
Chart |
SEC
View all notes Alert
me of new notes
Company
Profile
|
SIRO
- NASDAQ
Sirona Dental Systems
HEALTH SERVICES - Medical Instruments & Supplies
|
$42.59
|
+0.52
|
381,594
69% DAV
551,200
|
2/16/2010
(Date
Featured) |
$36.43
(Price
Featured) |
PP = $36.15 |
G |
| MB = $37.96 |
Most Recent Note - 4/29/2010 5:54:05 PM
G - Hit a new high today. Holding its ground stubbornly since its 4/23/10 gap up for a considerable gain and new 52-week high. Extended from any sound base, its prior chart highs and 50 DMA line in the $36 area define an initial support level to watch. Earnings release is scheduled for May 5th.
>>> The latest Featured Stock Update with an annotated graph appeared on 4/22/2010. click here.
|
|
C
A
S
I |
News |
Chart |
SEC
View all notes Alert
me of new notes
Company
Profile
|
ULTA
- NASDAQ
Ulta Salon Cosm & Frag
SPECIALTY RETAIL - Specialty Retail, Other
|
$24.08
|
+1.10
|
304,971
73% DAV
419,600
|
3/12/2010
(Date
Featured) |
$22.81
(Price
Featured) |
PP = $21.72 |
G |
| MB = $22.81 |
Most Recent Note - 4/29/2010 5:55:21 PM
G - It has rallied on lighter volume following heavy distributional pressure after its 4/26/10 negative reversal at its 52-week high. A subsequent violation of its 50 DMA line or recent chart low $21.66 could trigger damaging technical sell signals.
>>> The latest Featured Stock Update with an annotated graph appeared on 4/1/2010. click here.
|
|
C
A
S
I |
News |
Chart |
SEC
View all notes Alert
me of new notes
Company
Profile
|
VIT
-
|
$23.92
|
+0.09
|
903,250
136% DAV
664,100
|
4/9/2010
(Date
Featured) |
$23.79
(Price
Featured) |
PP = $23.95 |
Y |
| MB = $25.15 |
Most Recent Note - 4/29/2010 5:57:12 PM
Y - Held its ground near its pivot point today after a considerable loss on 4/28/10 with volume more than 2 times average, raised concerns. Testing support near prior chart highs, meanwhile the next support to watch is its 50 DMA line. Color code was changed to yellow on the pullback. More damaging losses would raise serious concerns, and a subsequent close below its 3/09/10 close ($23.41) would technically negate its latest breakout. Featured in the 4/09/10 mid-day report (read here).
>>> The latest Featured Stock Update with an annotated graph appeared on 4/9/2010. click here.
|
|
C
A
S
I |
News |
Chart |
SEC
View all notes Alert
me of new notes
Company
Profile
|