You are not logged in.
This means you
CAN ONLY VIEW reports that were published prior to Monday, April 14, 2025.
You
MUST UPGRADE YOUR MEMBERSHIP if you want to see any current reports.
AFTER MARKET UPDATE - FRIDAY, APRIL 26TH, 2013
Previous After Market Report Next After Market Report >>>
|
|
|
|
DOW |
+11.75 |
14,712.55 |
+0.08% |
|
Volume |
681,748,850 |
-9% |
|
Volume |
1,600,689,770 |
-14% |
|
NASDAQ |
-10.73 |
3,279.26 |
-0.33% |
|
Advancers |
1,211 |
39% |
|
Advancers |
933 |
37% |
|
S&P 500 |
-2.92 |
1,582.24 |
-0.18% |
|
Decliners |
1,750 |
57% |
|
Decliners |
1,510 |
59% |
|
Russell 2000 |
-5.03 |
935.25 |
-0.54% |
|
52 Wk Highs |
157 |
|
|
52 Wk Highs |
99 |
|
|
S&P 600 |
-3.35 |
523.00 |
-0.64% |
|
52 Wk Lows |
12 |
|
|
52 Wk Lows |
24 |
|
|
 |
Major Averages Ended Mixed With Lighter Volume Totals
Kenneth J. Gruneisen - Passed the CAN SLIM® Master's Exam
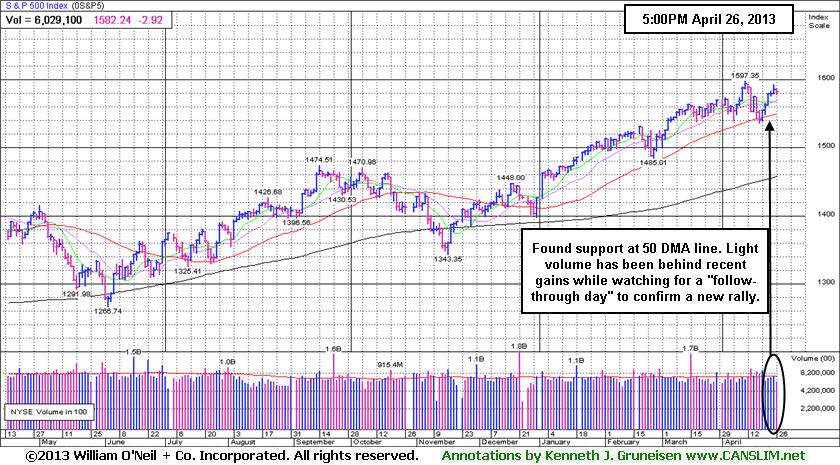
For the week, the Dow gained +1.1%, the S&P 500 rose +1.7% and the Nasdaq Composite advanced +2.3%. The major averages finished Friday's finished choppy session with mixed results. The volume totals on the exchanges were reported lighter than the prior session totals on the NYSE and on the Nasdaq exchange, indicating lackluster institutional buying demand. Breadth was negative as decliners led advancers by a 3-2 margin on the NYSE and on the Nasdaq exchange. New 52-week highs totals contracted yet new highs solidly outnumbered new 52-week lows on both the NYSE and the Nasdaq exchange. There were 42 high-ranked companies from the CANSLIM.net Leaders List making new 52-week highs and appearing on the CANSLIM.net BreakOuts Page, down from the prior session total of 71 stocks. There were gains for 5 of the 10 high-ranked companies currently included on the Featured Stocks Page.
The major averages traded in a narrow range throughout the session. Equity markets toggled between gains and losses as investors digested a disappointing report on first-quarter GDP and a batch of mixed earnings.
Six of the 10 sectors on the S&P finished lower, led by declines in material stocks. A -1.8% decline in copper prices had shares of Freeport-McMoRan Coper & Gold Inc (FCX -1.74%). On the earnings front, Amazon.com (AMZN -7.24%) fell after posting quarterly results below analysts' estimates. On the upside, Tyco International (TYC +1.09%) and homebuilder D.R. Horton Inc (DHI +8.68%) rallied following their positive profit tallies. In other news, J.C. Penny Company Inc (JCP +11.55%) rallied on news that investor George Soros took a 7.9% passive stake in the company.
Turning to fixed income markets, Treasuries were higher along the curve. The benchmark 10-year note was up 3/8 of a point to yield 1.67% and the 30-year bond rose nearly a full point to yield 2.86%.
The window is open for a possible follow-through-day within what has historically proven as most favorable between Days 4-7 of a new rally attempt. The market's (M criteria) latest rally attempt is encouraging, however new buying efforts should still be avoided until there has been a follow-through day of meaningful gains (+1.4% or greater) from at least one of the major averages with higher volume coupled with an expansion in leadership. That kind of bullish action is necessary to confirm that any new rally has the characteristics of institutional accumulation which have marked the beginning of most sustained market advances.
Watch for an announcement via email concerning the next WEBCAST. The webcast will also be available via an updated link highlighted at the top of the Premium Member Homepage.
PICTURED: The S&P 500 Index found support at its 50-day moving average (DMA) line. Recent gains have lacked great volume conviction while awaiting a "follow-through day" to confirm a new rally.
|
 Kenneth J. Gruneisen started out as a licensed stockbroker in August 1987, a couple of months prior to the historic stock market crash that took the Dow Jones Industrial Average down -22.6% in a single day. He has published daily fact-based fundamental and technical analysis on high-ranked stocks online for two decades. Through FACTBASEDINVESTING.COM, Kenneth provides educational articles, news, market commentary, and other information regarding proven investment systems that work in good times and bad.
Comments contained in the body of this report are technical opinions only and are not necessarily those of Gruneisen Growth Corp. The material herein has been obtained from sources believed to be reliable and accurate, however, its accuracy and completeness cannot be guaranteed. Our firm, employees, and customers may effect transactions, including transactions contrary to any recommendation herein, or have positions in the securities mentioned herein or options with respect thereto. Any recommendation contained in this report may not be suitable for all investors and it is not to be deemed an offer or solicitation on our part with respect to the purchase or sale of any securities. |
|
 |
Gold & Silver Index Drops Again; Retail and Tech Fell
Kenneth J. Gruneisen - Passed the CAN SLIM® Master's Exam
The Gold & Silver Index ($XAU -3.30%) was clearly a laggard on Friday. A loss from the influential Retail Index ($RLX -1.33%) weighed on the major averages while the Bank Index ($BKX -0.26%) and Broker/Dealer Index ($XBD -0.10%) also edged lower. The Semiconductor Index ($SOX -1.07%) led the tech sector losses while the Networking Index ($NWX -0.50%) suffered a smaller loss. Energy-related shares showed little conviction as the Oil Services Index ($OSX -0.41%) edged lower while the Integrated Oil Index ($XOI +0.15%) posted a small gain Medical-related shares were not very decisive either as the Healthcare Index ($HMO -0.11%) ended slightly lower and the Biotechnology Index ($BTK +0.30%) posted a small gain.
Charts courtesy www.stockcharts.com
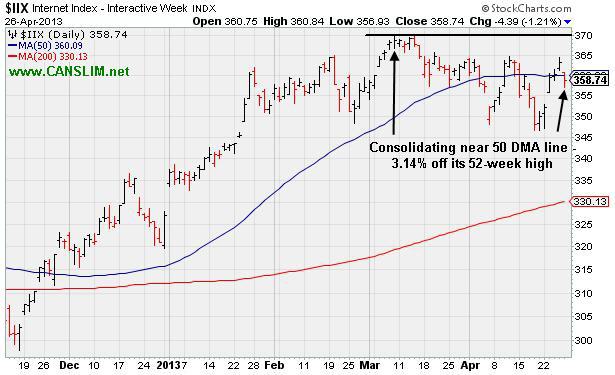
PICTURED: The Internet Index ($IIX -1.21%) is consolidating near its 50-day moving average (DMA) line and -3.14% off its 52-week high.
| Oil Services |
$OSX |
245.22 |
-1.02 |
-0.41% |
+11.38% |
| Healthcare |
$HMO |
2,928.93 |
-3.33 |
-0.11% |
+16.50% |
| Integrated Oil |
$XOI |
1,343.38 |
+2.04 |
+0.15% |
+8.18% |
| Semiconductor |
$SOX |
435.29 |
-4.69 |
-1.07% |
+13.34% |
| Networking |
$NWX |
220.37 |
-1.12 |
-0.50% |
-2.73% |
| Internet |
$IIX |
358.74 |
-4.39 |
-1.21% |
+9.71% |
| Broker/Dealer |
$XBD |
111.19 |
-0.11 |
-0.10% |
+17.87% |
| Retail |
$RLX |
745.51 |
-10.04 |
-1.33% |
+14.16% |
| Gold & Silver |
$XAU |
106.31 |
-3.63 |
-3.30% |
-35.80% |
| Bank |
$BKX |
56.58 |
-0.15 |
-0.26% |
+10.34% |
| Biotech |
$BTK |
1,917.60 |
+5.73 |
+0.30% |
+23.95% |
|
|
|
 |
Patience & Discipline Are Paramount With Stocks on Your Watch List
Kenneth J. Gruneisen - Passed the CAN SLIM® Master's Exam
Often, when a leading stock is setting up to breakout of a solid base it is highlighted in CANSLIM.net's Mid-Day Breakouts Report. The most relevant factors are noted in the report which alerts prudent CANSLIM oriented investors to place the issue in their watch list. After doing any necessary backup research, the investor is prepared to act after the stock triggers a technical buy signal (breaks above its pivot point on more than +50% average turnover) but before it gets too extended from a sound base. In the event the stock fails to trigger a technical buy signal and its price declines then it will simply be removed from the watch list. Disciplined investors know to buy as near as possible to the pivot point and avoid chasing stocks after they have rallied more than +5% above their pivot point. It is crucial to always limit losses whenever any stock heads the wrong direction, and disciplined investors sell if a struggling stock ever falls more than -7% from their purchase price.
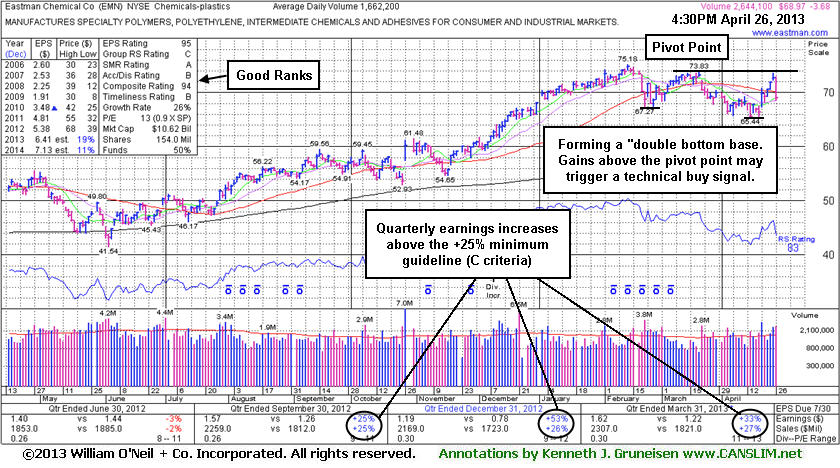
Eastman Chemical Co (EMN -$3.68 or -5.07% to $68.97) pulled back below its 50-day moving average (DMA) line today after volume-driven gains helped it nearly challenge its 52-week high on the prior session. It was highlighted in yellow in the earlier mid-day report (read here) with pivot point cited based on its 3/20/13 high mid-point in an 11-week "double bottom" base pattern. Little resistance from overhead supply remains to hinder its progress. Subsequent volume-driven gains above the pivot point are needed to trigger a proper technical buy signal before disciplined investors may consider taking action. Another overriding concern that remains is that the market (M criteria) has not yet confirmed the latest rally attempt with a solid follow through day from at least one of the major averages since the recently noted market correction began. Because 3 out of 4 stocks tend to go in the same direction as the major averages, investors' odds are best when buying stocks while the market is in a confirmed rally.
The high-ranked Chemicals - Plastics firm reported earnings +33% on +27% sales revenues for the Mar '13 quarter, marking its 3rd consecutive quarter above the +25% minimum earnings guideline (C criteria). Annual earnings (A criteria) have been improving since a downturn in FY '09. The number of top-rated funds owning its shares rose from 1,045 in Jun '12 to 1,131 in Mar '13, a reassuring sign concerning the I criteria.
Patience and discipline are paramount. Only time will tell if the market correction might worsen or if another confirming day of gains known as a "follow-through" day will signal that the market is acting more favorably for investors following the fact-based investment system.
 |
|
|
Color Codes Explained :
Y - Better candidates highlighted by our
staff of experts.
G - Previously featured
in past reports as yellow but may no longer be buyable under the
guidelines.
***Last / Change / Volume data in this table is the closing quote data***
Symbol/Exchange
Company Name
Industry Group |
PRICE |
CHANGE
(%Change) |
Day High |
Volume
(% DAV)
(% 50 day avg vol) |
52 Wk Hi
% From Hi |
Featured
Date |
Price
Featured |
Pivot Featured |
|
Max Buy |
CELG
-
NASDAQ
Celgene Corp
DRUGS - Drug Manufacturers - Major
|
$120.34
|
+2.39
2.03% |
$121.01
|
3,241,858
100.71% of 50 DAV
50 DAV is 3,218,900
|
$128.52
-6.36%
|
3/27/2013
|
$113.24
|
PP = $115.54
|
|
MB = $121.32
|
Most Recent Note - 4/25/2013 11:54:30 AM
G - Holding its ground today after encountering distributional pressure and gapping down on the prior session, retreating with above average volume from its high. It is extended from any sound base. Its 50 DMA line ($111.84 now) defines important near-term support to watch.
>>> The latest Featured Stock Update with an annotated graph appeared on 4/19/2013. Click here.
View all notes |
Alert me of new notes |
CANSLIM.net Company Profile |
SEC |
Zacks Reports |
StockTalk |
News |
Chart |
Request a new note
C
A N
S L
I M


|
CMCSA
-
NASDAQ
Comcast Corp Cl A
MEDIA - CATV Systems
|
$41.37
|
+0.62
1.52% |
$41.53
|
13,759,820
96.92% of 50 DAV
50 DAV is 14,197,400
|
$42.61
-2.91%
|
12/3/2012
|
$37.08
|
PP = $38.06
|
|
MB = $39.96
|
 Most Recent Note - 4/26/2013 4:28:11 PM
G - Rebounded above its 50 DMA line with higher volume behind its gain, helping its technical stance improve. Fundamental concerns were repeatedly noted after sub par earnings results for the Dec '12 quarter.
>>> The latest Featured Stock Update with an annotated graph appeared on 4/16/2013. Click here.
View all notes |
Alert me of new notes |
CANSLIM.net Company Profile |
SEC |
Zacks Reports |
StockTalk |
News |
Chart |
Request a new note
C
A N
S L
I M
|
EMN
-
NYSE
Eastman Chemical Co
CHEMICALS - Chemicals - Major Diversified
|
$68.97
|
-3.68
-5.07% |
$73.00
|
2,653,783
159.65% of 50 DAV
50 DAV is 1,662,200
|
$75.18
-8.26%
|
4/26/2013
|
$69.57
|
PP = $73.83
|
|
MB = $77.52
|
Most Recent Note - 4/26/2013 5:35:58 PM
Y - Finished below its 50 DMA line today after highlighted in yellow with pivot point cited based on its 3/20/13 high mid-point in an 11-week "double bottom" base pattern. Subsequent volume-driven gains above the pivot point are needed to trigger a proper technical buy signal before disciplined investors may consider taking action. Little resistance from overhead supply remains to hinder its progress. Reported earnings +33% on +27% sales revenues for the Mar '13 quarter, marking its 3rd consecutive quarter above the +25% minimum earnings guideline (C criteria). Annual earnings (A criteria) have been improving since a downturn in FY '09. See the latest FSU analysis for more details and a new annotated graph.
>>> The latest Featured Stock Update with an annotated graph appeared on 4/26/2013. Click here.
View all notes |
Alert me of new notes |
CANSLIM.net Company Profile |
SEC |
Zacks Reports |
StockTalk |
News |
Chart |
Request a new note
C
A N
S L
I M
|
EQM
-
NYSE
E Q T Midstream Partners
ENERGY - Oil and Gas Pipelines
|
$43.14
|
+1.89
4.58% |
$43.71
|
154,970
225.90% of 50 DAV
50 DAV is 68,600
|
$42.64
1.17%
|
4/25/2013
|
$40.16
|
PP = $40.84
|
|
MB = $42.88
|
Most Recent Note - 4/26/2013 4:34:14 PM
G - Color code is changed to green after rallying beyond its "max buy" level, getting extended from the prior base. See the latest FSU analysis for more details and a new annotated graph.
>>> The latest Featured Stock Update with an annotated graph appeared on 4/25/2013. Click here.
View all notes |
Alert me of new notes |
CANSLIM.net Company Profile |
SEC |
Zacks Reports |
StockTalk |
News |
Chart |
Request a new note
C
A N
S L
I M
|
FLT
-
NYSE
Fleetcor Technologies
DIVERSIFIED SERVICES - Business/Management Services
|
$75.48
|
+0.49
0.65% |
$75.90
|
516,476
65.55% of 50 DAV
50 DAV is 787,900
|
$78.87
-4.30%
|
3/21/2013
|
$71.14
|
PP = $73.00
|
|
MB = $76.65
|
Most Recent Note - 4/25/2013 6:04:39 PM
Y - Perched within close striking distance of its 52-week high, Made a stand near its 50 DMA line recently with a "positive reversal" on 4/19/13. More damaging losses below the 50 DMA line or recent low ($70.09) would raise more serious concerns and trigger a worrisome technical sell signal.
>>> The latest Featured Stock Update with an annotated graph appeared on 4/15/2013. Click here.
View all notes |
Alert me of new notes |
CANSLIM.net Company Profile |
SEC |
Zacks Reports |
StockTalk |
News |
Chart |
Request a new note
C
A N
S L
I M
|
Symbol/Exchange
Company Name
Industry Group |
PRICE |
CHANGE
(%Change) |
Day High |
Volume
(% DAV)
(% 50 day avg vol) |
52 Wk Hi
% From Hi |
Featured
Date |
Price
Featured |
Pivot Featured |
|
Max Buy |
LNKD
-
NYSE
Linkedin Corp Class A
INTERNET - Internet Information Providers
|
$187.76
|
-0.11
-0.06% |
$188.99
|
1,204,559
57.03% of 50 DAV
50 DAV is 2,112,000
|
$191.78
-2.10%
|
4/12/2013
|
$182.69
|
PP = $184.25
|
|
MB = $193.46
|
Most Recent Note - 4/23/2013 9:03:56 PM
Y - Rallied with near average volume for a 3rd consecutive gain today and hit a new 52-week high. Volume-driven gains above the pivot point may clinch a proper new (or add-on) technical buy signal. Its 50 DMA line and recent low define important near-term chart support to watch.
>>> The latest Featured Stock Update with an annotated graph appeared on 4/5/2013. Click here.
View all notes |
Alert me of new notes |
CANSLIM.net Company Profile |
SEC |
Zacks Reports |
StockTalk |
News |
Chart |
Request a new note
C
A N
S L
I M
|
MRLN
-
NASDAQ
Marlin Business Services
DIVERSIFIED SERVICES - Rental and Leasing Services
|
$23.13
|
-1.12
-4.62% |
$24.21
|
13,836
52.21% of 50 DAV
50 DAV is 26,500
|
$24.93
-7.22%
|
3/15/2013
|
$22.29
|
PP = $23.18
|
|
MB = $24.34
|
Most Recent Note - 4/26/2013 2:41:58 PM
Y - Pulling back on lighter volume today after wedging higher with without great volume conviction behind recent gains. Action has not been indicative of fresh institutional buying demand, yet no resistance remains due to overhead supply.
>>> The latest Featured Stock Update with an annotated graph appeared on 4/9/2013. Click here.
View all notes |
Alert me of new notes |
CANSLIM.net Company Profile |
SEC |
Zacks Reports |
StockTalk |
News |
Chart |
Request a new note
C
A N
S L
I M
|
MWIV
-
NASDAQ
M W I Veterinary Supply
HEALTH SERVICES - Medical Instruments and; Supplies
|
$116.83
|
-1.98
-1.67% |
$119.40
|
52,682
95.09% of 50 DAV
50 DAV is 55,400
|
$137.18
-14.83%
|
3/4/2013
|
$130.90
|
PP = $129.45
|
|
MB = $135.92
|
Most Recent Note - 4/24/2013 5:40:57 PM
G - Slumped near November highs defining near-term support while slumping further below its 50 DMA line. See the latest FSU analysis for more details and a new annotated graph.
>>> The latest Featured Stock Update with an annotated graph appeared on 4/24/2013. Click here.
View all notes |
Alert me of new notes |
CANSLIM.net Company Profile |
SEC |
Zacks Reports |
StockTalk |
News |
Chart |
Request a new note
C
A N
S L
I M
|
N
-
NYSE
Netsuite Inc
DIVERSIFIED SERVICES - Business/Management Services
|
$85.75
|
+4.50
5.54% |
$86.64
|
980,410
272.64% of 50 DAV
50 DAV is 359,600
|
$81.88
4.73%
|
12/12/2012
|
$64.75
|
PP = $67.12
|
|
MB = $70.48
|
Most Recent Note - 4/26/2013 12:42:27 PM
G - Reported earnings -33% on +32% sales revenues for the Mar '13 quarter, marking a 2nd consecutive quarterly comparison with earnings below the +25% minimum guideline (C criteria). Despite fundamental concerns raised it spiked to new all-time high territory with today's 4th consecutive gain. Its 50 DMA line defines important near-term support to watch.
>>> The latest Featured Stock Update with an annotated graph appeared on 4/22/2013. Click here.
View all notes |
Alert me of new notes |
CANSLIM.net Company Profile |
SEC |
Zacks Reports |
StockTalk |
News |
Chart |
Request a new note
C
A N
S L
I M
|
RRTS
-
NYSE
Roadrunner Trans Systems
TRANSPORTATION - Air Delivery and Freight Service
|
$22.77
|
+0.11
0.49% |
$22.96
|
105,111
56.69% of 50 DAV
50 DAV is 185,400
|
$23.88
-4.65%
|
4/3/2013
|
$22.77
|
PP = $23.75
|
|
MB = $24.94
|
Most Recent Note - 4/23/2013 8:58:25 PM
G - Still sputtering below its 50 DMA line after failing to trigger a new buy signal since featured on 4/03/13. A rebound above that important short-term average would help its outlook improve. See the latest FSU analysis for more details and a new annotated graph.
>>> The latest Featured Stock Update with an annotated graph appeared on 4/23/2013. Click here.
View all notes |
Alert me of new notes |
CANSLIM.net Company Profile |
SEC |
Zacks Reports |
StockTalk |
News |
Chart |
Request a new note
C
A N
S L
I M
|
Symbol/Exchange
Company Name
Industry Group |
PRICE |
CHANGE
(%Change) |
Day High |
Volume
(% DAV)
(% 50 day avg vol) |
52 Wk Hi
% From Hi |
Featured
Date |
Price
Featured |
Pivot Featured |
|
Max Buy |
VRX
-
NYSE
Valeant Pharmaceuticals
DRUGS - Drug Manufacturers - Other
|
$73.16
|
-0.43
-0.58% |
$73.83
|
1,240,579
90.53% of 50 DAV
50 DAV is 1,370,300
|
$76.56
-4.44%
|
12/20/2012
|
$60.24
|
PP = $61.21
|
|
MB = $64.27
|
Most Recent Note - 4/26/2013 4:31:34 PM
G - It is extended from any sound base pattern and still consolidating above its 50 DMA line which defines near-term support above recent the recent low ($69.87 on 4/04/13). Subsequent violations may trigger technical sell signals.
>>> The latest Featured Stock Update with an annotated graph appeared on 4/8/2013. Click here.
View all notes |
Alert me of new notes |
CANSLIM.net Company Profile |
SEC |
Zacks Reports |
StockTalk |
News |
Chart |
Request a new note
C
A N
S L
I M
|
|
|
|
THESE ARE NOT BUY RECOMMENDATIONS!
Comments contained in the body of this report are technical
opinions only. The material herein has been obtained
from sources believed to be reliable and accurate, however,
its accuracy and completeness cannot be guaranteed.
This site is not an investment advisor, hence it does
not endorse or recommend any securities or other investments.
Any recommendation contained in this report may not
be suitable for all investors and it is not to be deemed
an offer or solicitation on our part with respect to
the purchase or sale of any securities. All trademarks,
service marks and trade names appearing in this report
are the property of their respective owners, and are
likewise used for identification purposes only.
This report is a service available
only to active Paid Premium Members.
You may opt-out of receiving report notifications
at any time. Questions or comments may be submitted
by writing to Premium Membership Services 665 S.E. 10 Street, Suite 201 Deerfield Beach, FL 33441-5634 or by calling 1-800-965-8307
or 954-785-1121.
|
|
|

