You are not logged in.
This means you
CAN ONLY VIEW reports that were published prior to Thursday, April 10, 2025.
You
MUST UPGRADE YOUR MEMBERSHIP if you want to see any current reports.
AFTER MARKET UPDATE - THURSDAY, APRIL 25TH, 2013
Previous After Market Report Next After Market Report >>>
|
|
|
|
DOW |
+24.50 |
14,700.80 |
+0.17% |
|
Volume |
746,312,740 |
+6% |
|
Volume |
1,855,737,320 |
+12% |
|
NASDAQ |
+20.34 |
3,289.99 |
+0.62% |
|
Advancers |
1,950 |
62% |
|
Advancers |
1,538 |
60% |
|
S&P 500 |
+6.37 |
1,585.16 |
+0.40% |
|
Decliners |
1,044 |
33% |
|
Decliners |
913 |
36% |
|
Russell 2000 |
+6.17 |
940.28 |
+0.66% |
|
52 Wk Highs |
306 |
|
|
52 Wk Highs |
166 |
|
|
S&P 600 |
+3.46 |
526.35 |
+0.66% |
|
52 Wk Lows |
11 |
|
|
52 Wk Lows |
18 |
|
|
 |
Positive Breadth And Encouraging Volume Increase Behind Gains
Kenneth J. Gruneisen - Passed the CAN SLIM® Master's Exam
The major averages finished the session higher, albeit off of their best levels on Thursday's session. The volume totals on the exchanges were reported higher than the prior session totals on the NYSE and on the Nasdaq exchange indicating a modest increase in institutional buying demand. Breadth was positive as advancers led decliners by a 2-1 margin on the NYSE and by a 5-3 margin on the Nasdaq exchange. New 52-week highs totals expanded and outnumbered new 52-week lows on the NYSE on the Nasdaq exchange. There were 71 high-ranked companies from the CANSLIM.net Leaders List making new 52-week highs and appearing on the CANSLIM.net BreakOuts Page, up from the prior session total of 57 stocks. There were gains for 6 of the 10 high-ranked companies currently included on the Featured Stocks Page.
Stocks edged higher through much of the day as investors responded to a positive report on weekly jobless claims and several corporate earnings reports. Equity markets did an exhale late in the session after Fed Chairman Bernanke warned that vulnerabilities in the markets still exist.
All 10 sectors on the S&P finished higher, led by gains in telecom stocks. Verizon Communications Inc (VZ +2.74%) rose on news that the company was preparing a bid to take full control of the wireless unit from Vodafone Groups Plc (VOD +2.82%). On the earnings front, United Parcel Service Inc (UPS +2.30%) and Dunkin Brands Group Inc(DNKN +3.67%) rose as both companies topped analysts' estimates in the quarter. On the downside, 3M Co (MMM -2.77%) fell after the company lowered their full year earnings guidance.
Turning to fixed income markets, Treasuries were modestly lower with the benchmark 10-year note off 1/32 to yield 1.71%.
The window is open for a possible follow-through-day within what has historically proven as most favorable between Days 4-7 of a new rally attempt. The market's (M criteria) latest rally attempt is encouraging, however new buying efforts should still be avoided until there has been a follow-through day of meaningful gains (+1.4% or greater) from at least one of the major averages with higher volume coupled with an expansion in leadership. That kind of bullish action is necessary to confirm that any new rally has the characteristics of institutional accumulation which have marked the beginning of most sustained market advances.
Watch for an announcement via email concerning the next WEBCAST. The webcast will also be available via an updated link highlighted at the top of the Premium Member Homepage.
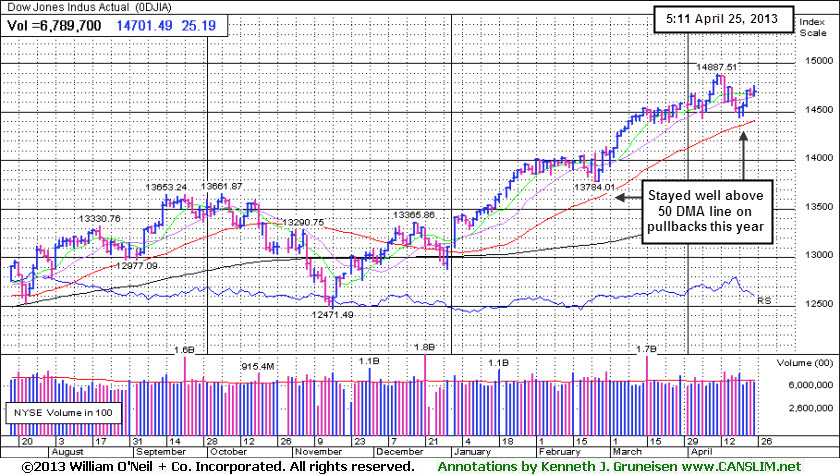
PICTURED: The Dow Jones Industrial Average posted a small gain on Day 5 of a new rally attempt. The Blue Chip index stayed well above its 50-day moving average (DMA) line on pullbacks this year. On Thursday's session the Dow Jones Industrial Average gained over 24 points to 14,700 after being up as many as 91 points in early action.
|
 Kenneth J. Gruneisen started out as a licensed stockbroker in August 1987, a couple of months prior to the historic stock market crash that took the Dow Jones Industrial Average down -22.6% in a single day. He has published daily fact-based fundamental and technical analysis on high-ranked stocks online for two decades. Through FACTBASEDINVESTING.COM, Kenneth provides educational articles, news, market commentary, and other information regarding proven investment systems that work in good times and bad.
Comments contained in the body of this report are technical opinions only and are not necessarily those of Gruneisen Growth Corp. The material herein has been obtained from sources believed to be reliable and accurate, however, its accuracy and completeness cannot be guaranteed. Our firm, employees, and customers may effect transactions, including transactions contrary to any recommendation herein, or have positions in the securities mentioned herein or options with respect thereto. Any recommendation contained in this report may not be suitable for all investors and it is not to be deemed an offer or solicitation on our part with respect to the purchase or sale of any securities. |
|
 |
Retail, Defensive and Tech Groups Led Gainers
Kenneth J. Gruneisen - Passed the CAN SLIM® Master's Exam
The Retail Index ($RLX +1.37%) helped underpin the major averages' rally as the influential Bank Index ($BKX +0.51%) led the financial group higher followed by a smaller gain from the Broker/Dealer Index ($XBD +0.14%). The tech sector was led higher by the Networking Index ($NWX +2.36%) while the Biotechnology Index ($BTK +1.17%), Semiconductor Index ($SOX +0.99%) and the Internet Index ($IIX +0.79%) finished with unanimous gains. There was bullish action in defensive groups as the Gold & Silver Index ($XAU +1.08%) outpaced the Healthcare Index ($HMO +0.72%). Energy-related shares were mixed as the Oil Services Index ($OSX -0.32%) edged lower and the Integrated Oil Index ($XOI +0.37%) posted a modest gain.
Charts courtesy www.stockcharts.com
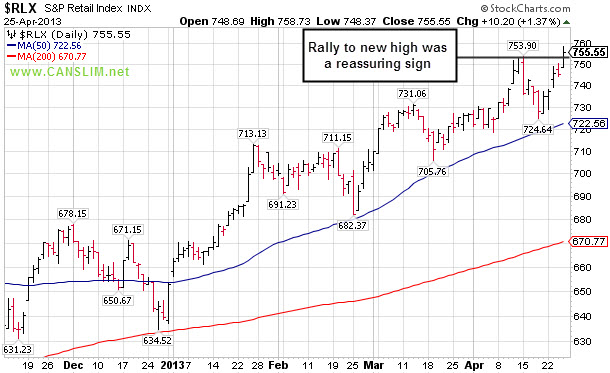
PICTURED: The Retail Index ($RLX +1.37%) rallied into new high territory. Strength in retail-related shares is a reassuring sign that suggests consumers are still spending despite various challlenges.
| Oil Services |
$OSX |
246.24 |
-0.79 |
-0.32% |
+11.85% |
| Healthcare |
$HMO |
2,932.26 |
+21.10 |
+0.72% |
+16.63% |
| Integrated Oil |
$XOI |
1,341.35 |
+4.92 |
+0.37% |
+8.01% |
| Semiconductor |
$SOX |
439.98 |
+4.33 |
+0.99% |
+14.56% |
| Networking |
$NWX |
221.49 |
+5.11 |
+2.36% |
-2.23% |
| Internet |
$IIX |
363.14 |
+2.84 |
+0.79% |
+11.05% |
| Broker/Dealer |
$XBD |
111.30 |
+0.15 |
+0.14% |
+17.99% |
| Retail |
$RLX |
755.55 |
+10.20 |
+1.37% |
+15.69% |
| Gold & Silver |
$XAU |
109.94 |
+1.18 |
+1.08% |
-33.61% |
| Bank |
$BKX |
56.73 |
+0.29 |
+0.51% |
+10.63% |
| Biotech |
$BTK |
1,911.87 |
+22.05 |
+1.17% |
+23.58% |
|
|
|
 |
Big Volume Behind Surge to New High Territory
Kenneth J. Gruneisen - Passed the CAN SLIM® Master's Exam
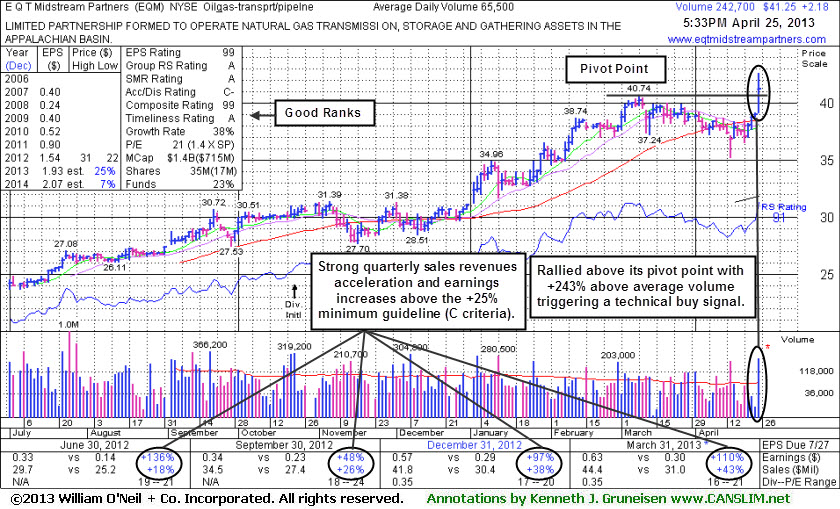
Often, when a leading stock is setting up to breakout of a solid base it is highlighted in CANSLIM.net's Mid-Day Breakouts Report. The most relevant factors are noted in the report which alerts prudent CANSLIM oriented investors to place the issue in their watch list. After doing any necessary backup research, the investor is prepared to act after the stock triggers a technical buy signal (breaks above its pivot point on more than +50% average turnover) but before it gets too extended from a sound base. In the event the stock fails to trigger a technical buy signal and its price declines then it will simply be removed from the watch list. Disciplined investors know to buy as near as possible to the pivot point and avoid chasing stocks after they have rallied more than +5% above their pivot point. It is crucial to always limit losses whenever any stock heads the wrong direction, and disciplined investors sell if a struggling stock ever falls more than -7% from their purchase price. E Q T Midstream Partners (EQM +$2.43 or +6.22% to $41.50) was highlighted in yellow with new pivot point based on its 3/08/13 high plus 10 cents in the earlier mid-day report (click here). A volume-driven gain and strong close above the pivot point of its 8-week flat base triggered a new technical buy signal. However, an overriding concern that remains is that the market (M criteria) has not yet confirmed the latest rally attempt with a solid follow through day from at least one of the major averages since the recently noted market correction began. Because 3 out of 4 stocks tend to go in the same direction as the major averages, investors' odds are best when buying stocks while the market is in a confirmed rally.
This MLP in the Natural Gas business rallied to a new 52-week high today with volume +243% above average. That volume total was well above the +40% above average volume threshold which is the bare minimum needed to confirm a proper technical buy signal. Heavy volume with a big price increase and surge into new high territory is a bullish indication of institutional accumulation. It is very reassuring, but not a guarantee that any stock will go on to produce great gains.
EQM rebounded above its 50-day moving average (DMA) line after recent distributional pressure. It reported strong results for the Mar '13 quarter, and quarterly earnings increases above the +25% minimum guideline (C criteria) with accelerating sales revenues increases are very reassuring. Prior mid-day reports cautioned - "Limited history is a concern and it has traded up considerably since its 6/27/12 IPO at $21."
|
|
|
Color Codes Explained :
Y - Better candidates highlighted by our
staff of experts.
G - Previously featured
in past reports as yellow but may no longer be buyable under the
guidelines.
***Last / Change / Volume data in this table is the closing quote data***
Symbol/Exchange
Company Name
Industry Group |
PRICE |
CHANGE
(%Change) |
Day High |
Volume
(% DAV)
(% 50 day avg vol) |
52 Wk Hi
% From Hi |
Featured
Date |
Price
Featured |
Pivot Featured |
|
Max Buy |
CELG
-
NASDAQ
Celgene Corp
DRUGS - Drug Manufacturers - Major
|
$117.95
|
-0.33
-0.28% |
$121.05
|
5,156,307
163.17% of 50 DAV
50 DAV is 3,160,100
|
$128.52
-8.22%
|
3/27/2013
|
$113.24
|
PP = $115.54
|
|
MB = $121.32
|
 Most Recent Note - 4/25/2013 11:54:30 AM
G - Holding its ground today after encountering distributional pressure and gapping down on the prior session, retreating with above average volume from its high. It is extended from any sound base. Its 50 DMA line ($111.84 now) defines important near-term support to watch.
>>> The latest Featured Stock Update with an annotated graph appeared on 4/19/2013. Click here.
View all notes |
Alert me of new notes |
CANSLIM.net Company Profile |
SEC |
Zacks Reports |
StockTalk |
News |
Chart |
Request a new note
C
A N
S L
I M


|
CMCSA
-
NASDAQ
Comcast Corp Cl A
MEDIA - CATV Systems
|
$40.75
|
+0.08
0.20% |
$41.02
|
12,009,271
83.95% of 50 DAV
50 DAV is 14,305,800
|
$42.61
-4.37%
|
12/3/2012
|
$37.08
|
PP = $38.06
|
|
MB = $39.96
|
Most Recent Note - 4/19/2013 12:11:14 PM
G - Rebounding toward its 50 DMA line today after violating that important short-term average with 2 prior losses marked by above average volume. A prompt rebound above its 50 DMA line is needed for its outlook to improve.
>>> The latest Featured Stock Update with an annotated graph appeared on 4/16/2013. Click here.
View all notes |
Alert me of new notes |
CANSLIM.net Company Profile |
SEC |
Zacks Reports |
StockTalk |
News |
Chart |
Request a new note
C
A N
S L
I M
|
EQM
-
NYSE
E Q T Midstream Partners
ENERGY - Oil and Gas Pipelines
|
$41.25
|
+2.18
5.58% |
$42.64
|
242,773
370.65% of 50 DAV
50 DAV is 65,500
|
$40.74
1.25%
|
4/25/2013
|
$40.16
|
PP = $40.84
|
|
MB = $42.88
|
Most Recent Note - 4/25/2013 6:01:41 PM
Y - Finished strong today after highlighted in yellow with new pivot point based on its 3/08/13 high plus 10 cents. The volume-driven gain and strong close above the pivot point of its 8-week flat base triggered a new technical buy signal. This MLP in the Natural Gas business rebounded above its 50 DMA line after recent distributional pressure. Reported strong results for the Mar '13 quarter, and quarterly earnings increases above the +25% minimum guideline (C criteria) with accelerating sales revenues increases are very reassuring. See the latest FSU analysis for more details and a new annotated graph.
>>> The latest Featured Stock Update with an annotated graph appeared on 4/25/2013. Click here.
View all notes |
Alert me of new notes |
CANSLIM.net Company Profile |
SEC |
Zacks Reports |
StockTalk |
News |
Chart |
Request a new note
C
A N
S L
I M
|
FLT
-
NYSE
Fleetcor Technologies
DIVERSIFIED SERVICES - Business/Management Services
|
$74.99
|
-0.94
-1.24% |
$76.41
|
954,960
122.38% of 50 DAV
50 DAV is 780,300
|
$78.87
-4.92%
|
3/21/2013
|
$71.14
|
PP = $73.00
|
|
MB = $76.65
|
Most Recent Note - 4/25/2013 6:04:39 PM
Y - Perched within close striking distance of its 52-week high, Made a stand near its 50 DMA line recently with a "positive reversal" on 4/19/13. More damaging losses below the 50 DMA line or recent low ($70.09) would raise more serious concerns and trigger a worrisome technical sell signal.
>>> The latest Featured Stock Update with an annotated graph appeared on 4/15/2013. Click here.
View all notes |
Alert me of new notes |
CANSLIM.net Company Profile |
SEC |
Zacks Reports |
StockTalk |
News |
Chart |
Request a new note
C
A N
S L
I M
|
LNKD
-
NYSE
Linkedin Corp Class A
INTERNET - Internet Information Providers
|
$187.87
|
+0.21
0.11% |
$191.78
|
1,991,392
92.97% of 50 DAV
50 DAV is 2,141,900
|
$188.52
-0.34%
|
4/12/2013
|
$182.69
|
PP = $184.25
|
|
MB = $193.46
|
Most Recent Note - 4/23/2013 9:03:56 PM
Y - Rallied with near average volume for a 3rd consecutive gain today and hit a new 52-week high. Volume-driven gains above the pivot point may clinch a proper new (or add-on) technical buy signal. Its 50 DMA line and recent low define important near-term chart support to watch.
>>> The latest Featured Stock Update with an annotated graph appeared on 4/5/2013. Click here.
View all notes |
Alert me of new notes |
CANSLIM.net Company Profile |
SEC |
Zacks Reports |
StockTalk |
News |
Chart |
Request a new note
C
A N
S L
I M
|
Symbol/Exchange
Company Name
Industry Group |
PRICE |
CHANGE
(%Change) |
Day High |
Volume
(% DAV)
(% 50 day avg vol) |
52 Wk Hi
% From Hi |
Featured
Date |
Price
Featured |
Pivot Featured |
|
Max Buy |
MRLN
-
NASDAQ
Marlin Business Services
DIVERSIFIED SERVICES - Rental and Leasing Services
|
$24.25
|
+0.57
2.41% |
$24.93
|
29,634
113.98% of 50 DAV
50 DAV is 26,000
|
$24.00
1.06%
|
3/15/2013
|
$22.29
|
PP = $23.18
|
|
MB = $24.34
|
Most Recent Note - 4/23/2013 9:01:29 PM
Y - Rallied for a new high close today but with light volume behind the gain, not volume indicative of institutional buying demand. Perched within close striking distance of its 52-week high and little resistance remains.
>>> The latest Featured Stock Update with an annotated graph appeared on 4/9/2013. Click here.
View all notes |
Alert me of new notes |
CANSLIM.net Company Profile |
SEC |
Zacks Reports |
StockTalk |
News |
Chart |
Request a new note
C
A N
S L
I M
|
MWIV
-
NASDAQ
M W I Veterinary Supply
HEALTH SERVICES - Medical Instruments and; Supplies
|
$118.81
|
-0.19
-0.16% |
$120.40
|
35,445
63.64% of 50 DAV
50 DAV is 55,700
|
$137.18
-13.39%
|
3/4/2013
|
$130.90
|
PP = $129.45
|
|
MB = $135.92
|
Most Recent Note - 4/24/2013 5:40:57 PM
G - Slumped near November highs defining near-term support while slumping further below its 50 DMA line. See the latest FSU analysis for more details and a new annotated graph.
>>> The latest Featured Stock Update with an annotated graph appeared on 4/24/2013. Click here.
View all notes |
Alert me of new notes |
CANSLIM.net Company Profile |
SEC |
Zacks Reports |
StockTalk |
News |
Chart |
Request a new note
C
A N
S L
I M
|
N
-
NYSE
Netsuite Inc
DIVERSIFIED SERVICES - Business/Management Services
|
$81.25
|
+1.14
1.42% |
$81.88
|
542,291
153.41% of 50 DAV
50 DAV is 353,500
|
$80.33
1.15%
|
12/12/2012
|
$64.75
|
PP = $67.12
|
|
MB = $70.48
|
Most Recent Note - 4/24/2013 1:03:03 PM
G - Still hovering near its all-time high in a tight trading range. Its 50 DMA line ($74.74 now) defines important near-term support to watch. Fundamental concerns were recently noted. Results for the first quarter 2013 will be released after the market close on Thursday, April 25, 2013.
>>> The latest Featured Stock Update with an annotated graph appeared on 4/22/2013. Click here.
View all notes |
Alert me of new notes |
CANSLIM.net Company Profile |
SEC |
Zacks Reports |
StockTalk |
News |
Chart |
Request a new note
C
A N
S L
I M
|
RRTS
-
NYSE
Roadrunner Trans Systems
TRANSPORTATION - Air Delivery and Freight Service
|
$22.66
|
+0.28
1.25% |
$22.93
|
64,120
34.25% of 50 DAV
50 DAV is 187,200
|
$23.88
-5.11%
|
4/3/2013
|
$22.77
|
PP = $23.75
|
|
MB = $24.94
|
Most Recent Note - 4/23/2013 8:58:25 PM
G - Still sputtering below its 50 DMA line after failing to trigger a new buy signal since featured on 4/03/13. A rebound above that important short-term average would help its outlook improve. See the latest FSU analysis for more details and a new annotated graph.
>>> The latest Featured Stock Update with an annotated graph appeared on 4/23/2013. Click here.
View all notes |
Alert me of new notes |
CANSLIM.net Company Profile |
SEC |
Zacks Reports |
StockTalk |
News |
Chart |
Request a new note
C
A N
S L
I M
|
VRX
-
NYSE
Valeant Pharmaceuticals
DRUGS - Drug Manufacturers - Other
|
$73.59
|
-1.23
-1.64% |
$74.95
|
1,542,541
113.74% of 50 DAV
50 DAV is 1,356,200
|
$76.56
-3.88%
|
12/20/2012
|
$60.24
|
PP = $61.21
|
|
MB = $64.27
|
Most Recent Note - 4/19/2013 1:18:34 PM
G - Finding recent support well above its 50 DMA line defining important near-term support.
>>> The latest Featured Stock Update with an annotated graph appeared on 4/8/2013. Click here.
View all notes |
Alert me of new notes |
CANSLIM.net Company Profile |
SEC |
Zacks Reports |
StockTalk |
News |
Chart |
Request a new note
C
A N
S L
I M
|
Symbol/Exchange
Company Name
Industry Group |
PRICE |
CHANGE
(%Change) |
Day High |
Volume
(% DAV)
(% 50 day avg vol) |
52 Wk Hi
% From Hi |
Featured
Date |
Price
Featured |
Pivot Featured |
|
Max Buy |
|
|
|
THESE ARE NOT BUY RECOMMENDATIONS!
Comments contained in the body of this report are technical
opinions only. The material herein has been obtained
from sources believed to be reliable and accurate, however,
its accuracy and completeness cannot be guaranteed.
This site is not an investment advisor, hence it does
not endorse or recommend any securities or other investments.
Any recommendation contained in this report may not
be suitable for all investors and it is not to be deemed
an offer or solicitation on our part with respect to
the purchase or sale of any securities. All trademarks,
service marks and trade names appearing in this report
are the property of their respective owners, and are
likewise used for identification purposes only.
This report is a service available
only to active Paid Premium Members.
You may opt-out of receiving report notifications
at any time. Questions or comments may be submitted
by writing to Premium Membership Services 665 S.E. 10 Street, Suite 201 Deerfield Beach, FL 33441-5634 or by calling 1-800-965-8307
or 954-785-1121.
|
|
|

