***Last / Change / Volume data in this table is the closing quote data***
Symbol/Exchange
Company Name
Industry Group |
PRICE |
CHANGE
(%Change) |
Day High |
Volume
(% DAV)
(% 50 day avg vol) |
52 Wk Hi
% From Hi |
Featured
Date |
Price
Featured |
Pivot Featured |
|
Max Buy |
AIXG
-
NASDAQ
Aixtron Se
ELECTRONICS - Semiconductor Equipment andamp; Mate
|
$41.68
|
-0.38
-0.90% |
$42.09
|
261,896
103.48% of 50 DAV
50 DAV is 253,100
|
$44.96
-7.30%
|
4/5/2011
|
$44.14
|
PP = $44.64
|
|
MB = $46.87
|
Most Recent Note - 4/20/2011 11:34:07 AM
G - Gapped up today after finding support near prior lows in the $38 area. Its 50 DMA line may now act as resistance, while a convincing rebound above that important short-term average would help its outlook.
>>> The latest Featured Stock Update with an annotated graph appeared on 4/5/2011. Click here.
View all notes |
Alert me of new notes |
CANSLIM.net Company Profile |
SEC |
Zacks Reports |
StockTalk |
News |
Chart |
Request a new note
C
A N
S L
I M


|
BIDU
-
NASDAQ
Baidu Inc Ads
INTERNET - Internet Information Providers
|
$151.96
|
+3.31
2.23% |
$152.58
|
6,286,182
90.12% of 50 DAV
50 DAV is 6,975,200
|
$154.00
-1.32%
|
3/17/2011
|
$121.97
|
PP = $131.73
|
|
MB = $138.32
|
 Most Recent Note - 4/25/2011 7:20:16 PM
G - Up on light volume today for another new high close. It is extended from its latest base, and the prior high near $131 defines initial chart support to watch near its rising 50 DMA line.
>>> The latest Featured Stock Update with an annotated graph appeared on 4/7/2011. Click here.
View all notes |
Alert me of new notes |
CANSLIM.net Company Profile |
SEC |
Zacks Reports |
StockTalk |
News |
Chart |
Request a new note
C
A N
S L
I M
|
CMG
-
NYSE
Chipotle Mexican Grill
LEISURE - Restaurants
|
$272.65
|
-4.65
-1.68% |
$276.91
|
938,804
79.45% of 50 DAV
50 DAV is 1,181,700
|
$289.35
-5.77%
|
4/1/2011
|
$274.00
|
PP = $275.10
|
|
MB = $288.86
|
Most Recent Note - 4/21/2011 12:39:47 PM
G - Gapped down today after reporting earnings +23% on +24% sales revenues for the quarter ended March 31, 2011 versus the year ago period. It marked its weakest earning increase in years, and slumping below the +25% guideline raises fundamental concerns. Its color code was changed to green. Volume and volatility often increase near earnings news. On the prior session its gain with +61% above average volume had helped it rally for a new high and confirmed a technical buy signal. Its 50 DMA line ($261.20 now) defines important chart support to watch.
>>> The latest Featured Stock Update with an annotated graph appeared on 4/13/2011. Click here.
View all notes |
Alert me of new notes |
CANSLIM.net Company Profile |
SEC |
Zacks Reports |
StockTalk |
News |
Chart |
Request a new note
C
A N
S L
I M
|
CTCT
-
NASDAQ
Constant Contact Inc
MEDIA - Advertising Services
|
$31.17
|
+0.08
0.24% |
$31.46
|
423,459
92.72% of 50 DAV
50 DAV is 456,700
|
$36.33
-14.20%
|
3/22/2011
|
$33.59
|
PP = $32.49
|
|
MB = $34.11
|
Most Recent Note - 4/20/2011 5:42:52 PM
G - Small gain today with light volume following 2 damaging losses with heavy volume in prior 3 sessions. Concerns were raised as it completely negated its recent breakout, slumping below its 50 DMA line again and triggering worrisome technical sell signals. Due to report earnings after the close on Thursday, April 28th. See the latest FSU analysis for details and a new annotated graph.
>>> The latest Featured Stock Update with an annotated graph appeared on 4/19/2011. Click here.
View all notes |
Alert me of new notes |
CANSLIM.net Company Profile |
SEC |
Zacks Reports |
StockTalk |
News |
Chart |
Request a new note
C
A N
S L
I M
|
CTSH
-
NASDAQ
Cognizant Tech Sol Cl A
COMPUTER SOFTWARE and SERVICES - Business Software and Services
|
$81.83
|
-0.64
-0.78% |
$82.90
|
1,617,633
74.56% of 50 DAV
50 DAV is 2,169,600
|
$82.93
-1.33%
|
2/7/2011
|
$75.09
|
PP = $76.46
|
|
MB = $80.28
|
Most Recent Note - 4/20/2011 4:50:19 PM
G - Gapped up today, rallying with below average volume to finish -1% off its all-time high. This week it tested prior highs in the $77-78 area and its 50 DMA line and found prompt support. See the latest FSU analysis for more details and a new annotated graph.
>>> The latest Featured Stock Update with an annotated graph appeared on 4/15/2011. Click here.
View all notes |
Alert me of new notes |
CANSLIM.net Company Profile |
SEC |
Zacks Reports |
StockTalk |
News |
Chart |
Request a new note
C
A N
S L
I M
|
Symbol/Exchange
Company Name
Industry Group |
PRICE |
CHANGE
(%Change) |
Day High |
Volume
(% DAV)
(% 50 day avg vol) |
52 Wk Hi
% From Hi |
Featured
Date |
Price
Featured |
Pivot Featured |
|
Max Buy |
DECK
-
NASDAQ
Deckers Outdoor Corp
CONSUMER NON-DURABLES - Textile - Apparel Footwear
|
$95.92
|
-0.19
-0.20% |
$96.72
|
610,941
46.19% of 50 DAV
50 DAV is 1,322,800
|
$97.00
-1.11%
|
2/3/2011
|
$79.61
|
PP = $82.67
|
|
MB = $86.80
|
Most Recent Note - 4/20/2011 4:51:35 PM
G - Gapped up today and hit a new all-time high with a gain on light volume while rising from a shorter than minimum length "cup-with-handle" type consolidation. Its 50 DMA line defines initial chart support to watch.
>>> The latest Featured Stock Update with an annotated graph appeared on 4/6/2011. Click here.
View all notes |
Alert me of new notes |
CANSLIM.net Company Profile |
SEC |
Zacks Reports |
StockTalk |
News |
Chart |
Request a new note
C
A N
S L
I M
|
EZPW
-
NASDAQ
Ezcorp Inc Cl A
SPECIALTY RETAIL - Specialty Retail, Other
|
$30.44
|
+0.44
1.47% |
$31.89
|
570,016
159.49% of 50 DAV
50 DAV is 357,400
|
$33.08
-7.98%
|
2/18/2011
|
$27.94
|
PP = $30.04
|
|
MB = $31.54
|
Most Recent Note - 4/25/2011 7:24:57 PM
G - Closed near the session low after gapping up today, posting its 4th consecutive gain with volume increasing to above average. Reported earnings +31% on +21% sales revenues for the quarter ended March 31, 2011 versus the year ago period. Last week it rebounded above its 50 DMA line and prior highs in the $29-30 area, helping its outlook.
>>> The latest Featured Stock Update with an annotated graph appeared on 4/11/2011. Click here.
View all notes |
Alert me of new notes |
CANSLIM.net Company Profile |
SEC |
Zacks Reports |
StockTalk |
News |
Chart |
Request a new note
C
A N
S L
I M
|
FOSL
-
NASDAQ
Fossil Inc
CONSUMER DURABLES - Recreational Goods, Other
|
$96.63
|
-0.08
-0.08% |
$96.99
|
373,140
37.39% of 50 DAV
50 DAV is 997,900
|
$96.99
-0.37%
|
2/1/2011
|
$73.30
|
PP = $74.44
|
|
MB = $78.16
|
Most Recent Note - 4/20/2011 11:31:25 AM
G - Gapped up today and hit a new all-time high. Previously noted - "It rallied more than +108% higher in 8 months since first featured in yellow in the 8/10/10 mid-day report (read here). It could produce more climactic gains, but recently it has been noted - "Extended from any sound base. Prior highs in the $83-85 area define chart support to watch above its 50 DMA line."
>>> The latest Featured Stock Update with an annotated graph appeared on 3/30/2011. Click here.
View all notes |
Alert me of new notes |
CANSLIM.net Company Profile |
SEC |
Zacks Reports |
StockTalk |
News |
Chart |
Request a new note
C
A N
S L
I M
|
HMSY
-
NASDAQ
H M S Holdings Corp
COMPUTER SOFTWARE and SERVICES - Healthcare Information Service
|
$81.45
|
-0.25
-0.31% |
$81.69
|
152,666
92.08% of 50 DAV
50 DAV is 165,800
|
$84.82
-3.97%
|
11/19/2010
|
$61.89
|
PP = $63.01
|
|
MB = $66.16
|
Most Recent Note - 4/20/2011 5:35:26 PM
G - Perched -4.9% below its all-time high today after churning slightly above average volume the past couple of sessions during its short consolidation above its 50 DMA line ($78.29 now).
>>> The latest Featured Stock Update with an annotated graph appeared on 3/25/2011. Click here.
View all notes |
Alert me of new notes |
CANSLIM.net Company Profile |
SEC |
Zacks Reports |
StockTalk |
News |
Chart |
Request a new note
C
A N
S L
I M
|
HS
-
NYSE
Healthspring Inc
HEALTH SERVICES - Health Care Plans
|
$39.56
|
-0.59
-1.47% |
$40.29
|
563,966
64.92% of 50 DAV
50 DAV is 868,700
|
$40.78
-2.99%
|
3/22/2011
|
$38.29
|
PP = $38.85
|
|
MB = $40.79
|
Most Recent Note - 4/21/2011 6:11:09 PM
Y - Gain today with below average volume for a new high close. Its 50 DMA line ($37.19 now) defines important support above recent lows in the $35.50 area. See the latest FSU analysis for more details and a new annotated graph.
>>> The latest Featured Stock Update with an annotated graph appeared on 4/21/2011. Click here.
View all notes |
Alert me of new notes |
CANSLIM.net Company Profile |
SEC |
Zacks Reports |
StockTalk |
News |
Chart |
Request a new note
C
A N
S L
I M
|
Symbol/Exchange
Company Name
Industry Group |
PRICE |
CHANGE
(%Change) |
Day High |
Volume
(% DAV)
(% 50 day avg vol) |
52 Wk Hi
% From Hi |
Featured
Date |
Price
Featured |
Pivot Featured |
|
Max Buy |
INFA
-
NASDAQ
Informatica Corp
COMPUTER SOFTWARE and SERVICES - Business Software and Services
|
$54.23
|
+1.13
2.13% |
$54.00
|
1,762,058
187.79% of 50 DAV
50 DAV is 938,300
|
$53.95
0.52%
|
3/24/2011
|
$50.04
|
PP = $49.86
|
|
MB = $52.35
|
Most Recent Note - 4/25/2011 11:58:07 AM
G - Reported +33% earnings on +24% sales revenues for the quarter ended March 31, 2011 versus the year ago period. Touched a new 52-week high today. Prior highs in the $49 area define support to watch coinciding with its 50 DMA line.
>>> The latest Featured Stock Update with an annotated graph appeared on 3/28/2011. Click here.
View all notes |
Alert me of new notes |
CANSLIM.net Company Profile |
SEC |
Zacks Reports |
StockTalk |
News |
Chart |
Request a new note
C
A N
S L
I M
|
LULU
-
NASDAQ
Lululemon Athletica
MANUFACTURING - Textile Manufacturing
|
$101.38
|
-0.79
-0.77% |
$102.53
|
889,377
38.88% of 50 DAV
50 DAV is 2,287,300
|
$102.83
-1.41%
|
3/28/2011
|
$68.11
|
PP = $85.38
|
|
MB = $89.65
|
Most Recent Note - 4/21/2011 3:10:57 PM
G - Hitting another new all-time high today, this high-ranked Retail-Apparel firm is extended from any sound base pattern. Prior highs in the $85 area define initial chart support to watch.
>>> The latest Featured Stock Update with an annotated graph appeared on 3/31/2011. Click here.
View all notes |
Alert me of new notes |
CANSLIM.net Company Profile |
SEC |
Zacks Reports |
StockTalk |
News |
Chart |
Request a new note
C
A N
S L
I M
|
MG
-
NYSE
Mistras Group Inc
DIVERSIFIED SERVICES - Bulding and Faci;ity Management Services
|
$18.35
|
+0.10
0.55% |
$18.40
|
60,804
45.99% of 50 DAV
50 DAV is 132,200
|
$18.25
0.55%
|
3/15/2011
|
$15.48
|
PP = $15.90
|
|
MB = $16.70
|
Most Recent Note - 4/21/2011 6:06:43 PM
G - Closed at the session high today and matched its all-time high with above average volume behind a 7th consecutive gain. It is extended from any sound base pattern, meanwhile its 50 DMA line and prior highs define important support to watch.
>>> The latest Featured Stock Update with an annotated graph appeared on 4/12/2011. Click here.
View all notes |
Alert me of new notes |
CANSLIM.net Company Profile |
SEC |
Zacks Reports |
StockTalk |
News |
Chart |
Request a new note
C
A N
S L
I M
|
MWIV
-
NASDAQ
M W I Veterinary Supply
HEALTH SERVICES - Medical Instruments and; Supplies
|
$80.49
|
-3.76
-4.46% |
$84.28
|
144,954
147.46% of 50 DAV
50 DAV is 98,300
|
$84.97
-5.27%
|
11/4/2010
|
$61.79
|
PP = $59.60
|
|
MB = $62.58
|
Most Recent Note - 4/25/2011 12:09:16 PM
G - Pulling back today from the new all-time high hit on the prior session. Since first featured in yellow on 7/29/10 it has traded as much as +63% higher. Extended from any sound base pattern, its 50 DMA line defines important support to watch.
>>> The latest Featured Stock Update with an annotated graph appeared on 4/8/2011. Click here.
View all notes |
Alert me of new notes |
CANSLIM.net Company Profile |
SEC |
Zacks Reports |
StockTalk |
News |
Chart |
Request a new note
C
A N
S L
I M
|
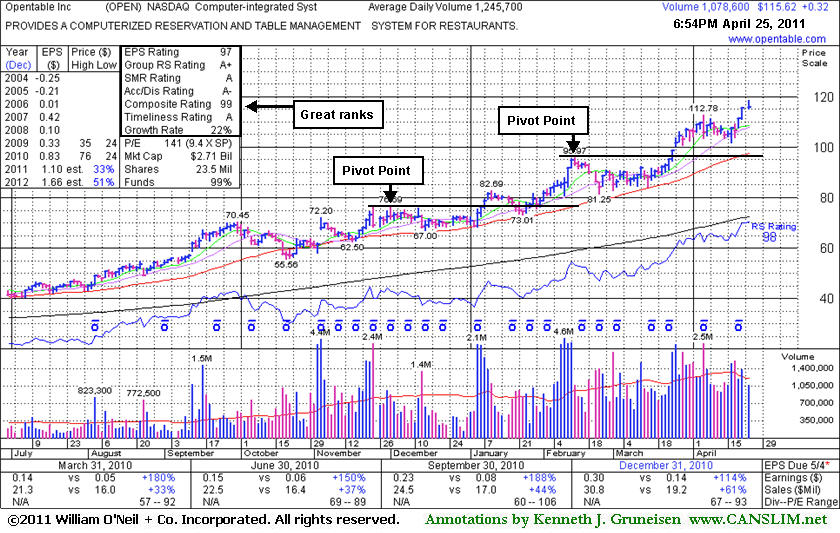
OPEN
-
NASDAQ
Opentable Inc
INTERNET - Internet Software and Services
|
$115.62
|
+0.32
0.28% |
$118.66
|
1,079,102
86.63% of 50 DAV
50 DAV is 1,245,700
|
$115.90
-0.24%
|
3/17/2011
|
$90.71
|
PP = $96.07
|
|
MB = $100.87
|
Most Recent Note - 4/25/2011 3:55:10 PM
G - Hit yet another new all-time high with an early gain today, then quietly held its ground. Repeatedly noted - "Extended from its latest base. Prior highs near $96 and its 50 DMA line define support to watch on pullbacks.
>>> The latest Featured Stock Update with an annotated graph appeared on 4/25/2011. Click here.
View all notes |
Alert me of new notes |
CANSLIM.net Company Profile |
SEC |
Zacks Reports |
StockTalk |
News |
Chart |
Request a new note
C
A N
S L
I M
|
Symbol/Exchange
Company Name
Industry Group |
PRICE |
CHANGE
(%Change) |
Day High |
Volume
(% DAV)
(% 50 day avg vol) |
52 Wk Hi
% From Hi |
Featured
Date |
Price
Featured |
Pivot Featured |
|
Max Buy |
PAY
-
NYSE
Verifone Systems Inc
COMPUTER HARDWARE - Transaction Automation Systems
|
$54.85
|
+1.28
2.39% |
$54.66
|
1,686,126
69.37% of 50 DAV
50 DAV is 2,430,800
|
$58.88
-6.84%
|
1/27/2011
|
$41.77
|
PP = $44.97
|
|
MB = $47.22
|
Most Recent Note - 4/25/2011 7:22:24 PM
G - Finished near the session high today with a 4th consecutive small gain. Its 50 DMA line ($51.05 now) defines important chart support to watch.
>>> The latest Featured Stock Update with an annotated graph appeared on 4/4/2011. Click here.
View all notes |
Alert me of new notes |
CANSLIM.net Company Profile |
SEC |
Zacks Reports |
StockTalk |
News |
Chart |
Request a new note
C
A N
S L
I M
|
PCLN
-
NASDAQ
Priceline.Com Inc
INTERNET - Internet Software and Services
|
$544.31
|
+0.36
0.07% |
$547.91
|
567,352
47.57% of 50 DAV
50 DAV is 1,192,600
|
$544.27
0.01%
|
1/3/2011
|
$399.55
|
PP = $428.20
|
|
MB = $449.61
|
Most Recent Note - 4/21/2011 6:09:18 PM
G - Closed near the session high today and hit a new 52-week high with a 3rd consecutive gain on below average volume. Without great volume conviction behind any recent gains, it has been repeatedly noted - "Extended from any sound base pattern. Its 50 DMA line has defined support throughout its advance."
>>> The latest Featured Stock Update with an annotated graph appeared on 4/20/2011. Click here.
View all notes |
Alert me of new notes |
CANSLIM.net Company Profile |
SEC |
Zacks Reports |
StockTalk |
News |
Chart |
Request a new note
C
A N
S L
I M
|
RAX
-
NYSE
Rackspace Hosting Inc
INTERNET - Internet Software and; Services
|
$44.75
|
+0.06
0.13% |
$45.41
|
1,010,973
58.29% of 50 DAV
50 DAV is 1,734,500
|
$44.88
-0.29%
|
3/16/2011
|
$36.28
|
PP = $40.72
|
|
MB = $42.76
|
Most Recent Note - 4/20/2011 12:47:23 PM
G - Gapped up and hit a new all-time high today following a brief consolidation during which volume totals cooled after its latest breakout. Prior highs near $40 define support above its 50 DMA line. See the latest FSU analysis for additional details and a new annotated graph.
>>> The latest Featured Stock Update with an annotated graph appeared on 4/18/2011. Click here.
View all notes |
Alert me of new notes |
CANSLIM.net Company Profile |
SEC |
Zacks Reports |
StockTalk |
News |
Chart |
Request a new note
C
A N
S L
I M
|
TIBX
-
NASDAQ
Tibco Software Inc
COMPUTER SOFTWARE and SERVICES - Business Software and Services
|
$29.93
|
+0.16
0.54% |
$29.79
|
2,066,316
85.38% of 50 DAV
50 DAV is 2,420,200
|
$29.85
0.27%
|
3/18/2011
|
$23.88
|
PP = $26.04
|
|
MB = $27.34
|
Most Recent Note - 4/20/2011 5:03:45 PM
G - Small gap up gain today with below average volume for its second best close. It is extended from a sound base after a spurt of volume-driven gains. As previously noted, support is defined by prior highs in the $25-26 area and its 50 DMA line.
>>> The latest Featured Stock Update with an annotated graph appeared on 4/14/2011. Click here.
View all notes |
Alert me of new notes |
CANSLIM.net Company Profile |
SEC |
Zacks Reports |
StockTalk |
News |
Chart |
Request a new note
C
A N
S L
I M
|
UA
-
NYSE
Under Armour Inc Cl A
CONSUMER NON-DURABLES - Textile - Apparel Clothing
|
$78.47
|
-0.06
-0.08% |
$80.00
|
864,241
114.82% of 50 DAV
50 DAV is 752,700
|
$79.59
-1.41%
|
3/31/2011
|
$68.04
|
PP = $70.79
|
|
MB = $74.33
|
Most Recent Note - 4/20/2011 1:10:25 PM
G - Small gap up today following a strong finish for considerable gain on higher volume, hitting new all-time highs and getting more extended from its latest sound base pattern. Due to report earnings on the morning of Tuesday, April 26th for the latest quarter ended March 31, 2011. Prior highs in the $70 area define support to watch above its 50 DMA line.
>>> The latest Featured Stock Update with an annotated graph appeared on 4/1/2011. Click here.
View all notes |
Alert me of new notes |
CANSLIM.net Company Profile |
SEC |
Zacks Reports |
StockTalk |
News |
Chart |
Request a new note
C
A N
S L
I M
|
Symbol/Exchange
Company Name
Industry Group |
PRICE |
CHANGE
(%Change) |
Day High |
Volume
(% DAV)
(% 50 day avg vol) |
52 Wk Hi
% From Hi |
Featured
Date |
Price
Featured |
Pivot Featured |
|
Max Buy |
ULTA
-
NASDAQ
Ulta Salon Cosm & Frag
SPECIALTY RETAIL - Specialty Retail, Other
|
$52.72
|
-0.16
-0.30% |
$53.89
|
346,910
56.46% of 50 DAV
50 DAV is 614,400
|
$53.99
-2.35%
|
1/6/2011
|
$36.12
|
PP = $37.34
|
|
MB = $39.21
|
Most Recent Note - 4/20/2011 11:29:14 AM
G - Gapped up and hit a new all-time high today. It is extended from any sound base. Its 50 DMA line defines chart support to watch well above prior highs.
>>> The latest Featured Stock Update with an annotated graph appeared on 3/29/2011. Click here.
View all notes |
Alert me of new notes |
CANSLIM.net Company Profile |
SEC |
Zacks Reports |
StockTalk |
News |
Chart |
Request a new note
C
A N
S L
I M
|