You are not logged in.
This means you
CAN ONLY VIEW reports that were published prior to Monday, April 14, 2025.
You
MUST UPGRADE YOUR MEMBERSHIP if you want to see any current reports.
AFTER MARKET UPDATE - THURSDAY, APRIL 24TH, 2014
Previous After Market Report Next After Market Report >>>
|
|
|
|
DOW |
+0.00 |
16,501.65 |
+0.00% |
|
Volume |
646,004,780 |
-0% |
|
Volume |
1,993,082,190 |
+23% |
|
NASDAQ |
+21.37 |
4,148.34 |
+0.52% |
|
Advancers |
1,548 |
49% |
|
Advancers |
1,131 |
41% |
|
S&P 500 |
+3.22 |
1,878.61 |
+0.17% |
|
Decliners |
1,470 |
46% |
|
Decliners |
1,536 |
55% |
|
Russell 2000 |
-2.73 |
1,144.35 |
-0.24% |
|
52 Wk Highs |
133 |
|
|
52 Wk Highs |
59 |
|
|
S&P 600 |
-1.88 |
659.81 |
-0.28% |
|
52 Wk Lows |
16 |
|
|
52 Wk Lows |
26 |
|
|
 |
S&P 500 and Dow Industrials Both Poised For Best-Ever Weekly Close
Kenneth J. Gruneisen - Passed the CAN SLIM® Master's Exam
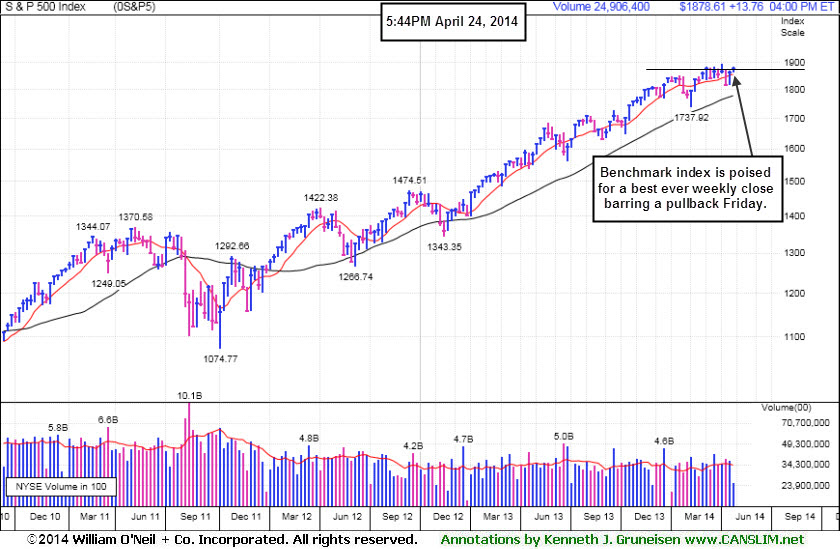
The major averages finished mostly higher on Thursday. The volume total rose versus the prior session on the Nasdaq exchange while volume was slightly lower on the NYSE. Advancers narrowly outnumbered decliners on the NYSE but decliners led advancers by a 5-4 margin on the Nasdaq exchange. There were 34 high-ranked companies from the CANSLIM.net Leaders List that made new 52-week highs and appeared on the CANSLIM.net BreakOuts Page, up from the total of 26 stocks on the prior session. New 52-week highs outnumbered new 52-week lows on the NYSE and on the Nasdaq exchange. All 4 of the high-ranked companies currently included on the Featured Stocks Page posted gains. The Dow Jones Industrial Average and benchmark S&P 500 Index both are poised to end at new all-time high closes on their weekly graphs barring a setback on Friday. More significant gains from the major indices backed by heavier volume would be a meaningful improvement that more convincingly argues the Market (M criteria) is shifting back to a confirmed uptrend. Keep in mind that any sustained and meaningful market advance requires leadership - a healthy crop of stocks hitting new 52-week highs.
Stocks finished slightly higher after toggling between gains and losses as investors assessed a large batch of earnings reports and economic data. On the economic front, jobless claims unexpectedly jumped due to the seasonal adjustment around Easter and durable goods orders increased by the most in four months.
Six of the 10 S&P 500 sectors finished in negative territory. Telecommunications and materials were the worst performing groups. Verizon (VZ -2.42%) fell after posting a disappointing profit tally and a drop in wireless subscribers. Praxair (PX -0.80%) edged lower as the company reported sales and second-quarter guidance below analyst estimates.
On the upside, the technology sector staged a rally. Shares of Apple (AAPL +8.20%) jumped after the iPhone maker topped earnings expectations, raised its dividend and announced a seven-for-one stock split. Texas Instruments (TXN +4.33%) rose as it also posted a better-than-expected first-quarter profit and revenue.
Treasuries rose for a second day and a government auction of seven-year notes attracted higher-than-average demand. The 10-year note gained 4/32 to yield 2.68%. The 30-year bond was up 13/32 to yield 3.46%.
The CANSLIM.net Featured Stocks Page shows the most action-worthy candidates and their latest notes and a Headline Link directs members to the latest detailed analysis with data-packed graphs annotated by a Certified expert along with links to additional resources. The Premium Member Homepage includes "dynamic archives" to all prior pay reports published. Watch for an announcement via email concerning the next WEBCAST.
PICTURED: The S&P 500 Index posted a small gain, leaving it poised for a best-ever close on a weekly graph, barring a setback on Friday. Below its 50-day moving average (DMA) line a prior low ($1,814.36 on 4/11/14) defines the next important support level where further deterioration would raise serious concerns.
|
 Kenneth J. Gruneisen started out as a licensed stockbroker in August 1987, a couple of months prior to the historic stock market crash that took the Dow Jones Industrial Average down -22.6% in a single day. He has published daily fact-based fundamental and technical analysis on high-ranked stocks online for two decades. Through FACTBASEDINVESTING.COM, Kenneth provides educational articles, news, market commentary, and other information regarding proven investment systems that work in good times and bad.
Comments contained in the body of this report are technical opinions only and are not necessarily those of Gruneisen Growth Corp. The material herein has been obtained from sources believed to be reliable and accurate, however, its accuracy and completeness cannot be guaranteed. Our firm, employees, and customers may effect transactions, including transactions contrary to any recommendation herein, or have positions in the securities mentioned herein or options with respect thereto. Any recommendation contained in this report may not be suitable for all investors and it is not to be deemed an offer or solicitation on our part with respect to the purchase or sale of any securities. |
|
 |
Retail and Semiconductor Index Posted Best Gains
Kenneth J. Gruneisen - Passed the CAN SLIM® Master's Exam
The Retail Index ($RLX +0.95%) posted a solid gain on Thursday and the Broker/Dealer Index ($XBD +0.08%) finished flat, meanwhile the Bank Index ($BKX -0.70%) was a negative influence on the major averages. The Semiconductor Index ($SOX +0.55%) posted a small gain while the Biotechnology Index ($BTK -0.37%) and the Networking Index ($NWX -0.15%) edged lower. The Integrated Oil Index ($XOI +0.32%) eked out a small gain while the Oil Services Index ($OSX -1.74%) and the Gold & Silver Index ($XAU -1.36%) both fell.
Charts courtesy www.stockcharts.com
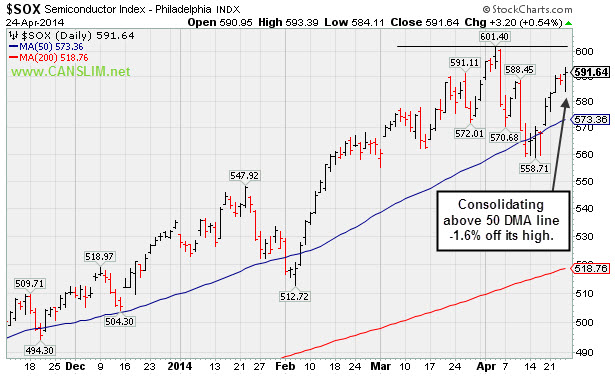
PICTURED: The Semiconductor Index ($SOX +0.55%) is consolidating above its 50-day moving average (DMA) line and -1.6% off its high.
| Oil Services |
$OSX |
296.24 |
-5.25 |
-1.74% |
+5.41% |
| Integrated Oil |
$XOI |
1,594.44 |
+5.04 |
+0.32% |
+6.07% |
| Semiconductor |
$SOX |
591.64 |
+3.21 |
+0.55% |
+10.58% |
| Networking |
$NWX |
335.77 |
-0.52 |
-0.15% |
+3.65% |
| Broker/Dealer |
$XBD |
156.14 |
+0.12 |
+0.08% |
-2.75% |
| Retail |
$RLX |
880.12 |
+8.26 |
+0.95% |
-6.35% |
| Gold & Silver |
$XAU |
91.62 |
-1.26 |
-1.36% |
+8.88% |
| Bank |
$BKX |
69.37 |
-0.49 |
-0.70% |
+0.16% |
| Biotech |
$BTK |
2,500.55 |
-9.38 |
-0.37% |
+7.30% |
|
|
|
 |
Rebound Above 50-Day Average Needed to Improve Outlook
Kenneth J. Gruneisen - Passed the CAN SLIM® Master's Exam
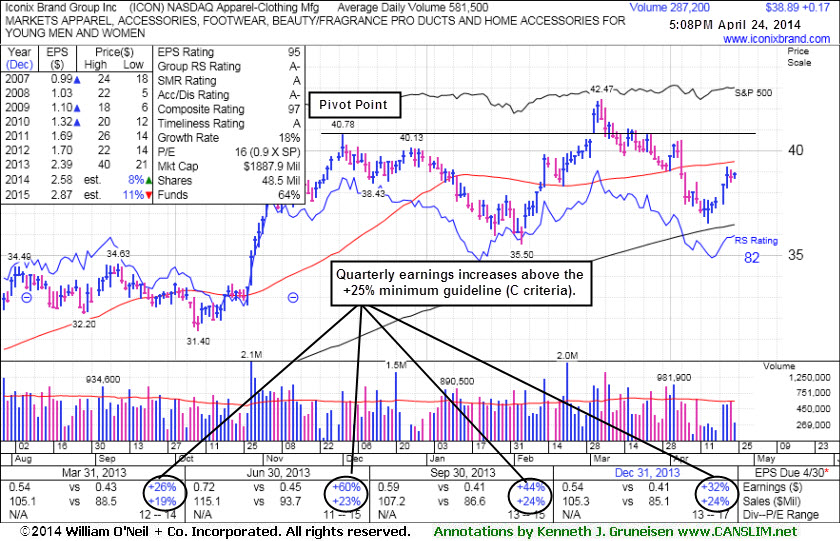
Iconix Brand Group Inc (ICON +$0.17 or +0.44% to $38.89) halted its slide above its 200-day moving average (DMA) line but recent gains came on light or near average volume. A rebound above the 50 DMA line is needed to help its outlook. Its Relative Strength rating is 82, above the 80+ minimum rank for buy candidates under the fact-based system.
ICON was last shown in this FSU section on 4/10/14 with annotated graphs under the headline, "Violated 50-Day Average and Relative Strength Rank Fell", while a loss on higher (above average) volume indicated that it was encountering distributional pressure. Members were reminded - "Disciplined investors always limit losses by selling any stock that falls more than -7% from their purchase price."
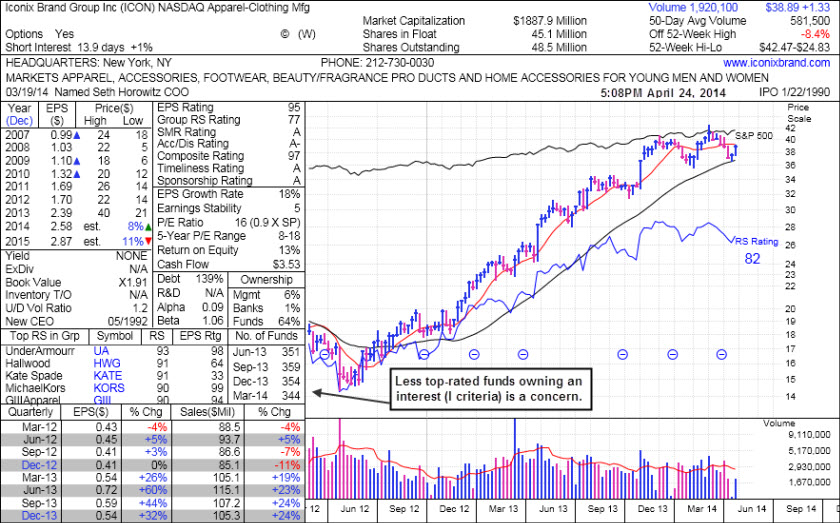
After slumping back into its prior base weeks ago it also sank below its 50 DMA line raising more concerns and triggering a technical sell signal. The number of top-rated funds owning its shares fell from 359 in Sep '13 to 346 in Mar '14, not a reassuring sign concerning the I criteria.
Fundamentals remain strong for the high-ranked Apparel - Clothing Manufacturing firm. It reported earnings +32% on +24% sales revenues for the Dec '13 quarter, marking its 4th consecutive quarterly earnings increase above the +25% guideline (C criteria). Its annual earnings (A criteria) history has been steady.
|
|
|
Color Codes Explained :
Y - Better candidates highlighted by our
staff of experts.
G - Previously featured
in past reports as yellow but may no longer be buyable under the
guidelines.
***Last / Change / Volume data in this table is the closing quote data***
Symbol/Exchange
Company Name
Industry Group |
PRICE |
CHANGE
(%Change) |
Day High |
Volume
(% DAV)
(% 50 day avg vol) |
52 Wk Hi
% From Hi |
Featured
Date |
Price
Featured |
Pivot Featured |
|
Max Buy |
EQM
-
NYSE
E Q T Midstream Partners
ENERGY - Oil and Gas Pipelines
|
$76.18
|
+0.42
0.55% |
$77.40
|
148,554
129.18% of 50 DAV
50 DAV is 115,000
|
$77.77
-2.04%
|
12/12/2013
|
$53.17
|
PP = $56.51
|
|
MB = $59.34
|
 Most Recent Note - 4/24/2014 6:08:34 PM
G - Hovering at its all-time high and in strong shape, technically, despite fundamental concerns recently noted. Its 50 DMA line ($68.61) defines near-term support where a violation may trigger a technical sell signal.
>>> FEATURED STOCK ARTICLE : Technical Strength Continues Despite Fundamental Concerns - 4/9/2014
View all notes |
Set NEW NOTE alert |
CANSLIM.net Company Profile |
SEC
News |
Chart |
Request a new note
C
A N
S L
I M


|
GNRC
-
NYSE
Generac Hldgs Inc
Electrical-Power/Equipmt
|
$59.03
|
+0.28
0.48% |
$59.43
|
472,727
65.75% of 50 DAV
50 DAV is 719,000
|
$62.50
-5.55%
|
2/14/2014
|
$56.50
|
PP = $57.39
|
|
MB = $60.26
|
Most Recent Note - 4/24/2014 6:10:00 PM
Y - Edged higher today for its 8th consecutive small gain on below average volume. Found support near its 50 DMA line and prior highs in the $57 area recently. More damaging losses below its recent low ($55.27 on 4/14/14) would raise greater concerns.
>>> FEATURED STOCK ARTICLE : Finished Just Below its 50-Day Average Line - 4/11/2014
View all notes |
Set NEW NOTE alert |
CANSLIM.net Company Profile |
SEC
News |
Chart |
Request a new note
C
A N
S L
I M
|
ICON
-
NASDAQ
Iconix Brand Group Inc
CONSUMER NON-DURABLES - Textile - Apparel Footwear
|
$38.89
|
+0.17
0.44% |
$38.97
|
287,769
49.53% of 50 DAV
50 DAV is 581,000
|
$42.47
-8.42%
|
3/7/2014
|
$41.46
|
PP = $40.88
|
|
MB = $42.92
|
Most Recent Note - 4/24/2014 6:05:47 PM
G - Posted a gain on light volume today. A rebound above the 50 DMA line (now $39.47) is needed to help its outlook. See the latest FSU analysis for more details and new annotated graphs.
>>> FEATURED STOCK ARTICLE : Rebound Above 50-Day Average Needed to Improve Outlook - 4/24/2014
View all notes |
Set NEW NOTE alert |
CANSLIM.net Company Profile |
SEC
News |
Chart |
Request a new note
C
A N
S L
I M
|
PSIX
-
NASDAQ
Power Solutions Intl Inc
Machinery-Gen Industrial
|
$81.40
|
+0.89
1.11% |
$81.85
|
92,707
140.47% of 50 DAV
50 DAV is 66,000
|
$87.40
-6.86%
|
2/28/2014
|
$74.65
|
PP = $76.93
|
|
MB = $80.78
|
Most Recent Note - 4/24/2014 6:07:20 PM
G- Posted a gain today with higher volume and it is perched within close striking distance of its 52-week high. The recent low ($66.03 on 4/07/14) defines important near-term support below the 50 DMA line where further deterioration would raise greater concerns.
>>> FEATURED STOCK ARTICLE : Halted Slide After Slump Below 50-Day Moving Average - 4/14/2014
View all notes |
Set NEW NOTE alert |
CANSLIM.net Company Profile |
SEC
News |
Chart |
Request a new note
C
A N
S L
I M
|
|
|
|
THESE ARE NOT BUY RECOMMENDATIONS!
Comments contained in the body of this report are technical
opinions only. The material herein has been obtained
from sources believed to be reliable and accurate, however,
its accuracy and completeness cannot be guaranteed.
This site is not an investment advisor, hence it does
not endorse or recommend any securities or other investments.
Any recommendation contained in this report may not
be suitable for all investors and it is not to be deemed
an offer or solicitation on our part with respect to
the purchase or sale of any securities. All trademarks,
service marks and trade names appearing in this report
are the property of their respective owners, and are
likewise used for identification purposes only.
This report is a service available
only to active Paid Premium Members.
You may opt-out of receiving report notifications
at any time. Questions or comments may be submitted
by writing to Premium Membership Services 665 S.E. 10 Street, Suite 201 Deerfield Beach, FL 33441-5634 or by calling 1-800-965-8307
or 954-785-1121.
|
|
|

