You are not logged in.
This means you
CAN ONLY VIEW reports that were published prior to Tuesday, April 15, 2025.
You
MUST UPGRADE YOUR MEMBERSHIP if you want to see any current reports.
AFTER MARKET UPDATE - FRIDAY, APRIL 25TH, 2014
Previous After Market Report Next After Market Report >>>
|
|
|
|
DOW |
-140.19 |
16,361.46 |
-0.85% |
|
Volume |
680,617,850 |
+5% |
|
Volume |
1,951,987,350 |
-2% |
|
NASDAQ |
-72.78 |
4,075.56 |
-1.75% |
|
Advancers |
1,022 |
32% |
|
Advancers |
448 |
16% |
|
S&P 500 |
-15.21 |
1,863.40 |
-0.81% |
|
Decliners |
2,029 |
64% |
|
Decliners |
2,300 |
81% |
|
Russell 2000 |
-21.32 |
1,123.03 |
-1.86% |
|
52 Wk Highs |
58 |
|
|
52 Wk Highs |
23 |
|
|
S&P 600 |
-10.08 |
649.73 |
-1.53% |
|
52 Wk Lows |
26 |
|
|
52 Wk Lows |
55 |
|
|
 |
Losses on Friday Led the Major Averages Lower for the Week
Kenneth J. Gruneisen - Passed the CAN SLIM® Master's Exam
Due to Friday's losses, the major averages finished lower on the week. The Dow closed with a weekly loss of -0.3%, the S&P 500 gave up less than -0.1% and the NASDAQ lost -0.5%. The volume total rose versus the prior session on the Nasdaq exchange while volume was slightly lower on the NYSE. Decliners led advancers by a 2-1 margin on the NYSE and by a 5-1 margin on the Nasdaq exchange. There were 11 high-ranked companies from the CANSLIM.net Leaders List that made new 52-week highs and appeared on the CANSLIM.net BreakOuts Page, down from the total of 34 stocks on the prior session. New 52-week highs outnumbered new 52-week lows on the NYSE while new lows outnumbered new highs on the Nasdaq exchange. Only 1 of the 4 of the high-ranked companies currently included on the Featured Stocks Page posted a gain. The setback on Friday leaves investors still waiting for more significant gains from the major indices backed by heavier volume, action which would be a meaningful improvement that more convincingly argues the Market (M criteria) is shifting back to a confirmed uptrend. Meanwhile, caution is still warranted. Keep in mind that any sustained and meaningful market advance requires leadership - a healthy crop of stocks hitting new 52-week highs.
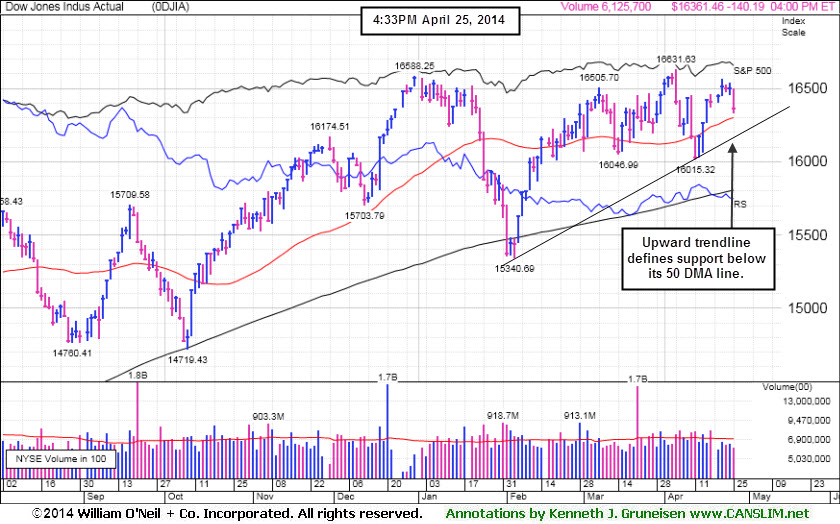
Stocks ended the week on a down note. The Dow fell 140 points to 16361. The S&P 500 lost 15 points to 1863 and the NASDAQ declined 72 points to 4,075.
Geopolitical concerns pressured equities today as Russia started military drills near the Ukrainian border following the killing of pro-Moscow rebels. Mixed economic data added to investor hesitation. A measure of consumer confidence unexpectedly jumped to a nine-month high in April while an index of business activity in the services sector dropped to the lowest level since last October.
Overall, nine of the 10 S&P 500 sectors finished in negative territory. Consumer discretionary paced the retreat. Amazon.com (AMZN -9.7%) after issuing disappointing current-quarter guidance and Ford (F -3.1%) following a weaker-than-anticipated profit tally. Losses in technology and financials also weighed on the market. Broadcom (BRCM -4.5%) and Visa (V -4.8%) after both companies posted earnings results below analyst estimates.
Treasury prices advanced for a third day. The 10-year note gained 3/32 to yield 2.67%. The 30-year bond was up 2/32 to yield 3.45%.
The CANSLIM.net Featured Stocks Page shows the most action-worthy candidates and their latest notes and a Headline Link directs members to the latest detailed analysis with data-packed graphs annotated by a Certified expert along with links to additional resources. The Premium Member Homepage includes "dynamic archives" to all prior pay reports published. Watch for an announcement via email concerning the next WEBCAST.
PICTURED: The Dow Jones Industrial Average slumped toward its 50-day moving average (DMA) line. An upward trendline defines the next important support level where further deterioration would raise serious concerns.
|
 Kenneth J. Gruneisen started out as a licensed stockbroker in August 1987, a couple of months prior to the historic stock market crash that took the Dow Jones Industrial Average down -22.6% in a single day. He has published daily fact-based fundamental and technical analysis on high-ranked stocks online for two decades. Through FACTBASEDINVESTING.COM, Kenneth provides educational articles, news, market commentary, and other information regarding proven investment systems that work in good times and bad.
Comments contained in the body of this report are technical opinions only and are not necessarily those of Gruneisen Growth Corp. The material herein has been obtained from sources believed to be reliable and accurate, however, its accuracy and completeness cannot be guaranteed. Our firm, employees, and customers may effect transactions, including transactions contrary to any recommendation herein, or have positions in the securities mentioned herein or options with respect thereto. Any recommendation contained in this report may not be suitable for all investors and it is not to be deemed an offer or solicitation on our part with respect to the purchase or sale of any securities. |
|
 |
Tech, Retail, and Financial Indexes Fell
Kenneth J. Gruneisen - Passed the CAN SLIM® Master's Exam
The tech sector saw unanimous losses from the Biotechnology Index ($BTK -3.36%), Semiconductor Index ($SOX -3.29%), and the Networking Index ($NWX -2.44%) on Friday. Weakness in the Retail Index ($RLX -2.87%) was also a negative influence on the major averages. The Integrated Oil Index ($XOI -0.28%) and the Oil Services Index ($OSX -0.20%) edged lower. The Gold & Silver Index ($XAU +1.84%) was a standout gainer.
Charts courtesy www.stockcharts.com
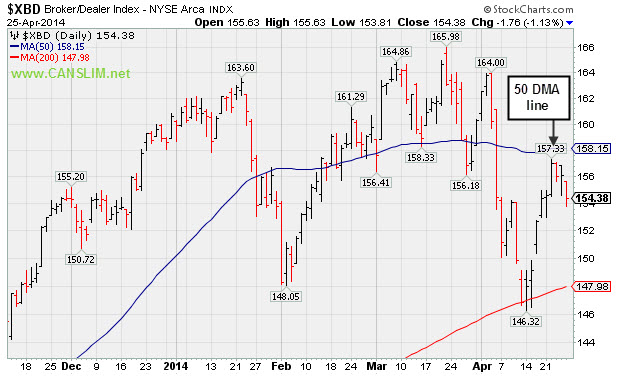
PICTURED 1: The Broker/Dealer Index ($XBD -1.13%) met resistance near its 50-day moving average (DMA) line when rebounding from support at its 200 DMA line.
Charts courtesy www.stockcharts.com
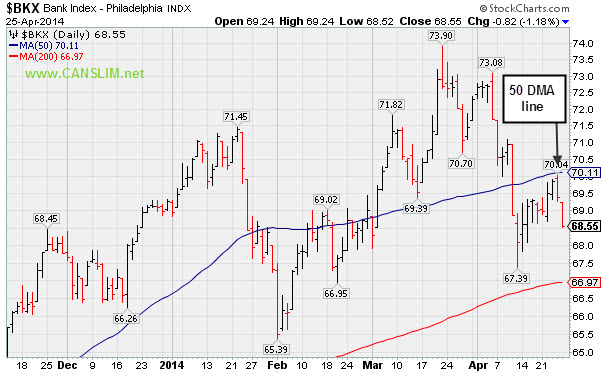
PICTURED 2: The Bank Index ($BKX -1.18%) met resistance at its 50 DMA line. Further deterioration in financial groups would not bode well as the groups are reliable leading indicators for the broader market outlook.
| Oil Services |
$OSX |
295.66 |
-0.58 |
-0.20% |
+5.21% |
| Integrated Oil |
$XOI |
1,589.97 |
-4.47 |
-0.28% |
+5.78% |
| Semiconductor |
$SOX |
572.19 |
-19.45 |
-3.29% |
+6.95% |
| Networking |
$NWX |
327.58 |
-8.19 |
-2.44% |
+1.12% |
| Broker/Dealer |
$XBD |
154.38 |
-1.76 |
-1.13% |
-3.85% |
| Retail |
$RLX |
854.86 |
-25.26 |
-2.87% |
-9.04% |
| Gold & Silver |
$XAU |
93.31 |
+1.69 |
+1.84% |
+10.89% |
| Bank |
$BKX |
68.55 |
-0.82 |
-1.18% |
-1.03% |
| Biotech |
$BTK |
2,416.53 |
-84.01 |
-3.36% |
+3.69% |
|
|
|
 |
Submit Your Request for a Featured Stock Update
Kenneth J. Gruneisen - Passed the CAN SLIM® Master's Exam
Market conditions (the M criteria) are challenging at times. There are few stocks included on the Featured Stocks list and none of the companies need additional review in detail with annotated graphs. At times like these we have an opportunity to look back and review previously featured stocks which were dropped. This can serve as an educational review of the investment system's tactics. It is also a reminder that high-ranked leaders eventually fall out of favor. If you wish to request for a specific stock to receive more detailed coverage in this section please use the inquiry form to submit your request. Thank you! |
|
|
Color Codes Explained :
Y - Better candidates highlighted by our
staff of experts.
G - Previously featured
in past reports as yellow but may no longer be buyable under the
guidelines.
***Last / Change / Volume data in this table is the closing quote data***
Symbol/Exchange
Company Name
Industry Group |
PRICE |
CHANGE
(%Change) |
Day High |
Volume
(% DAV)
(% 50 day avg vol) |
52 Wk Hi
% From Hi |
Featured
Date |
Price
Featured |
Pivot Featured |
|
Max Buy |
EQM
-
NYSE
E Q T Midstream Partners
ENERGY - Oil and Gas Pipelines
|
$75.81
|
-0.37
-0.49% |
$76.90
|
95,444
82.99% of 50 DAV
50 DAV is 115,000
|
$77.77
-2.52%
|
12/12/2013
|
$53.17
|
PP = $56.51
|
|
MB = $59.34
|
Most Recent Note - 4/24/2014 6:08:34 PM
G - Hovering at its all-time high and in strong shape, technically, despite fundamental concerns recently noted. Its 50 DMA line ($68.61) defines near-term support where a violation may trigger a technical sell signal.
>>> FEATURED STOCK ARTICLE : Technical Strength Continues Despite Fundamental Concerns - 4/9/2014
View all notes |
Set NEW NOTE alert |
CANSLIM.net Company Profile |
SEC
News |
Chart |
Request a new note
C
A N
S L
I M


|
GNRC
-
NYSE
Generac Hldgs Inc
Electrical-Power/Equipmt
|
$58.05
|
-0.98
-1.66% |
$58.91
|
573,382
81.56% of 50 DAV
50 DAV is 703,000
|
$62.50
-7.12%
|
2/14/2014
|
$56.50
|
PP = $57.39
|
|
MB = $60.26
|
Most Recent Note - 4/24/2014 6:10:00 PM
Y - Edged higher today for its 8th consecutive small gain on below average volume. Found support near its 50 DMA line and prior highs in the $57 area recently. More damaging losses below its recent low ($55.27 on 4/14/14) would raise greater concerns.
>>> FEATURED STOCK ARTICLE : Finished Just Below its 50-Day Average Line - 4/11/2014
View all notes |
Set NEW NOTE alert |
CANSLIM.net Company Profile |
SEC
News |
Chart |
Request a new note
C
A N
S L
I M
|
ICON
-
NASDAQ
Iconix Brand Group Inc
CONSUMER NON-DURABLES - Textile - Apparel Footwear
|
$38.87
|
-0.02
-0.05% |
$39.09
|
355,803
61.45% of 50 DAV
50 DAV is 579,000
|
$42.47
-8.47%
|
3/7/2014
|
$41.46
|
PP = $40.88
|
|
MB = $42.92
|
Most Recent Note - 4/24/2014 6:05:47 PM
G - Posted a gain on light volume today. A rebound above the 50 DMA line (now $39.47) is needed to help its outlook. See the latest FSU analysis for more details and new annotated graphs.
>>> FEATURED STOCK ARTICLE : Rebound Above 50-Day Average Needed to Improve Outlook - 4/24/2014
View all notes |
Set NEW NOTE alert |
CANSLIM.net Company Profile |
SEC
News |
Chart |
Request a new note
C
A N
S L
I M
|
PSIX
-
NASDAQ
Power Solutions Intl Inc
Machinery-Gen Industrial
|
$81.11
|
-0.29
-0.36% |
$81.96
|
65,093
97.15% of 50 DAV
50 DAV is 67,000
|
$87.40
-7.20%
|
2/28/2014
|
$74.65
|
PP = $76.93
|
|
MB = $80.78
|
Most Recent Note - 4/24/2014 6:07:20 PM
G- Posted a gain today with higher volume and it is perched within close striking distance of its 52-week high. The recent low ($66.03 on 4/07/14) defines important near-term support below the 50 DMA line where further deterioration would raise greater concerns.
>>> FEATURED STOCK ARTICLE : Halted Slide After Slump Below 50-Day Moving Average - 4/14/2014
View all notes |
Set NEW NOTE alert |
CANSLIM.net Company Profile |
SEC
News |
Chart |
Request a new note
C
A N
S L
I M
|
|
|
|
THESE ARE NOT BUY RECOMMENDATIONS!
Comments contained in the body of this report are technical
opinions only. The material herein has been obtained
from sources believed to be reliable and accurate, however,
its accuracy and completeness cannot be guaranteed.
This site is not an investment advisor, hence it does
not endorse or recommend any securities or other investments.
Any recommendation contained in this report may not
be suitable for all investors and it is not to be deemed
an offer or solicitation on our part with respect to
the purchase or sale of any securities. All trademarks,
service marks and trade names appearing in this report
are the property of their respective owners, and are
likewise used for identification purposes only.
This report is a service available
only to active Paid Premium Members.
You may opt-out of receiving report notifications
at any time. Questions or comments may be submitted
by writing to Premium Membership Services 665 S.E. 10 Street, Suite 201 Deerfield Beach, FL 33441-5634 or by calling 1-800-965-8307
or 954-785-1121.
|
|
|

