You are not logged in.
This means you
CAN ONLY VIEW reports that were published prior to Monday, April 14, 2025.
You
MUST UPGRADE YOUR MEMBERSHIP if you want to see any current reports.
AFTER MARKET UPDATE - WEDNESDAY, APRIL 24TH, 2013
Previous After Market Report Next After Market Report >>>
|
|
|
|
DOW |
-43.16 |
14,676.30 |
-0.29% |
|
Volume |
706,110,930 |
+3% |
|
Volume |
1,655,475,760 |
+1% |
|
NASDAQ |
+0.32 |
3,269.65 |
+0.01% |
|
Advancers |
1,971 |
63% |
|
Advancers |
1,377 |
54% |
|
S&P 500 |
+0.01 |
1,578.79 |
+0.00% |
|
Decliners |
1,017 |
32% |
|
Decliners |
1,056 |
41% |
|
Russell 2000 |
+4.75 |
934.11 |
+0.51% |
|
52 Wk Highs |
268 |
|
|
52 Wk Highs |
113 |
|
|
S&P 600 |
+3.33 |
522.89 |
+0.64% |
|
52 Wk Lows |
7 |
|
|
52 Wk Lows |
29 |
|
|
 |
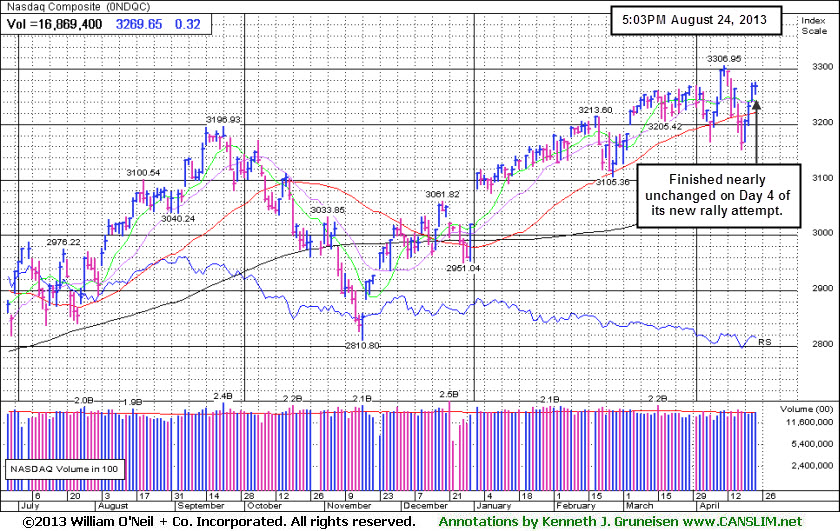
Major Averages End Mixed on Day 4 of New Rally Attempt
Kenneth J. Gruneisen - Passed the CAN SLIM® Master's Exam
The major averages finished mixed on Wednesday's session. The volume totals on the exchanges were reported slightly higher than the prior session totals on the NYSE and on the Nasdaq exchange. Breadth was positive as advancers led decliners by a 2-1 margin on the NYSE and by a 7-5 margin on the Nasdaq exchange. New 52-week highs totals and outnumbered new 52-week lows on the NYSE on the Nasdaq exchange. There were 57 high-ranked companies from the CANSLIM.net Leaders List making new 52-week highs and appearing on the CANSLIM.net BreakOuts Page, down from the prior session total of 65 stocks. There were gains for 3 of the 9 high-ranked companies currently included on the Featured Stocks Page.
Stocks traded in a narrow range throughout the session as investors responded to a disappointing report on durable goods orders and a batch of mixed corporate earnings.
Seven of the 10 sectors on the S&P ended higher led by gains in material stocks. Shares of Freeport-McMoRan Copper & Gold Inc (FCX +4.4%) rallied as gold prices advanced +1.5% to $1,429 an ounce. On the earnings front, Yum! Brands (YUM +7%) and Boeing (BA +3%) rallied after both companies topped analysts’ estimates in the quarter. On the downside, AT&T Inc (T -5%) as the company posted disappointing revenues and reported a net loss in cell phone subscribers.
Turning to fixed income markets, Treasuries were modestly higher along the curve. The benchmark 10-year note was up 1/16 of a point to yield 1.70% and the 30-year bond gained 9/32 to yield 2.89%.
The market's (M criteria) latest rally attempt is encouraging, however new buying efforts should still be avoided until there has been a follow-through day of meaningful gains (+1.4% or greater) from at least one of the major averages coupled with an expansion in leadership. That kind of bullish action is necessary to confirm that any new rally has the characteristics of institutional accumulation which have marked the beginning of most sustained market advances.
Watch for an announcement via email concerning the next WEBCAST. The webcast will also be available via an updated link highlighted at the top of the Premium Member Homepage.
PICTURED: The Nasdaq Composite Index edged higher on Day 4 of a new rally attempt, having rebounded promptly after recently undercutting its 50-day moving average (DMA) line. The window is open for a possible follow-through-day within what has historically proven as most favorable window between Day 4-7 of a new rally attempt.
|
 Kenneth J. Gruneisen started out as a licensed stockbroker in August 1987, a couple of months prior to the historic stock market crash that took the Dow Jones Industrial Average down -22.6% in a single day. He has published daily fact-based fundamental and technical analysis on high-ranked stocks online for two decades. Through FACTBASEDINVESTING.COM, Kenneth provides educational articles, news, market commentary, and other information regarding proven investment systems that work in good times and bad.
Comments contained in the body of this report are technical opinions only and are not necessarily those of Gruneisen Growth Corp. The material herein has been obtained from sources believed to be reliable and accurate, however, its accuracy and completeness cannot be guaranteed. Our firm, employees, and customers may effect transactions, including transactions contrary to any recommendation herein, or have positions in the securities mentioned herein or options with respect thereto. Any recommendation contained in this report may not be suitable for all investors and it is not to be deemed an offer or solicitation on our part with respect to the purchase or sale of any securities. |
|
 |
Commodity-Linked Groups Led Gainers
Kenneth J. Gruneisen - Passed the CAN SLIM® Master's Exam
The Semiconductor Index ($SOX +1.26%) led the tech sector while the Internet Index ($IIX +0.25%) edged higher, but the Biotechnology Index ($BTK -2.26%) and the Networking Index ($NWX -1.17%) lost ground. The Retail Index ($RLX -0.03%) finished flat while strength in the financial sector helped the major averages as the Broker/Dealer Index ($XBD +0.46%) and the Bank Index ($BKX +1.15%) tallied gains. Energy-related shares had a positive bias as the Integrated Oil Index ($XOI +1.60%) and the Oil Services Index ($OSX +2.21%) rose.
Charts courtesy www.stockcharts.com
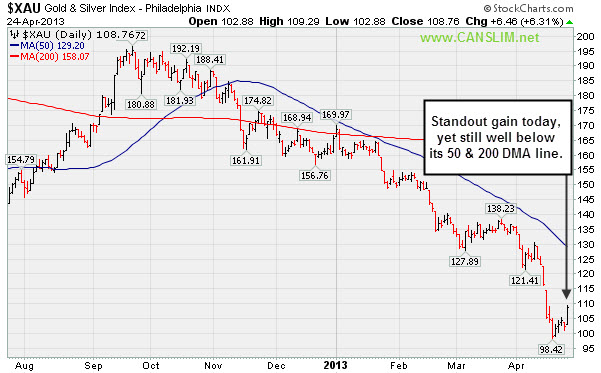
PICTURED: The Gold & Silver Index ($XAU +6.31%) was a standout gainer, yet it is still well below its 50-day moving average (DMA) and 200 DMA lines.
| Oil Services |
$OSX |
247.03 |
+5.34 |
+2.21% |
+12.20% |
| Healthcare |
$HMO |
2,911.16 |
+29.13 |
+1.01% |
+15.79% |
| Integrated Oil |
$XOI |
1,336.42 |
+21.00 |
+1.60% |
+7.62% |
| Semiconductor |
$SOX |
435.65 |
+5.44 |
+1.26% |
+13.43% |
| Networking |
$NWX |
216.38 |
-2.55 |
-1.17% |
-4.49% |
| Internet |
$IIX |
360.30 |
+0.90 |
+0.25% |
+10.18% |
| Broker/Dealer |
$XBD |
111.15 |
+0.50 |
+0.46% |
+17.83% |
| Retail |
$RLX |
745.35 |
-0.20 |
-0.03% |
+14.13% |
| Gold & Silver |
$XAU |
108.76 |
+6.46 |
+6.31% |
-34.32% |
| Bank |
$BKX |
56.44 |
+0.64 |
+1.15% |
+10.06% |
| Biotech |
$BTK |
1,889.82 |
-43.78 |
-2.26% |
+22.16% |
|
|
|
 |
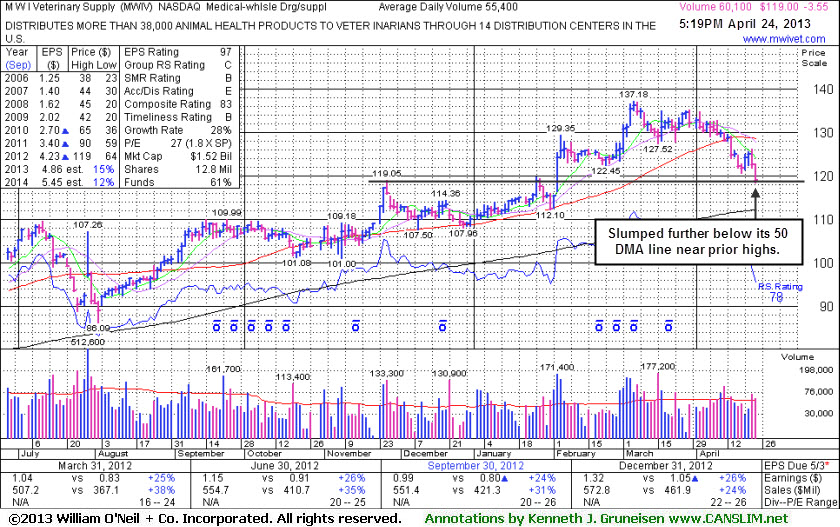
Prior Highs Define Support After Slumping Under 50-Day Average
Kenneth J. Gruneisen - Passed the CAN SLIM® Master's Exam
M W I Veterinary Supply (MWIV -$3.55 or -2.90% to $119.00) is trading near its November highs which define an important support level after slumping further below its 50-day moving average (DMA) line. Its Relative Strength rating has slumped to 78, below the 80+ minimum guideline for buy candidates. Its last appearance in this FSU section with an annotated graph was on 4/04/13 under the headline, "Consolidating Above 50-Day Moving Average and Above Pivot Point". Its 50-day moving average (DMA) line violation on 4/15/13 raised concerns and triggered a technical sell signal. Disciplined investors limit losses by always selling if ever any stock fall more than -7% from their purchase price.
The high-ranked Medical - Wholesale Drug/Supplies firm reported earnings +26% on +24% sales revenues for the quarter ended December 31, 2012 versus the year ago period, continuing its trend of recent quarterly earnings increases near the +25% minimum guideline (C criteria). Decelerating sales revenues increases in sequential quarterly comparisons through Dec '12 is a slight cause for concern while waiting and watching for the next quarterly report for the period ended March 31, 2013 versus the year ago period. Revenues rose by +38%, +35%, +31% and +24% in the Mar, Jun, Sep, and Dec '12 quarterly comparisons, respectively, versus the year ago periods. It is preferred when stocks show acceleration, rather than deceleration in their growth rates.
Its solid annual earnings history satisfies the A criteria. Its small supply (S criteria) of only 12.8 million shares outstanding could contribute to greater volatility in the event of institutional buying or selling. The number of top-rated funds owning its shares rose from 266 in Mar '12 to 301 in Mar '13, a very reassuring sign of interest coming from the institutional (I criteria) crowd.
|
|
|
Color Codes Explained :
Y - Better candidates highlighted by our
staff of experts.
G - Previously featured
in past reports as yellow but may no longer be buyable under the
guidelines.
***Last / Change / Volume data in this table is the closing quote data***
Symbol/Exchange
Company Name
Industry Group |
PRICE |
CHANGE
(%Change) |
Day High |
Volume
(% DAV)
(% 50 day avg vol) |
52 Wk Hi
% From Hi |
Featured
Date |
Price
Featured |
Pivot Featured |
|
Max Buy |
CELG
-
NASDAQ
Celgene Corp
DRUGS - Drug Manufacturers - Major
|
$118.28
|
-7.72
-6.13% |
$124.69
|
6,803,561
220.35% of 50 DAV
50 DAV is 3,087,600
|
$128.52
-7.97%
|
3/27/2013
|
$113.24
|
PP = $115.54
|
|
MB = $121.32
|
 Most Recent Note - 4/24/2013 11:59:59 AM
G - Gapped down today, retreating from a new all-time high hit on the prior session before reversing into the red. It is extended from any sound base. Its 50 DMA line ($111.45 now) defines important near-term support to watch.
>>> The latest Featured Stock Update with an annotated graph appeared on 4/19/2013. Click here.
View all notes |
Alert me of new notes |
CANSLIM.net Company Profile |
SEC |
Zacks Reports |
StockTalk |
News |
Chart |
Request a new note
C
A N
S L
I M


|
CMCSA
-
NASDAQ
Comcast Corp Cl A
MEDIA - CATV Systems
|
$40.67
|
-0.23
-0.56% |
$41.28
|
11,451,469
80.51% of 50 DAV
50 DAV is 14,223,600
|
$42.61
-4.55%
|
12/3/2012
|
$37.08
|
PP = $38.06
|
|
MB = $39.96
|
Most Recent Note - 4/19/2013 12:11:14 PM
G - Rebounding toward its 50 DMA line today after violating that important short-term average with 2 prior losses marked by above average volume. A prompt rebound above its 50 DMA line is needed for its outlook to improve.
>>> The latest Featured Stock Update with an annotated graph appeared on 4/16/2013. Click here.
View all notes |
Alert me of new notes |
CANSLIM.net Company Profile |
SEC |
Zacks Reports |
StockTalk |
News |
Chart |
Request a new note
C
A N
S L
I M
|
FLT
-
NYSE
Fleetcor Technologies
DIVERSIFIED SERVICES - Business/Management Services
|
$75.93
|
-1.29
-1.67% |
$77.60
|
571,776
72.20% of 50 DAV
50 DAV is 791,900
|
$78.87
-3.73%
|
3/21/2013
|
$71.14
|
PP = $73.00
|
|
MB = $76.65
|
Most Recent Note - 4/19/2013 12:17:32 PM
Y - Managed a "positive reversal" after early weakness today, making a stand near its 50 DMA line ($71.67 now). More damaging losses would raise more serious concerns and trigger a worrisome technical sell signal.
>>> The latest Featured Stock Update with an annotated graph appeared on 4/15/2013. Click here.
View all notes |
Alert me of new notes |
CANSLIM.net Company Profile |
SEC |
Zacks Reports |
StockTalk |
News |
Chart |
Request a new note
C
A N
S L
I M
|
LNKD
-
NYSE
Linkedin Corp Class A
INTERNET - Internet Information Providers
|
$187.66
|
+1.55
0.83% |
$188.52
|
1,862,847
81.95% of 50 DAV
50 DAV is 2,273,200
|
$187.13
0.28%
|
4/12/2013
|
$182.69
|
PP = $184.25
|
|
MB = $193.46
|
Most Recent Note - 4/23/2013 9:03:56 PM
Y - Rallied with near average volume for a 3rd consecutive gain today and hit a new 52-week high. Volume-driven gains above the pivot point may clinch a proper new (or add-on) technical buy signal. Its 50 DMA line and recent low define important near-term chart support to watch.
>>> The latest Featured Stock Update with an annotated graph appeared on 4/5/2013. Click here.
View all notes |
Alert me of new notes |
CANSLIM.net Company Profile |
SEC |
Zacks Reports |
StockTalk |
News |
Chart |
Request a new note
C
A N
S L
I M
|
MRLN
-
NASDAQ
Marlin Business Services
DIVERSIFIED SERVICES - Rental and Leasing Services
|
$23.68
|
+0.07
0.30% |
$24.00
|
9,327
35.74% of 50 DAV
50 DAV is 26,100
|
$23.98
-1.25%
|
3/15/2013
|
$22.29
|
PP = $23.18
|
|
MB = $24.34
|
Most Recent Note - 4/23/2013 9:01:29 PM
Y - Rallied for a new high close today but with light volume behind the gain, not volume indicative of institutional buying demand. Perched within close striking distance of its 52-week high and little resistance remains.
>>> The latest Featured Stock Update with an annotated graph appeared on 4/9/2013. Click here.
View all notes |
Alert me of new notes |
CANSLIM.net Company Profile |
SEC |
Zacks Reports |
StockTalk |
News |
Chart |
Request a new note
C
A N
S L
I M
|
Symbol/Exchange
Company Name
Industry Group |
PRICE |
CHANGE
(%Change) |
Day High |
Volume
(% DAV)
(% 50 day avg vol) |
52 Wk Hi
% From Hi |
Featured
Date |
Price
Featured |
Pivot Featured |
|
Max Buy |
MWIV
-
NASDAQ
M W I Veterinary Supply
HEALTH SERVICES - Medical Instruments and; Supplies
|
$119.00
|
-3.55
-2.90% |
$122.84
|
60,527
109.25% of 50 DAV
50 DAV is 55,400
|
$137.18
-13.25%
|
3/4/2013
|
$130.90
|
PP = $129.45
|
|
MB = $135.92
|
Most Recent Note - 4/24/2013 5:40:57 PM
G - Slumped near November highs defining near-term support while slumping further below its 50 DMA line. See the latest FSU analysis for more details and a new annotated graph.
>>> The latest Featured Stock Update with an annotated graph appeared on 4/24/2013. Click here.
View all notes |
Alert me of new notes |
CANSLIM.net Company Profile |
SEC |
Zacks Reports |
StockTalk |
News |
Chart |
Request a new note
C
A N
S L
I M
|
N
-
NYSE
Netsuite Inc
DIVERSIFIED SERVICES - Business/Management Services
|
$80.11
|
+0.31
0.39% |
$80.32
|
297,433
84.35% of 50 DAV
50 DAV is 352,600
|
$80.33
-0.27%
|
12/12/2012
|
$64.75
|
PP = $67.12
|
|
MB = $70.48
|
Most Recent Note - 4/24/2013 1:03:03 PM
G - Still hovering near its all-time high in a tight trading range. Its 50 DMA line ($74.74 now) defines important near-term support to watch. Fundamental concerns were recently noted. Results for the first quarter 2013 will be released after the market close on Thursday, April 25, 2013.
>>> The latest Featured Stock Update with an annotated graph appeared on 4/22/2013. Click here.
View all notes |
Alert me of new notes |
CANSLIM.net Company Profile |
SEC |
Zacks Reports |
StockTalk |
News |
Chart |
Request a new note
C
A N
S L
I M
|
RRTS
-
NYSE
Roadrunner Trans Systems
TRANSPORTATION - Air Delivery and Freight Service
|
$22.38
|
-0.05
-0.22% |
$22.50
|
133,178
71.33% of 50 DAV
50 DAV is 186,700
|
$23.88
-6.28%
|
4/3/2013
|
$22.77
|
PP = $23.75
|
|
MB = $24.94
|
Most Recent Note - 4/23/2013 8:58:25 PM
G - Still sputtering below its 50 DMA line after failing to trigger a new buy signal since featured on 4/03/13. A rebound above that important short-term average would help its outlook improve. See the latest FSU analysis for more details and a new annotated graph.
>>> The latest Featured Stock Update with an annotated graph appeared on 4/23/2013. Click here.
View all notes |
Alert me of new notes |
CANSLIM.net Company Profile |
SEC |
Zacks Reports |
StockTalk |
News |
Chart |
Request a new note
C
A N
S L
I M
|
VRX
-
NYSE
Valeant Pharmaceuticals
DRUGS - Drug Manufacturers - Other
|
$74.82
|
-0.16
-0.21% |
$75.57
|
941,558
69.52% of 50 DAV
50 DAV is 1,354,400
|
$76.56
-2.27%
|
12/20/2012
|
$60.24
|
PP = $61.21
|
|
MB = $64.27
|
Most Recent Note - 4/19/2013 1:18:34 PM
G - Finding recent support well above its 50 DMA line defining important near-term support.
>>> The latest Featured Stock Update with an annotated graph appeared on 4/8/2013. Click here.
View all notes |
Alert me of new notes |
CANSLIM.net Company Profile |
SEC |
Zacks Reports |
StockTalk |
News |
Chart |
Request a new note
C
A N
S L
I M
|
|
|
|
THESE ARE NOT BUY RECOMMENDATIONS!
Comments contained in the body of this report are technical
opinions only. The material herein has been obtained
from sources believed to be reliable and accurate, however,
its accuracy and completeness cannot be guaranteed.
This site is not an investment advisor, hence it does
not endorse or recommend any securities or other investments.
Any recommendation contained in this report may not
be suitable for all investors and it is not to be deemed
an offer or solicitation on our part with respect to
the purchase or sale of any securities. All trademarks,
service marks and trade names appearing in this report
are the property of their respective owners, and are
likewise used for identification purposes only.
This report is a service available
only to active Paid Premium Members.
You may opt-out of receiving report notifications
at any time. Questions or comments may be submitted
by writing to Premium Membership Services 665 S.E. 10 Street, Suite 201 Deerfield Beach, FL 33441-5634 or by calling 1-800-965-8307
or 954-785-1121.
|
|
|

