***Last / Change / Volume data in this table is the closing quote data***
Symbol/Exchange
Company Name
Industry Group |
PRICE |
CHANGE
(%Change) |
Day High |
Volume
(% DAV)
(% 50 day avg vol) |
52 Wk Hi
% From Hi |
Featured
Date |
Price
Featured |
Pivot Featured |
|
Max Buy |
ACN
-
NYSE
Accenture Plc
DIVERSIFIED SERVICES - Business/Management Services
|
$63.03
|
-0.37
-0.58% |
$63.16
|
2,992,660
91.68% of 50 DAV
50 DAV is 3,264,200
|
$65.89
-4.34%
|
3/23/2012
|
$64.13
|
PP = $63.76
|
|
MB = $66.95
|
 Most Recent Note - 4/23/2012 11:51:09 AM
Y - Gapped down today amid widespread market weakness. Slumping back below its pivot point near prior highs in the $62-63 area and its 50 DMA line defining important near-term support.
>>> The latest Featured Stock Update with an annotated graph appeared on 3/23/2012. Click here.
View all notes |
Alert me of new notes |
CANSLIM.net Company Profile |
SEC |
Zacks Reports |
StockTalk |
News |
Chart |
Request a new note
C
A N
S L
I M


|
ADS
-
NYSE
Alliance Data Sys Corp
COMPUTER SOFTWARE and SERVICES - Information and Delivery Service
|
$128.00
|
-0.40
-0.31% |
$128.03
|
708,796
115.53% of 50 DAV
50 DAV is 613,500
|
$130.31
-1.77%
|
1/17/2012
|
$108.24
|
PP = $107.43
|
|
MB = $112.80
|
Most Recent Note - 4/19/2012 11:43:03 AM
G - No resistance remains due to overhead supply and it hit another new all-time high today. Reported earnings +17% on +20% sales revenues for the quarter ended March 31, 2012 versus the year-ago period. Fundamental concerns were raised earlier by earnings reported +9%, well below the +25% minimum guideline, for the latest quarter ended December 31, 2011 versus the year-ago period.
>>> The latest Featured Stock Update with an annotated graph appeared on 2/29/2012. Click here.
View all notes |
Alert me of new notes |
CANSLIM.net Company Profile |
SEC |
Zacks Reports |
StockTalk |
News |
Chart |
Request a new note
C
A N
S L
I M
|
ALLT
-
NASDAQ
Allot Communications Ltd
COMPUTER SOFTWARE andamp; SERVICES - Technical andamp; System Software
|
$23.45
|
-0.21
-0.89% |
$23.92
|
314,494
68.56% of 50 DAV
50 DAV is 458,700
|
$25.36
-7.53%
|
3/13/2012
|
$19.72
|
PP = $18.91
|
|
MB = $19.86
|
Most Recent Note - 4/23/2012 11:31:47 AM
G - Down today amid widespread market weakness. There was a "negative reversal" on 4/19/12 after touching a new all-time high. Volume totals have been cooling while stubbornly holding its ground, a sign that few are exiting, while it remains perched near its 52-week high. Its latest consolidation has been brief, yet it may be forming an advanced "3-weeks tight" base well above its 50 DMA line and prior highs near $18-19 that define support to watch on pullbacks.
>>> The latest Featured Stock Update with an annotated graph appeared on 3/19/2012. Click here.
View all notes |
Alert me of new notes |
CANSLIM.net Company Profile |
SEC |
Zacks Reports |
StockTalk |
News |
Chart |
Request a new note
C
A N
S L
I M
|
ALXN
-
NASDAQ
Alexion Pharmaceuticals
DRUGS - Drug Manufacturers - Other
|
$91.94
|
+0.18
0.20% |
$91.94
|
1,215,657
96.06% of 50 DAV
50 DAV is 1,265,500
|
$95.01
-3.23%
|
3/12/2012
|
$87.87
|
PP = $87.73
|
|
MB = $92.12
|
Most Recent Note - 4/23/2012 11:53:42 AM
G - Small gap down today amid widespread market weakness. Recently found support at its 50 DMA line, and it is now consolidating above that important short-term average.
>>> The latest Featured Stock Update with an annotated graph appeared on 4/16/2012. Click here.
View all notes |
Alert me of new notes |
CANSLIM.net Company Profile |
SEC |
Zacks Reports |
StockTalk |
News |
Chart |
Request a new note
C
A N
S L
I M
|
BODY
-
NASDAQ
Body Central Corp
RETAIL - Catalog andamp; Mail Order Houses
|
$27.46
|
-0.28
-1.01% |
$27.51
|
129,344
66.26% of 50 DAV
50 DAV is 195,200
|
$29.49
-6.88%
|
4/18/2012
|
$27.44
|
PP = $29.59
|
|
MB = $31.07
|
Most Recent Note - 4/18/2012 1:41:04 PM
Y - Hovering near its 50 DMA line today, finding support near that important short-term average. Color code is changed to yellow with new pivot point cited based on its 52-week high plus 10 cents. Volume-driven gains above the pivot point may trigger a new (or add-on) technical buy signal. Subsequent damaging losses below its recent lows would raise more serious concerns and trigger additional sell signals.
>>> The latest Featured Stock Update with an annotated graph appeared on 3/13/2012. Click here.
View all notes |
Alert me of new notes |
CANSLIM.net Company Profile |
SEC |
Zacks Reports |
StockTalk |
News |
Chart |
Request a new note
C
A N
S L
I M
|
Symbol/Exchange
Company Name
Industry Group |
PRICE |
CHANGE
(%Change) |
Day High |
Volume
(% DAV)
(% 50 day avg vol) |
52 Wk Hi
% From Hi |
Featured
Date |
Price
Featured |
Pivot Featured |
|
Max Buy |
CDNS
-
NASDAQ
Cadence Design Systems
COMPUTER SOFTWARE and SERVICES - Technical and System Software
|
$11.35
|
-0.17
-1.48% |
$11.40
|
3,626,774
128.18% of 50 DAV
50 DAV is 2,829,400
|
$12.60
-9.92%
|
2/3/2012
|
$11.66
|
PP = $11.15
|
|
MB = $11.71
|
Most Recent Note - 4/18/2012 1:42:38 PM
G - Still lingering below its 50 DMA line which may now act as resistance. Last week's low ($11.20 on 4/10/12) defines important near-term support level above its 200 DMA line.
>>> The latest Featured Stock Update with an annotated graph appeared on 3/28/2012. Click here.
View all notes |
Alert me of new notes |
CANSLIM.net Company Profile |
SEC |
Zacks Reports |
StockTalk |
News |
Chart |
Request a new note
C
A N
S L
I M
|
CELG
-
NASDAQ
Celgene Corp
DRUGS - Drug Manufacturers - Major
|
$77.43
|
-1.67
-2.11% |
$78.71
|
2,891,859
106.82% of 50 DAV
50 DAV is 2,707,200
|
$80.42
-3.72%
|
2/2/2012
|
$74.16
|
PP = $75.21
|
|
MB = $78.97
|
Most Recent Note - 4/18/2012 1:45:31 PM
G - Volume totals have been cooling while still stubbornly holding its ground and dipping below its "max buy" level briefly during the past week. Its 50 DMA line defines important support to watch.
>>> The latest Featured Stock Update with an annotated graph appeared on 3/26/2012. Click here.
View all notes |
Alert me of new notes |
CANSLIM.net Company Profile |
SEC |
Zacks Reports |
StockTalk |
News |
Chart |
Request a new note
C
A N
S L
I M
|
COO
-
NYSE
Cooper Companies Inc
HEALTH SERVICES - Medical Instruments and Supplies
|
$85.28
|
-0.20
-0.23% |
$85.47
|
380,789
88.87% of 50 DAV
50 DAV is 428,500
|
$87.18
-2.18%
|
3/9/2012
|
$83.05
|
PP = $81.02
|
|
MB = $85.07
|
Most Recent Note - 4/18/2012 1:51:04 PM
Y - Inching higher today with below average volume, trading at its 52-week high and near its "max buy" level. Wedging higher with no resistance remaining, but not showing signs of institutional accumulation since its big 4/05/12 gain on high volume. Its Relative Strength rating has improved to 84 now, better than the 80+ guideline for buy candidates.
>>> The latest Featured Stock Update with an annotated graph appeared on 3/9/2012. Click here.
View all notes |
Alert me of new notes |
CANSLIM.net Company Profile |
SEC |
Zacks Reports |
StockTalk |
News |
Chart |
Request a new note
C
A N
S L
I M
|
DISH
-
NASDAQ
Dish Network Corp Cl A
CONSUMER DURABLES - Electronic Equipment
|
$31.12
|
-0.53
-1.67% |
$31.41
|
1,284,538
49.45% of 50 DAV
50 DAV is 2,597,600
|
$35.64
-12.68%
|
3/7/2012
|
$30.83
|
PP = $30.10
|
|
MB = $31.61
|
Most Recent Note - 4/18/2012 1:27:09 PM
G - Violated its 50 DMA line and slumping near its pivot point with a damaging loss today on above average volume raising concerns. A prompt show of support near that important short-term average would help its outlook, but a weak finish and further deterioration would raise more serious concerns.
>>> The latest Featured Stock Update with an annotated graph appeared on 3/14/2012. Click here.
View all notes |
Alert me of new notes |
CANSLIM.net Company Profile |
SEC |
Zacks Reports |
StockTalk |
News |
Chart |
Request a new note
C
A N
S L
I M
|
FEIC
-
NASDAQ
F E I Co
ELECTRONICS - Diversified Electronics
|
$46.23
|
-0.84
-1.78% |
$46.67
|
359,832
115.33% of 50 DAV
50 DAV is 312,000
|
$49.92
-7.39%
|
12/7/2011
|
$41.41
|
PP = $42.35
|
|
MB = $44.47
|
Most Recent Note - 4/18/2012 2:04:49 PM
G - Volume totals have been cooling while consolidating above its 50 DMA line. The latest quarterly report showed +21% earnings for the Dec '11 quarter, below the +25% minimum guideline for earnings growth.
>>> The latest Featured Stock Update with an annotated graph appeared on 3/12/2012. Click here.
View all notes |
Alert me of new notes |
CANSLIM.net Company Profile |
SEC |
Zacks Reports |
StockTalk |
News |
Chart |
Request a new note
C
A N
S L
I M
|
Symbol/Exchange
Company Name
Industry Group |
PRICE |
CHANGE
(%Change) |
Day High |
Volume
(% DAV)
(% 50 day avg vol) |
52 Wk Hi
% From Hi |
Featured
Date |
Price
Featured |
Pivot Featured |
|
Max Buy |
GNC
-
NYSE
G N C Holdings Inc
RETAIL - Drug Stores
|
$36.15
|
+0.50
1.40% |
$36.30
|
2,336,540
142.19% of 50 DAV
50 DAV is 1,643,200
|
$36.10
0.14%
|
1/19/2012
|
$28.99
|
PP = $29.60
|
|
MB = $31.08
|
Most Recent Note - 4/23/2012 12:25:26 PM
G - Inching higher for a 5th consecutive small gain today and now trading just pennies below its all-time high. It has shown bullish action in recent weeks but did not form a sound new base pattern. It completed Secondary Offerings on 10/25/11 and 3/13/12 after making steady progress following its 4/01/11 IPO.
>>> The latest Featured Stock Update with an annotated graph appeared on 3/5/2012. Click here.
View all notes |
Alert me of new notes |
CANSLIM.net Company Profile |
SEC |
Zacks Reports |
StockTalk |
News |
Chart |
Request a new note
C
A N
S L
I M
|
HLF
-
NYSE
Herbalife Ltd
DRUGS - Nutrition and Weight Management
|
$72.69
|
+0.37
0.51% |
$73.00
|
1,698,958
123.67% of 50 DAV
50 DAV is 1,373,800
|
$72.68
0.01%
|
4/18/2012
|
$71.19
|
PP = $72.21
|
|
MB = $75.82
|
Most Recent Note - 4/18/2012 2:03:02 PM
Y - Color code is changed to yellow with new pivot point cited based on its 52-week high plus 10 cents after forming an orderly flat base of sufficient length. Volume-driven gains for new highs may trigger a new (or add-on) technical buy signal. Consolidating above its 50 DMA line, important support to watch.
>>> The latest Featured Stock Update with an annotated graph appeared on 4/13/2012. Click here.
View all notes |
Alert me of new notes |
CANSLIM.net Company Profile |
SEC |
Zacks Reports |
StockTalk |
News |
Chart |
Request a new note
C
A N
S L
I M
|
ISRG
-
NASDAQ
Intuitive Surgical Inc
HEALTH SERVICES - Medical Appliances and Equipment
|
$567.44
|
-9.13
-1.58% |
$570.59
|
341,664
115.78% of 50 DAV
50 DAV is 295,100
|
$594.89
-4.61%
|
12/20/2011
|
$442.43
|
PP = $449.16
|
|
MB = $471.62
|
Most Recent Note - 4/20/2012 12:13:37 PM
G - Holding its ground following a considerable gap up gain on 4/18/12. It may produce more climactic gains, however it has not spent much time basing since its last "Featured Date" when highlighted in yellow on 12/23/11. Disciplined investors always limit losses if any stock falls -7% from their purchase price. It is on track for a 10th consecutive weekly gain.
>>> The latest Featured Stock Update with an annotated graph appeared on 3/1/2012. Click here.
View all notes |
Alert me of new notes |
CANSLIM.net Company Profile |
SEC |
Zacks Reports |
StockTalk |
News |
Chart |
Request a new note
C
A N
S L
I M
|
LULU
-
NASDAQ
Lululemon Athletica
MANUFACTURING - Textile Manufacturing
|
$73.82
|
+0.12
0.16% |
$73.91
|
1,553,086
78.90% of 50 DAV
50 DAV is 1,968,300
|
$77.13
-4.29%
|
1/10/2012
|
$60.97
|
PP = $59.46
|
|
MB = $62.43
|
Most Recent Note - 4/23/2012 11:47:11 AM
G - Gapped down today, slumping near its 50 DMA line and recent lows which define important near-term support to watch.
>>> The latest Featured Stock Update with an annotated graph appeared on 4/12/2012. Click here.
View all notes |
Alert me of new notes |
CANSLIM.net Company Profile |
SEC |
Zacks Reports |
StockTalk |
News |
Chart |
Request a new note
C
A N
S L
I M
|
MA
-
NYSE
Mastercard Inc Cl A
DIVERSIFIED SERVICES - Business/Management Services
|
$430.26
|
-10.18
-2.31% |
$437.43
|
1,235,124
151.94% of 50 DAV
50 DAV is 812,900
|
$443.80
-3.05%
|
3/12/2012
|
$419.86
|
PP = $428.67
|
|
MB = $450.10
|
Most Recent Note - 4/23/2012 12:32:01 PM
Y - Considerable loss today, and at its earlier low it tested its 50 DMA line which defines important near-term support to watch.
>>> The latest Featured Stock Update with an annotated graph appeared on 4/11/2012. Click here.
View all notes |
Alert me of new notes |
CANSLIM.net Company Profile |
SEC |
Zacks Reports |
StockTalk |
News |
Chart |
Request a new note
C
A N
S L
I M
|
Symbol/Exchange
Company Name
Industry Group |
PRICE |
CHANGE
(%Change) |
Day High |
Volume
(% DAV)
(% 50 day avg vol) |
52 Wk Hi
% From Hi |
Featured
Date |
Price
Featured |
Pivot Featured |
|
Max Buy |
MELI
-
NASDAQ
Mercadolibre Inc
INTERNET - Internet Software and; Services
|
$88.62
|
-1.86
-2.06% |
$89.34
|
575,699
118.26% of 50 DAV
50 DAV is 486,800
|
$104.50
-15.20%
|
2/6/2012
|
$97.09
|
PP = $95.58
|
|
MB = $100.36
|
Most Recent Note - 4/23/2012 11:28:47 AM
G - Down today, slumping further below its 50 DMA line follow 3 consecutive weekly losses. It now faces resistance due to overhead supply up through the $104 level that will hinder its progress.
>>> The latest Featured Stock Update with an annotated graph appeared on 3/29/2012. Click here.
View all notes |
Alert me of new notes |
CANSLIM.net Company Profile |
SEC |
Zacks Reports |
StockTalk |
News |
Chart |
Request a new note
C
A N
S L
I M
|
MG
-
NYSE
Mistras Group Inc
DIVERSIFIED SERVICES - Bulding and Faci;ity Management Services
|
$23.18
|
-0.50
-2.11% |
$23.49
|
52,127
50.41% of 50 DAV
50 DAV is 103,400
|
$26.24
-11.66%
|
3/22/2012
|
$24.96
|
PP = $26.34
|
|
MB = $27.66
|
Most Recent Note - 4/20/2012 1:38:13 PM
G - Gain today has it rebounding above its 50 DMA line. A volume-driven gain above its recent chart high ($25.49 on 3/21/12) may help trigger a proper technical buy signal after a new base formation, however no new (lower) pivot point is currently being cited, and it may continue encountering stubborn resistance.
>>> The latest Featured Stock Update with an annotated graph appeared on 4/2/2012. Click here.
View all notes |
Alert me of new notes |
CANSLIM.net Company Profile |
SEC |
Zacks Reports |
StockTalk |
News |
Chart |
Request a new note
C
A N
S L
I M
|
MKTX
-
NASDAQ
Marketaxess Holdings Inc
FINANCIAL SERVICES - Investment Brokerage - Nationa
|
$35.75
|
-0.66
-1.81% |
$35.86
|
216,926
69.48% of 50 DAV
50 DAV is 312,200
|
$37.95
-5.80%
|
3/8/2012
|
$35.80
|
PP = $35.52
|
|
MB = $37.30
|
Most Recent Note - 4/20/2012 1:40:58 PM
Y - Color code was changed to yellow based on its impressive resilience. Volume totals have been cooling since it rebounded above its 50 DMA line after a brief intra-day violation on 4/12/12.
>>> The latest Featured Stock Update with an annotated graph appeared on 3/8/2012. Click here.
View all notes |
Alert me of new notes |
CANSLIM.net Company Profile |
SEC |
Zacks Reports |
StockTalk |
News |
Chart |
Request a new note
C
A N
S L
I M
|
NTES
-
NASDAQ
Netease Inc Adr
INTERNET - Internet Information Providers
|
$58.66
|
+0.12
0.20% |
$59.43
|
733,035
105.31% of 50 DAV
50 DAV is 696,100
|
$60.50
-3.04%
|
3/19/2012
|
$56.18
|
PP = $55.10
|
|
MB = $57.86
|
Most Recent Note - 4/23/2012 2:53:14 PM
G - Consolidating just above its "max buy" level and its color code is changed to green. Recent lows and prior highs in the $55 area define important near-term chart support to watch above its 50 DMA line.
>>> The latest Featured Stock Update with an annotated graph appeared on 3/27/2012. Click here.
View all notes |
Alert me of new notes |
CANSLIM.net Company Profile |
SEC |
Zacks Reports |
StockTalk |
News |
Chart |
Request a new note
C
A N
S L
I M
|
RAX
-
NYSE
Rackspace Hosting Inc
INTERNET - Internet Software and; Services
|
$55.04
|
-1.17
-2.08% |
$55.40
|
2,306,853
117.55% of 50 DAV
50 DAV is 1,962,400
|
$60.00
-8.27%
|
2/2/2012
|
$46.69
|
PP = $45.55
|
|
MB = $47.83
|
Most Recent Note - 4/23/2012 11:23:16 AM
G - Gapped down today, violating its 50 DMA line and triggering a technical sell signal. Touched a new all-time high on 4/19/12, but ended the session with a negative reversal. Only a prompt rebound above that short-term average would help its outlook
>>> The latest Featured Stock Update with an annotated graph appeared on 4/10/2012. Click here.
View all notes |
Alert me of new notes |
CANSLIM.net Company Profile |
SEC |
Zacks Reports |
StockTalk |
News |
Chart |
Request a new note
C
A N
S L
I M
|
Symbol/Exchange
Company Name
Industry Group |
PRICE |
CHANGE
(%Change) |
Day High |
Volume
(% DAV)
(% 50 day avg vol) |
52 Wk Hi
% From Hi |
Featured
Date |
Price
Featured |
Pivot Featured |
|
Max Buy |
RGR
-
NYSE
Sturm Ruger & Co Inc
CONSUMER DURABLES - Sporting Goods
|
$53.43
|
-0.01
-0.02% |
$53.75
|
671,644
174.14% of 50 DAV
50 DAV is 385,700
|
$53.51
-0.15%
|
3/22/2012
|
$46.49
|
PP = $46.78
|
|
MB = $49.12
|
Most Recent Note - 4/23/2012 12:47:12 PM
G - Holding its ground at its 52-week high today following 4 consecutive gains. It is extended from any sound base. Found prompt support after a pullback near its prior high in the $46 area previously noted as support to watch above its 50 DMA line.
>>> The latest Featured Stock Update with an annotated graph appeared on 3/22/2012. Click here.
View all notes |
Alert me of new notes |
CANSLIM.net Company Profile |
SEC |
Zacks Reports |
StockTalk |
News |
Chart |
Request a new note
C
A N
S L
I M
|
RRTS
-
NYSE
Roadrunner Trans Systems
TRANSPORTATION - Air Delivery and Freight Service
|
$17.14
|
-0.18
-1.04% |
$17.31
|
78,480
70.01% of 50 DAV
50 DAV is 112,100
|
$18.59
-7.80%
|
2/10/2012
|
$17.40
|
PP = $17.50
|
|
MB = $18.38
|
Most Recent Note - 4/20/2012 11:13:38 AM
G - Gapped up today, trading near its 50 DMA line which may now act as resistance. After finding recent support, any subsequent deterioration below the prior low ($16.65 on 4/10/12) would raise more serious concerns.
>>> The latest Featured Stock Update with an annotated graph appeared on 4/9/2012. Click here.
View all notes |
Alert me of new notes |
CANSLIM.net Company Profile |
SEC |
Zacks Reports |
StockTalk |
News |
Chart |
Request a new note
C
A N
S L
I M
|
SHFL
-
NASDAQ
Shuffle Master Inc
MANUFACTURING - Diversified Machinery
|
$16.89
|
-0.02
-0.12% |
$16.98
|
460,030
70.17% of 50 DAV
50 DAV is 655,600
|
$18.77
-10.02%
|
3/6/2012
|
$17.07
|
PP = $15.25
|
|
MB = $16.01
|
Most Recent Note - 4/18/2012 1:57:37 PM
G - Volume totals have been cooling while recently consolidating above its 50 DMA line. Last week's low and its short-term average define important near-term chart support to watch. It is -9.5% off its 52-week high today, extended from any sound base pattern.
>>> The latest Featured Stock Update with an annotated graph appeared on 3/15/2012. Click here.
View all notes |
Alert me of new notes |
CANSLIM.net Company Profile |
SEC |
Zacks Reports |
StockTalk |
News |
Chart |
Request a new note
C
A N
S L
I M
|
SXCI
-
NASDAQ
S X C Health Solutions
COMPUTER SOFTWARE and SERVICES - Healthcare Information Service
|
$93.06
|
-2.75
-2.87% |
$95.00
|
1,449,537
175.00% of 50 DAV
50 DAV is 828,300
|
$100.50
-7.40%
|
2/23/2012
|
$68.24
|
PP = $66.05
|
|
MB = $69.35
|
Most Recent Note - 4/23/2012 2:44:55 PM
G - Perched near its all-time high today, very extended from its prior base. The market cheered the 4/18/12 news it will acquire and merge with Catalyst Health Solutions Inc (CHSI), rallying with volume-driven gains.
>>> The latest Featured Stock Update with an annotated graph appeared on 3/6/2012. Click here.
View all notes |
Alert me of new notes |
CANSLIM.net Company Profile |
SEC |
Zacks Reports |
StockTalk |
News |
Chart |
Request a new note
C
A N
S L
I M
|
TDG
-
NYSE
Transdigm Group Inc
AEROSPACE/DEFENSE - Aerospace/Defense Products and; Services
|
$122.00
|
-0.25
-0.20% |
$122.20
|
437,239
106.83% of 50 DAV
50 DAV is 409,300
|
$123.39
-1.13%
|
2/29/2012
|
$120.10
|
PP = $118.93
|
|
MB = $124.88
|
Most Recent Note - 4/23/2012 2:49:55 PM
Y - Pulling back today. On the prior session it hit new 52-week and all-time highs with +75% above average volume, meeting the guideline for a proper technical buy signal. The encouraging sign of fresh institutional buying demand may signal the beginning of a meaningful leg up, but keep in mind 3 out of 4 stocks follow the direction of the major averages (M criteria) and the market has recently been pulling back under distributional pressure. Subsequent deterioration below its 50 DMA line or prior lows ($110.60 on 3/20/12) would trigger more worrisome technical sell signals.
>>> The latest Featured Stock Update with an annotated graph appeared on 3/30/2012. Click here.
View all notes |
Alert me of new notes |
CANSLIM.net Company Profile |
SEC |
Zacks Reports |
StockTalk |
News |
Chart |
Request a new note
C
A N
S L
I M
|
Symbol/Exchange
Company Name
Industry Group |
PRICE |
CHANGE
(%Change) |
Day High |
Volume
(% DAV)
(% 50 day avg vol) |
52 Wk Hi
% From Hi |
Featured
Date |
Price
Featured |
Pivot Featured |
|
Max Buy |
TIBX
-
NASDAQ
Tibco Software Inc
COMPUTER SOFTWARE and SERVICES - Business Software and Services
|
$32.90
|
-0.60
-1.79% |
$33.08
|
3,939,672
141.53% of 50 DAV
50 DAV is 2,783,700
|
$34.67
-5.10%
|
3/30/2012
|
$31.01
|
PP = $31.25
|
|
MB = $32.81
|
Most Recent Note - 4/23/2012 12:51:40 PM
G - Gapped down today amid widespread market weakness, and it has slumped under the "max buy" level cited. Its 3rd consecutive loss has it now testing the previously noted upward trendline connecting its December, March, and April lows which defines an initial support level to watch above additional support at prior highs in the $31 area and its 50 DMA line.
>>> The latest Featured Stock Update with an annotated graph appeared on 4/5/2012. Click here.
View all notes |
Alert me of new notes |
CANSLIM.net Company Profile |
SEC |
Zacks Reports |
StockTalk |
News |
Chart |
Request a new note
C
A N
S L
I M
|
TNGO
-
NASDAQ
Tangoe Inc
COMPUTER SOFTWARE and SERVICES - Technical and System Software
|
$19.64
|
-0.98
-4.75% |
$20.36
|
488,062
73.45% of 50 DAV
50 DAV is 664,500
|
$21.74
-9.66%
|
3/27/2012
|
$19.35
|
PP = $20.00
|
|
MB = $21.00
|
Most Recent Note - 4/23/2012 11:39:14 AM
Y - Today's 2nd consecutive loss amid a mostly negative market has negated the recent breakout with it slumping under prior highs in the $20 area previously noted as initial support to watch on pullbacks. The 50 DMA line ($18.38) is the next important support level to watch.
>>> The latest Featured Stock Update with an annotated graph appeared on 4/3/2012. Click here.
View all notes |
Alert me of new notes |
CANSLIM.net Company Profile |
SEC |
Zacks Reports |
StockTalk |
News |
Chart |
Request a new note
C
A N
S L
I M
|
TPX
-
NYSE
Tempur Pedic Intl Inc
MANUFACTURING - Textile Manufacturing
|
$65.12
|
-1.41
-2.12% |
$66.52
|
3,171,895
199.59% of 50 DAV
50 DAV is 1,589,200
|
$87.43
-25.52%
|
4/19/2012
|
$84.83
|
PP = $86.71
|
|
MB = $91.05
|
Most Recent Note - 4/23/2012 5:17:48 PM
Down again today, and due to fundamental and technical deterioration it will be dropped from the Featured Stocks list tonight. A damaging gap down on 4/20/12 violated its 50 DMA line and left it near its 200 DMA line. Reported disappointing earnings Thursday evening after highlighted in the mid-day report in yellow with pivot point cited based on its 4/03/12 high plus 10 cents and noted - "A volume-driven gain above its pivot point is still necessary to trigger a buy signal." See the latest FSU analysis for additional details and a new annotated graph.
>>> The latest Featured Stock Update with an annotated graph appeared on 4/19/2012. Click here.
View all notes |
Alert me of new notes |
CANSLIM.net Company Profile |
SEC |
Zacks Reports |
StockTalk |
News |
Chart |
Request a new note
C
A N
S L
I M
|
TSCO
-
NASDAQ
Tractor Supply Co
SPECIALTY RETAIL - Specialty Retail, Other
|
$99.41
|
-0.05
-0.05% |
$99.54
|
637,599
87.23% of 50 DAV
50 DAV is 730,900
|
$101.20
-1.77%
|
1/12/2012
|
$79.12
|
PP = $75.58
|
|
MB = $79.36
|
Most Recent Note - 4/19/2012 12:51:08 PM
G - Inching up for another new all-time high today, very extended from its prior base. Its 50 DMA line defines support to watch on pullbacks.
>>> The latest Featured Stock Update with an annotated graph appeared on 4/17/2012. Click here.
View all notes |
Alert me of new notes |
CANSLIM.net Company Profile |
SEC |
Zacks Reports |
StockTalk |
News |
Chart |
Request a new note
C
A N
S L
I M
|
UA
-
NYSE
Under Armour Inc Cl A
CONSUMER NON-DURABLES - Textile - Apparel Clothing
|
$100.45
|
-1.08
-1.06% |
$100.99
|
1,949,291
203.26% of 50 DAV
50 DAV is 959,000
|
$102.86
-2.34%
|
2/15/2012
|
$85.77
|
PP = $84.86
|
|
MB = $89.10
|
Most Recent Note - 4/23/2012 12:53:35 PM
G - Small gap down today amid widespread market weakness. No new pivot point was cited due to concerns over the weaker fundamentals, however, no overhead supply remains to act as resistance after its volume-driven gain on 4/20/12 for new 52-week and all-time highs, technically rallying from a new orderly base pattern well above its 50 DMA line and prior highs. Reported earnings +22% on +23% sales revenues for the quarter ended March 31, 2012 versus the year ago period, its first quarterly earnings increase below the +25% minimum guideline in more than 2 years.
>>> The latest Featured Stock Update with an annotated graph appeared on 4/4/2012. Click here.
View all notes |
Alert me of new notes |
CANSLIM.net Company Profile |
SEC |
Zacks Reports |
StockTalk |
News |
Chart |
Request a new note
C
A N
S L
I M
|
Symbol/Exchange
Company Name
Industry Group |
PRICE |
CHANGE
(%Change) |
Day High |
Volume
(% DAV)
(% 50 day avg vol) |
52 Wk Hi
% From Hi |
Featured
Date |
Price
Featured |
Pivot Featured |
|
Max Buy |
UBNT
-
NASDAQ
Ubiquiti Networks Inc
TELECOMMUNICATIONS - Diversified Communication Serv
|
$31.87
|
-0.27
-0.84% |
$32.44
|
407,622
117.37% of 50 DAV
50 DAV is 347,300
|
$35.32
-9.77%
|
4/12/2012
|
$33.89
|
PP = $34.07
|
|
MB = $35.77
|
Most Recent Note - 4/23/2012 2:33:14 PM
Y - Still pulling back from its all-time high. Formed an advanced "ascending base" pattern marked by 3 pullbacks of 10-20% following its previous breakout. Prior low ($30.25 on 4/09/12) defines initial support above its 50 DMA line.
>>> The latest Featured Stock Update with an annotated graph appeared on 4/20/2012. Click here.
View all notes |
Alert me of new notes |
CANSLIM.net Company Profile |
SEC |
Zacks Reports |
StockTalk |
News |
Chart |
Request a new note
C
A N
S L
I M
|
ULTA
-
NASDAQ
Ulta Salon Cosm & Frag
SPECIALTY RETAIL - Specialty Retail, Other
|
$93.53
|
-1.82
-1.91% |
$94.56
|
396,444
59.71% of 50 DAV
50 DAV is 664,000
|
$96.65
-3.23%
|
1/11/2012
|
$71.97
|
PP = $75.80
|
|
MB = $79.59
|
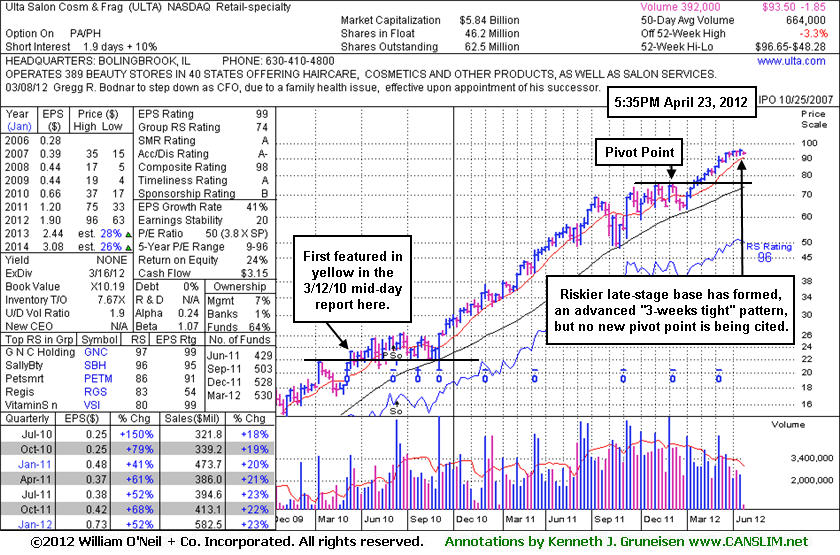
Most Recent Note - 4/23/2012 5:59:54 PM
G - It has not spent much time basing, and deteriorating market conditions (M criteria) raise concerns. Its 50 DMA line defines support to watch well above its prior highs in the $75 area. See the latest FSU analysis for more details and a new annotated graph.
>>> The latest Featured Stock Update with an annotated graph appeared on 4/23/2012. Click here.
View all notes |
Alert me of new notes |
CANSLIM.net Company Profile |
SEC |
Zacks Reports |
StockTalk |
News |
Chart |
Request a new note
C
A N
S L
I M
|
V
-
NYSE
Visa Inc Cl A
DIVERSIFIED SERVICES - Business/Management Services
|
$118.10
|
-2.91
-2.40% |
$120.81
|
4,329,589
127.74% of 50 DAV
50 DAV is 3,389,400
|
$123.68
-4.51%
|
3/12/2012
|
$116.53
|
PP = $119.46
|
|
MB = $125.43
|
Most Recent Note - 4/23/2012 2:37:54 PM
Y - Dipped below its 50 DMA line earlier in the session and volume is running at an above average pace today while on track for its 4th consecutive loss. Sputtering since its 4/13/12 gain backed by +49% above average volume technically confirmed a buy signal. Its 50 DMA line defines support to watch well above prior highs in the $103-104 area.
>>> The latest Featured Stock Update with an annotated graph appeared on 3/7/2012. Click here.
View all notes |
Alert me of new notes |
CANSLIM.net Company Profile |
SEC |
Zacks Reports |
StockTalk |
News |
Chart |
Request a new note
C
A N
S L
I M
|
VMW
-
NYSE
Vmware Inc Cl A
COMPUTER SOFTWARE andamp; SERVICES - Technical andamp; System Software
|
$107.52
|
-3.72
-3.34% |
$109.63
|
2,119,902
140.21% of 50 DAV
50 DAV is 1,512,000
|
$118.79
-9.49%
|
4/18/2012
|
$110.04
|
PP = $115.29
|
|
MB = $121.05
|
Most Recent Note - 4/23/2012 2:42:24 PM
Y - Gapped down today amid widespread market weakness, falling toward its 50 DMA line. Reported +38% earnings on +25% sales revenues for the quarter ended March 31, 2012 versus the year ago period. Its finish in the lower third of its intra-day range on 4/19/12 kept it from clinching a technical buy signal. Featured in the 4/18/12 mid-day report (read here) in yellow with a pivot point cited based on its 52-week high plus 10 cents after a few very tight closes on its weekly chart while also finding support at its 10-week moving average.
>>> The latest Featured Stock Update with an annotated graph appeared on 4/18/2012. Click here.
View all notes |
Alert me of new notes |
CANSLIM.net Company Profile |
SEC |
Zacks Reports |
StockTalk |
News |
Chart |
Request a new note
C
A N
S L
I M
|