***Last / Change / Volume data in this table is the closing quote data***
Symbol/Exchange
Company Name
Industry Group |
PRICE |
CHANGE
(%Change) |
Day High |
Volume
(% DAV)
(% 50 day avg vol) |
52 Wk Hi
% From Hi |
Featured
Date |
Price
Featured |
Pivot Featured |
|
Max Buy |
ACN
-
NYSE
Accenture Plc
DIVERSIFIED SERVICES - Business/Management Services
|
$63.40
|
+0.35
0.56% |
$63.90
|
2,695,579
81.70% of 50 DAV
50 DAV is 3,299,200
|
$65.89
-3.78%
|
3/23/2012
|
$64.13
|
PP = $63.76
|
|
MB = $66.95
|
Most Recent Note - 4/17/2012 5:35:28 PM
Y - Solid gain today with higher volume, rebounding back above its pivot point. Found support near prior highs in the $62-63 area and stayed well above its 50 DMA line.
>>> The latest Featured Stock Update with an annotated graph appeared on 3/23/2012. Click here.
View all notes |
Alert me of new notes |
CANSLIM.net Company Profile |
SEC |
Zacks Reports |
StockTalk |
News |
Chart |
Request a new note
C
A N
S L
I M


|
ADS
-
NYSE
Alliance Data Sys Corp
COMPUTER SOFTWARE and SERVICES - Information and Delivery Service
|
$128.40
|
+0.96
0.75% |
$128.70
|
546,671
86.81% of 50 DAV
50 DAV is 629,700
|
$130.31
-1.47%
|
1/17/2012
|
$108.24
|
PP = $107.43
|
|
MB = $112.80
|
Most Recent Note - 4/19/2012 11:43:03 AM
G - No resistance remains due to overhead supply and it hit another new all-time high today. Reported earnings +17% on +20% sales revenues for the quarter ended March 31, 2012 versus the year-ago period. Fundamental concerns were raised earlier by earnings reported +9%, well below the +25% minimum guideline, for the latest quarter ended December 31, 2011 versus the year-ago period.
>>> The latest Featured Stock Update with an annotated graph appeared on 2/29/2012. Click here.
View all notes |
Alert me of new notes |
CANSLIM.net Company Profile |
SEC |
Zacks Reports |
StockTalk |
News |
Chart |
Request a new note
C
A N
S L
I M
|
ALLT
-
NASDAQ
Allot Communications Ltd
COMPUTER SOFTWARE andamp; SERVICES - Technical andamp; System Software
|
$23.66
|
+0.11
0.47% |
$24.22
|
164,703
35.89% of 50 DAV
50 DAV is 458,900
|
$25.36
-6.70%
|
3/13/2012
|
$19.72
|
PP = $18.91
|
|
MB = $19.86
|
Most Recent Note - 4/18/2012 1:37:19 PM
G - Volume totals have been cooling while stubbornly holding its ground, a sign that few are exiting, while it remains perched near its 52-week high. Its latest consolidation has been brief, yet it may be forming an advanced "3-weeks tight" base well above its 50 DMA line and prior highs near $18-19 that define support to watch on pullbacks.
>>> The latest Featured Stock Update with an annotated graph appeared on 3/19/2012. Click here.
View all notes |
Alert me of new notes |
CANSLIM.net Company Profile |
SEC |
Zacks Reports |
StockTalk |
News |
Chart |
Request a new note
C
A N
S L
I M
|
ALXN
-
NASDAQ
Alexion Pharmaceuticals
DRUGS - Drug Manufacturers - Other
|
$91.76
|
+0.79
0.87% |
$92.59
|
921,273
71.56% of 50 DAV
50 DAV is 1,287,500
|
$95.01
-3.42%
|
3/12/2012
|
$87.87
|
PP = $87.73
|
|
MB = $92.12
|
Most Recent Note - 4/16/2012 7:02:56 PM
G - Testing support at its 50 DMA line today, which nearly coincides with its latest pivot point cited, after encountering recent distributional pressure. See the latest FSU analysis for more details and a new annotated graph.
>>> The latest Featured Stock Update with an annotated graph appeared on 4/16/2012. Click here.
View all notes |
Alert me of new notes |
CANSLIM.net Company Profile |
SEC |
Zacks Reports |
StockTalk |
News |
Chart |
Request a new note
C
A N
S L
I M
|
BODY
-
NASDAQ
Body Central Corp
RETAIL - Catalog andamp; Mail Order Houses
|
$27.74
|
+0.47
1.72% |
$27.90
|
98,778
50.27% of 50 DAV
50 DAV is 196,500
|
$29.49
-5.93%
|
4/18/2012
|
$27.44
|
PP = $29.59
|
|
MB = $31.07
|
Most Recent Note - 4/18/2012 1:41:04 PM
Y - Hovering near its 50 DMA line today, finding support near that important short-term average. Color code is changed to yellow with new pivot point cited based on its 52-week high plus 10 cents. Volume-driven gains above the pivot point may trigger a new (or add-on) technical buy signal. Subsequent damaging losses below its recent lows would raise more serious concerns and trigger additional sell signals.
>>> The latest Featured Stock Update with an annotated graph appeared on 3/13/2012. Click here.
View all notes |
Alert me of new notes |
CANSLIM.net Company Profile |
SEC |
Zacks Reports |
StockTalk |
News |
Chart |
Request a new note
C
A N
S L
I M
|
Symbol/Exchange
Company Name
Industry Group |
PRICE |
CHANGE
(%Change) |
Day High |
Volume
(% DAV)
(% 50 day avg vol) |
52 Wk Hi
% From Hi |
Featured
Date |
Price
Featured |
Pivot Featured |
|
Max Buy |
CDNS
-
NASDAQ
Cadence Design Systems
COMPUTER SOFTWARE and SERVICES - Technical and System Software
|
$11.52
|
-0.04
-0.35% |
$11.66
|
1,371,393
48.17% of 50 DAV
50 DAV is 2,846,800
|
$12.60
-8.57%
|
2/3/2012
|
$11.66
|
PP = $11.15
|
|
MB = $11.71
|
Most Recent Note - 4/18/2012 1:42:38 PM
G - Still lingering below its 50 DMA line which may now act as resistance. Last week's low ($11.20 on 4/10/12) defines important near-term support level above its 200 DMA line.
>>> The latest Featured Stock Update with an annotated graph appeared on 3/28/2012. Click here.
View all notes |
Alert me of new notes |
CANSLIM.net Company Profile |
SEC |
Zacks Reports |
StockTalk |
News |
Chart |
Request a new note
C
A N
S L
I M
|
CELG
-
NASDAQ
Celgene Corp
DRUGS - Drug Manufacturers - Major
|
$79.10
|
+0.51
0.65% |
$79.91
|
2,944,967
109.50% of 50 DAV
50 DAV is 2,689,500
|
$80.42
-1.64%
|
2/2/2012
|
$74.16
|
PP = $75.21
|
|
MB = $78.97
|
Most Recent Note - 4/18/2012 1:45:31 PM
G - Volume totals have been cooling while still stubbornly holding its ground and dipping below its "max buy" level briefly during the past week. Its 50 DMA line defines important support to watch.
>>> The latest Featured Stock Update with an annotated graph appeared on 3/26/2012. Click here.
View all notes |
Alert me of new notes |
CANSLIM.net Company Profile |
SEC |
Zacks Reports |
StockTalk |
News |
Chart |
Request a new note
C
A N
S L
I M
|
COO
-
NYSE
Cooper Companies Inc
HEALTH SERVICES - Medical Instruments and Supplies
|
$85.48
|
-0.38
-0.44% |
$87.18
|
494,668
116.39% of 50 DAV
50 DAV is 425,000
|
$86.11
-0.73%
|
3/9/2012
|
$83.05
|
PP = $81.02
|
|
MB = $85.07
|
Most Recent Note - 4/18/2012 1:51:04 PM
Y - Inching higher today with below average volume, trading at its 52-week high and near its "max buy" level. Wedging higher with no resistance remaining, but not showing signs of institutional accumulation since its big 4/05/12 gain on high volume. Its Relative Strength rating has improved to 84 now, better than the 80+ guideline for buy candidates.
>>> The latest Featured Stock Update with an annotated graph appeared on 3/9/2012. Click here.
View all notes |
Alert me of new notes |
CANSLIM.net Company Profile |
SEC |
Zacks Reports |
StockTalk |
News |
Chart |
Request a new note
C
A N
S L
I M
|
DISH
-
NASDAQ
Dish Network Corp Cl A
CONSUMER DURABLES - Electronic Equipment
|
$31.65
|
+0.21
0.67% |
$32.27
|
2,771,275
106.49% of 50 DAV
50 DAV is 2,602,400
|
$35.64
-11.20%
|
3/7/2012
|
$30.83
|
PP = $30.10
|
|
MB = $31.61
|
Most Recent Note - 4/18/2012 1:27:09 PM
G - Violated its 50 DMA line and slumping near its pivot point with a damaging loss today on above average volume raising concerns. A prompt show of support near that important short-term average would help its outlook, but a weak finish and further deterioration would raise more serious concerns.
>>> The latest Featured Stock Update with an annotated graph appeared on 3/14/2012. Click here.
View all notes |
Alert me of new notes |
CANSLIM.net Company Profile |
SEC |
Zacks Reports |
StockTalk |
News |
Chart |
Request a new note
C
A N
S L
I M
|
FEIC
-
NASDAQ
F E I Co
ELECTRONICS - Diversified Electronics
|
$47.07
|
+0.07
0.15% |
$48.10
|
196,147
62.23% of 50 DAV
50 DAV is 315,200
|
$49.92
-5.71%
|
12/7/2011
|
$41.41
|
PP = $42.35
|
|
MB = $44.47
|
Most Recent Note - 4/18/2012 2:04:49 PM
G - Volume totals have been cooling while consolidating above its 50 DMA line. The latest quarterly report showed +21% earnings for the Dec '11 quarter, below the +25% minimum guideline for earnings growth.
>>> The latest Featured Stock Update with an annotated graph appeared on 3/12/2012. Click here.
View all notes |
Alert me of new notes |
CANSLIM.net Company Profile |
SEC |
Zacks Reports |
StockTalk |
News |
Chart |
Request a new note
C
A N
S L
I M
|
Symbol/Exchange
Company Name
Industry Group |
PRICE |
CHANGE
(%Change) |
Day High |
Volume
(% DAV)
(% 50 day avg vol) |
52 Wk Hi
% From Hi |
Featured
Date |
Price
Featured |
Pivot Featured |
|
Max Buy |
GNC
-
NYSE
G N C Holdings Inc
RETAIL - Drug Stores
|
$35.65
|
+0.38
1.08% |
$35.89
|
1,422,436
86.71% of 50 DAV
50 DAV is 1,640,400
|
$36.10
-1.25%
|
1/19/2012
|
$28.99
|
PP = $29.60
|
|
MB = $31.08
|
Most Recent Note - 4/17/2012 3:46:35 PM
G - Posting a solid gain today on higher volume, rallying after a pullback near its 50 DMA line, important support to watch on pullbacks. It completed Secondary Offerings on 10/25/11 and 3/13/12 after making steady progress following its 4/01/11 IPO.
>>> The latest Featured Stock Update with an annotated graph appeared on 3/5/2012. Click here.
View all notes |
Alert me of new notes |
CANSLIM.net Company Profile |
SEC |
Zacks Reports |
StockTalk |
News |
Chart |
Request a new note
C
A N
S L
I M
|
HLF
-
NYSE
Herbalife Ltd
DRUGS - Nutrition and Weight Management
|
$72.32
|
+1.41
1.99% |
$72.68
|
1,323,295
97.01% of 50 DAV
50 DAV is 1,364,100
|
$72.11
0.29%
|
4/18/2012
|
$71.19
|
PP = $72.21
|
|
MB = $75.82
|
Most Recent Note - 4/18/2012 2:03:02 PM
Y - Color code is changed to yellow with new pivot point cited based on its 52-week high plus 10 cents after forming an orderly flat base of sufficient length. Volume-driven gains for new highs may trigger a new (or add-on) technical buy signal. Consolidating above its 50 DMA line, important support to watch.
>>> The latest Featured Stock Update with an annotated graph appeared on 4/13/2012. Click here.
View all notes |
Alert me of new notes |
CANSLIM.net Company Profile |
SEC |
Zacks Reports |
StockTalk |
News |
Chart |
Request a new note
C
A N
S L
I M
|
ISRG
-
NASDAQ
Intuitive Surgical Inc
HEALTH SERVICES - Medical Appliances and Equipment
|
$576.57
|
-2.65
-0.46% |
$582.10
|
577,960
199.92% of 50 DAV
50 DAV is 289,100
|
$594.89
-3.08%
|
12/20/2011
|
$442.43
|
PP = $449.16
|
|
MB = $471.62
|
 Most Recent Note - 4/20/2012 12:13:37 PM
G - Holding its ground following a considerable gap up gain on 4/18/12. It may produce more climactic gains, however it has not spent much time basing since its last "Featured Date" when highlighted in yellow on 12/23/11. Disciplined investors always limit losses if any stock falls -7% from their purchase price. It is on track for a 10th consecutive weekly gain.
>>> The latest Featured Stock Update with an annotated graph appeared on 3/1/2012. Click here.
View all notes |
Alert me of new notes |
CANSLIM.net Company Profile |
SEC |
Zacks Reports |
StockTalk |
News |
Chart |
Request a new note
C
A N
S L
I M
|
LULU
-
NASDAQ
Lululemon Athletica
MANUFACTURING - Textile Manufacturing
|
$73.70
|
+0.74
1.01% |
$74.44
|
1,099,157
55.55% of 50 DAV
50 DAV is 1,978,800
|
$77.13
-4.45%
|
1/10/2012
|
$60.97
|
PP = $59.46
|
|
MB = $62.43
|
Most Recent Note - 4/16/2012 12:16:07 PM
G - Holding its ground since a damaging loss on 4/10/12 violated a previously noted upward trendline connecting January-March lows. Its 50 DMA line defines the next important support level to watch. See the latest FSU analysis for more details and an annotated graph.
>>> The latest Featured Stock Update with an annotated graph appeared on 4/12/2012. Click here.
View all notes |
Alert me of new notes |
CANSLIM.net Company Profile |
SEC |
Zacks Reports |
StockTalk |
News |
Chart |
Request a new note
C
A N
S L
I M
|
MA
-
NYSE
Mastercard Inc Cl A
DIVERSIFIED SERVICES - Business/Management Services
|
$440.44
|
+3.62
0.83% |
$443.29
|
906,697
111.25% of 50 DAV
50 DAV is 815,000
|
$443.80
-0.76%
|
3/12/2012
|
$419.86
|
PP = $428.67
|
|
MB = $450.10
|
Most Recent Note - 4/16/2012 5:48:34 PM
Y - Pulled back with lighter volume today following a prior gain on near average volume, not a fresh sign of institutional buying demand. Its 50 DMA line defines near-term support to watch.
>>> The latest Featured Stock Update with an annotated graph appeared on 4/11/2012. Click here.
View all notes |
Alert me of new notes |
CANSLIM.net Company Profile |
SEC |
Zacks Reports |
StockTalk |
News |
Chart |
Request a new note
C
A N
S L
I M
|
Symbol/Exchange
Company Name
Industry Group |
PRICE |
CHANGE
(%Change) |
Day High |
Volume
(% DAV)
(% 50 day avg vol) |
52 Wk Hi
% From Hi |
Featured
Date |
Price
Featured |
Pivot Featured |
|
Max Buy |
MELI
-
NASDAQ
Mercadolibre Inc
INTERNET - Internet Software and; Services
|
$90.48
|
-0.96
-1.05% |
$92.67
|
294,172
60.10% of 50 DAV
50 DAV is 489,500
|
$104.50
-13.42%
|
2/6/2012
|
$97.09
|
PP = $95.58
|
|
MB = $100.36
|
Most Recent Note - 4/19/2012 11:18:44 AM
G - Up today after violating a previously noted low ($91.38 on 3/06/12) on the prior session. Only a prompt rebound above its 50 DMA line would help its technical stance and improve its outlook.
>>> The latest Featured Stock Update with an annotated graph appeared on 3/29/2012. Click here.
View all notes |
Alert me of new notes |
CANSLIM.net Company Profile |
SEC |
Zacks Reports |
StockTalk |
News |
Chart |
Request a new note
C
A N
S L
I M
|
MG
-
NYSE
Mistras Group Inc
DIVERSIFIED SERVICES - Bulding and Faci;ity Management Services
|
$23.68
|
+0.67
2.91% |
$24.02
|
61,816
58.59% of 50 DAV
50 DAV is 105,500
|
$26.24
-9.76%
|
3/22/2012
|
$24.96
|
PP = $26.34
|
|
MB = $27.66
|
Most Recent Note - 4/20/2012 1:38:13 PM
G - Gain today has it rebounding above its 50 DMA line. A volume-driven gain above its recent chart high ($25.49 on 3/21/12) may help trigger a proper technical buy signal after a new base formation, however no new (lower) pivot point is currently being cited, and it may continue encountering stubborn resistance.
>>> The latest Featured Stock Update with an annotated graph appeared on 4/2/2012. Click here.
View all notes |
Alert me of new notes |
CANSLIM.net Company Profile |
SEC |
Zacks Reports |
StockTalk |
News |
Chart |
Request a new note
C
A N
S L
I M
|
MKTX
-
NASDAQ
Marketaxess Holdings Inc
FINANCIAL SERVICES - Investment Brokerage - Nationa
|
$36.41
|
-0.06
-0.16% |
$36.96
|
150,833
48.50% of 50 DAV
50 DAV is 311,000
|
$37.95
-4.06%
|
3/8/2012
|
$35.80
|
PP = $35.52
|
|
MB = $37.30
|
Most Recent Note - 4/20/2012 1:40:58 PM
Y - Color code was changed to yellow based on its impressive resilience. Volume totals have been cooling since it rebounded above its 50 DMA line after a brief intra-day violation on 4/12/12.
>>> The latest Featured Stock Update with an annotated graph appeared on 3/8/2012. Click here.
View all notes |
Alert me of new notes |
CANSLIM.net Company Profile |
SEC |
Zacks Reports |
StockTalk |
News |
Chart |
Request a new note
C
A N
S L
I M
|
NTES
-
NASDAQ
Netease Inc Adr
INTERNET - Internet Information Providers
|
$58.54
|
-0.17
-0.29% |
$59.53
|
384,402
55.34% of 50 DAV
50 DAV is 694,600
|
$60.50
-3.24%
|
3/19/2012
|
$56.18
|
PP = $55.10
|
|
MB = $57.86
|
Most Recent Note - 4/17/2012 5:50:42 PM
Y - Up today on higher but below average volume, rallying to a strong close near its "max buy" level. Last week's low and prior highs in the $55 area define important near-term chart support to watch.
>>> The latest Featured Stock Update with an annotated graph appeared on 3/27/2012. Click here.
View all notes |
Alert me of new notes |
CANSLIM.net Company Profile |
SEC |
Zacks Reports |
StockTalk |
News |
Chart |
Request a new note
C
A N
S L
I M
|
RAX
-
NYSE
Rackspace Hosting Inc
INTERNET - Internet Software and; Services
|
$56.21
|
-1.14
-1.99% |
$58.11
|
1,317,381
67.16% of 50 DAV
50 DAV is 1,961,600
|
$60.00
-6.32%
|
2/2/2012
|
$46.69
|
PP = $45.55
|
|
MB = $47.83
|
Most Recent Note - 4/17/2012 5:52:05 PM
G - Up today with higher but below average volume. Extended from its prior base and consolidating above its 50 DMA line which defines important near-term support to watch.
>>> The latest Featured Stock Update with an annotated graph appeared on 4/10/2012. Click here.
View all notes |
Alert me of new notes |
CANSLIM.net Company Profile |
SEC |
Zacks Reports |
StockTalk |
News |
Chart |
Request a new note
C
A N
S L
I M
|
Symbol/Exchange
Company Name
Industry Group |
PRICE |
CHANGE
(%Change) |
Day High |
Volume
(% DAV)
(% 50 day avg vol) |
52 Wk Hi
% From Hi |
Featured
Date |
Price
Featured |
Pivot Featured |
|
Max Buy |
RGR
-
NYSE
Sturm Ruger & Co Inc
CONSUMER DURABLES - Sporting Goods
|
$53.44
|
+1.92
3.73% |
$53.51
|
664,238
175.96% of 50 DAV
50 DAV is 377,500
|
$53.29
0.28%
|
3/22/2012
|
$46.49
|
PP = $46.78
|
|
MB = $49.12
|
Most Recent Note - 4/20/2012 11:18:21 AM
G - Hit a new 52-week high today while on track for its 4th consecutive gain, getting more extended from any sound base. Found prompt support after a pullback near its prior high in the $46 area previously noted as support to watch above its 50 DMA line.
>>> The latest Featured Stock Update with an annotated graph appeared on 3/22/2012. Click here.
View all notes |
Alert me of new notes |
CANSLIM.net Company Profile |
SEC |
Zacks Reports |
StockTalk |
News |
Chart |
Request a new note
C
A N
S L
I M
|
RRTS
-
NYSE
Roadrunner Trans Systems
TRANSPORTATION - Air Delivery and Freight Service
|
$17.32
|
+0.45
2.67% |
$17.80
|
39,555
35.04% of 50 DAV
50 DAV is 112,900
|
$18.59
-6.83%
|
2/10/2012
|
$17.40
|
PP = $17.50
|
|
MB = $18.38
|
Most Recent Note - 4/20/2012 11:13:38 AM
G - Gapped up today, trading near its 50 DMA line which may now act as resistance. After finding recent support, any subsequent deterioration below the prior low ($16.65 on 4/10/12) would raise more serious concerns.
>>> The latest Featured Stock Update with an annotated graph appeared on 4/9/2012. Click here.
View all notes |
Alert me of new notes |
CANSLIM.net Company Profile |
SEC |
Zacks Reports |
StockTalk |
News |
Chart |
Request a new note
C
A N
S L
I M
|
SHFL
-
NASDAQ
Shuffle Master Inc
MANUFACTURING - Diversified Machinery
|
$16.91
|
+0.15
0.89% |
$17.36
|
885,437
136.43% of 50 DAV
50 DAV is 649,000
|
$18.77
-9.91%
|
3/6/2012
|
$17.07
|
PP = $15.25
|
|
MB = $16.01
|
Most Recent Note - 4/18/2012 1:57:37 PM
G - Volume totals have been cooling while recently consolidating above its 50 DMA line. Last week's low and its short-term average define important near-term chart support to watch. It is -9.5% off its 52-week high today, extended from any sound base pattern.
>>> The latest Featured Stock Update with an annotated graph appeared on 3/15/2012. Click here.
View all notes |
Alert me of new notes |
CANSLIM.net Company Profile |
SEC |
Zacks Reports |
StockTalk |
News |
Chart |
Request a new note
C
A N
S L
I M
|
SXCI
-
NASDAQ
S X C Health Solutions
COMPUTER SOFTWARE and SERVICES - Healthcare Information Service
|
$95.81
|
-1.19
-1.23% |
$100.50
|
2,919,801
374.67% of 50 DAV
50 DAV is 779,300
|
$97.59
-1.82%
|
2/23/2012
|
$68.24
|
PP = $66.05
|
|
MB = $69.35
|
Most Recent Note - 4/20/2012 12:37:19 PM
G - The market has cheered the 4/18/12 news it will acquire and merge with Catalyst Health Solutions Inc (CHSI), however it is now very extended from its prior base, up again today and adding to its streak of volume-driven gains for new 52-week highs.
>>> The latest Featured Stock Update with an annotated graph appeared on 3/6/2012. Click here.
View all notes |
Alert me of new notes |
CANSLIM.net Company Profile |
SEC |
Zacks Reports |
StockTalk |
News |
Chart |
Request a new note
C
A N
S L
I M
|
TDG
-
NYSE
Transdigm Group Inc
AEROSPACE/DEFENSE - Aerospace/Defense Products and; Services
|
$122.25
|
+3.18
2.67% |
$123.39
|
719,808
175.18% of 50 DAV
50 DAV is 410,900
|
$121.48
0.63%
|
2/29/2012
|
$120.10
|
PP = $118.93
|
|
MB = $124.88
|
Most Recent Note - 4/20/2012 1:47:09 PM
Y - Gapped up today hitting new 52-week and all-time highs with volume running at an above average pace. The volume-driven gain (not yet the +40% above average volume needed to meet the minimum guideline for a proper technical buy signal) is an encouraging sign of fresh institutional buying demand that may signal the beginning of a meaningful leg up. Subsequent deterioration below its 50 DMA line or prior lows ($110.60 on 3/20/12) would trigger more worrisome technical sell signals.
>>> The latest Featured Stock Update with an annotated graph appeared on 3/30/2012. Click here.
View all notes |
Alert me of new notes |
CANSLIM.net Company Profile |
SEC |
Zacks Reports |
StockTalk |
News |
Chart |
Request a new note
C
A N
S L
I M
|
Symbol/Exchange
Company Name
Industry Group |
PRICE |
CHANGE
(%Change) |
Day High |
Volume
(% DAV)
(% 50 day avg vol) |
52 Wk Hi
% From Hi |
Featured
Date |
Price
Featured |
Pivot Featured |
|
Max Buy |
TIBX
-
NASDAQ
Tibco Software Inc
COMPUTER SOFTWARE and SERVICES - Business Software and Services
|
$33.50
|
-0.21
-0.62% |
$34.05
|
2,404,091
86.51% of 50 DAV
50 DAV is 2,778,900
|
$34.67
-3.37%
|
3/30/2012
|
$31.01
|
PP = $31.25
|
|
MB = $32.81
|
Most Recent Note - 4/18/2012 1:03:53 PM
G - Up today with volume running at an above average pace while getting further extended from its previous base. Color code was changed to green after rising beyond the cited "max buy" level. An upward trendline connecting its December, March, and April lows defines an initial support level to watch above additional support at prior highs in the $31 area and its 50 DMA line.
>>> The latest Featured Stock Update with an annotated graph appeared on 4/5/2012. Click here.
View all notes |
Alert me of new notes |
CANSLIM.net Company Profile |
SEC |
Zacks Reports |
StockTalk |
News |
Chart |
Request a new note
C
A N
S L
I M
|
TNGO
-
NASDAQ
Tangoe Inc
COMPUTER SOFTWARE and SERVICES - Technical and System Software
|
$20.62
|
-0.91
-4.23% |
$21.74
|
627,049
95.85% of 50 DAV
50 DAV is 654,200
|
$21.69
-4.93%
|
3/27/2012
|
$19.35
|
PP = $20.00
|
|
MB = $21.00
|
Most Recent Note - 4/20/2012 1:32:08 PM
Y - Pulling back today following a considerable gain on the prior session with more than 2 times average that clinched a technical buy signal. Prior highs in the $20 area define initial support to watch on pullbacks.
>>> The latest Featured Stock Update with an annotated graph appeared on 4/3/2012. Click here.
View all notes |
Alert me of new notes |
CANSLIM.net Company Profile |
SEC |
Zacks Reports |
StockTalk |
News |
Chart |
Request a new note
C
A N
S L
I M
|
TPX
-
NYSE
Tempur Pedic Intl Inc
MANUFACTURING - Textile Manufacturing
|
$66.53
|
-17.22
-20.56% |
$70.32
|
14,965,081
1,145.17% of 50 DAV
50 DAV is 1,306,800
|
$87.43
-23.90%
|
4/19/2012
|
$84.83
|
PP = $86.71
|
|
MB = $91.05
|
Most Recent Note - 4/20/2012 10:11:04 AM
G - Damaging gap down today, violating its 50 DMA line and quickly testing its 200 DMA line. Color code is changed to green. Reported disappointing earnings Thursday evening after highlighted in the mid-day report in yellow with pivot point cited based on its 4/03/12 high plus 10 cents and noted - "A volume-driven gain above its pivot point is still necessary to trigger a buy signal." See the latest FSU analysis for additional details and a new annotated graph.
>>> The latest Featured Stock Update with an annotated graph appeared on 4/19/2012. Click here.
View all notes |
Alert me of new notes |
CANSLIM.net Company Profile |
SEC |
Zacks Reports |
StockTalk |
News |
Chart |
Request a new note
C
A N
S L
I M
|
TSCO
-
NASDAQ
Tractor Supply Co
SPECIALTY RETAIL - Specialty Retail, Other
|
$99.46
|
+0.58
0.59% |
$99.94
|
520,332
70.81% of 50 DAV
50 DAV is 734,800
|
$101.20
-1.72%
|
1/12/2012
|
$79.12
|
PP = $75.58
|
|
MB = $79.36
|
Most Recent Note - 4/19/2012 12:51:08 PM
G - Inching up for another new all-time high today, very extended from its prior base. Its 50 DMA line defines support to watch on pullbacks.
>>> The latest Featured Stock Update with an annotated graph appeared on 4/17/2012. Click here.
View all notes |
Alert me of new notes |
CANSLIM.net Company Profile |
SEC |
Zacks Reports |
StockTalk |
News |
Chart |
Request a new note
C
A N
S L
I M
|
UA
-
NYSE
Under Armour Inc Cl A
CONSUMER NON-DURABLES - Textile - Apparel Clothing
|
$101.53
|
+5.03
5.21% |
$102.86
|
3,869,595
425.42% of 50 DAV
50 DAV is 909,600
|
$99.35
2.20%
|
2/15/2012
|
$85.77
|
PP = $84.86
|
|
MB = $89.10
|
Most Recent Note - 4/20/2012 12:37:49 PM
G - Reported earnings +22% on +23% sales revenues for the quarter ended March 31, 2012 versus the year ago period, its first quarterly earnings increase below the +25% minimum guideline in more than 2 years. No new pivot point is cited due to concerns over the weaker fundamentals, however, no overhead supply remains to act as resistance while today's volume-driven gain has it hitting new 52-week and all-time highs, technically rallying from a new orderly base pattern well above its 50 DMA line and prior highs.
>>> The latest Featured Stock Update with an annotated graph appeared on 4/4/2012. Click here.
View all notes |
Alert me of new notes |
CANSLIM.net Company Profile |
SEC |
Zacks Reports |
StockTalk |
News |
Chart |
Request a new note
C
A N
S L
I M
|
Symbol/Exchange
Company Name
Industry Group |
PRICE |
CHANGE
(%Change) |
Day High |
Volume
(% DAV)
(% 50 day avg vol) |
52 Wk Hi
% From Hi |
Featured
Date |
Price
Featured |
Pivot Featured |
|
Max Buy |
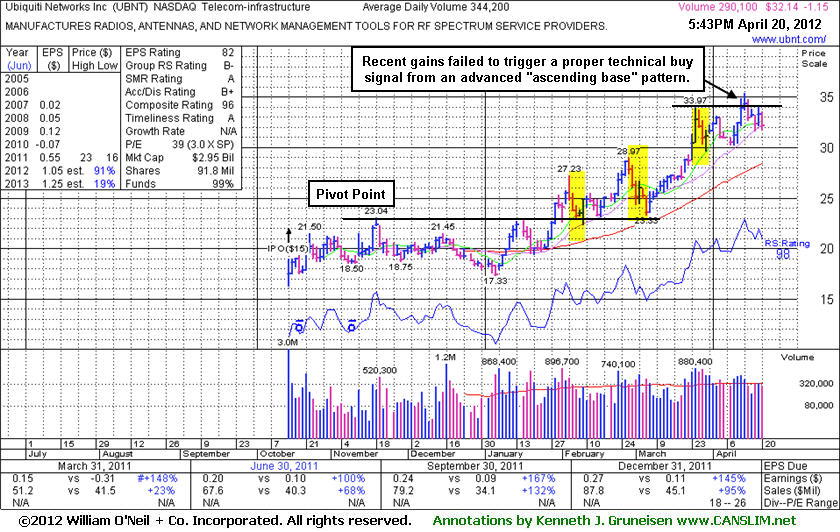
UBNT
-
NASDAQ
Ubiquiti Networks Inc
TELECOMMUNICATIONS - Diversified Communication Serv
|
$32.14
|
-1.15
-3.45% |
$33.50
|
290,582
84.42% of 50 DAV
50 DAV is 344,200
|
$35.32
-9.00%
|
4/12/2012
|
$33.89
|
PP = $34.07
|
|
MB = $35.77
|
Most Recent Note - 4/20/2012 6:01:58 PM
Y - Pulling back from an all-time high hit last week. Formed an advanced "ascending base" pattern marked by 3 pullbacks of 10-20% following its previous breakout. See the latest FSU analysis for more details and a new annotated graph.
>>> The latest Featured Stock Update with an annotated graph appeared on 4/20/2012. Click here.
View all notes |
Alert me of new notes |
CANSLIM.net Company Profile |
SEC |
Zacks Reports |
StockTalk |
News |
Chart |
Request a new note
C
A N
S L
I M
|
ULTA
-
NASDAQ
Ulta Salon Cosm & Frag
SPECIALTY RETAIL - Specialty Retail, Other
|
$95.35
|
+0.86
0.91% |
$96.04
|
376,260
55.76% of 50 DAV
50 DAV is 674,800
|
$96.65
-1.35%
|
1/11/2012
|
$71.97
|
PP = $75.80
|
|
MB = $79.59
|
Most Recent Note - 4/20/2012 2:00:51 PM
G - Its consolidation in a tight range at all-time highs may be considered a riskier late-stage base forming, such as an advanced "3-weeks tight" pattern, but no new pivot point is being cited. It has not spent much time basing since its last "Featured Date" when highlighted in yellow on 1/11/12. Its 50 DMA line defines support to watch well above its prior highs in the $75 area.
>>> The latest Featured Stock Update with an annotated graph appeared on 2/28/2012. Click here.
View all notes |
Alert me of new notes |
CANSLIM.net Company Profile |
SEC |
Zacks Reports |
StockTalk |
News |
Chart |
Request a new note
C
A N
S L
I M
|
V
-
NYSE
Visa Inc Cl A
DIVERSIFIED SERVICES - Business/Management Services
|
$121.01
|
-0.18
-0.15% |
$122.15
|
1,960,215
56.59% of 50 DAV
50 DAV is 3,463,900
|
$123.68
-2.16%
|
3/12/2012
|
$116.53
|
PP = $119.46
|
|
MB = $125.43
|
Most Recent Note - 4/20/2012 2:02:55 PM
Y - Volume totals have been cooling this week while it has been holding its ground. Its 4/13/12 gain backed by +49% above average volume technically confirmed a buy signal. Its 50 DMA line defines support to watch well above prior highs in the $103-104 area.
>>> The latest Featured Stock Update with an annotated graph appeared on 3/7/2012. Click here.
View all notes |
Alert me of new notes |
CANSLIM.net Company Profile |
SEC |
Zacks Reports |
StockTalk |
News |
Chart |
Request a new note
C
A N
S L
I M
|
VMW
-
NYSE
Vmware Inc Cl A
COMPUTER SOFTWARE andamp; SERVICES - Technical andamp; System Software
|
$111.24
|
-2.51
-2.21% |
$115.00
|
1,798,244
119.05% of 50 DAV
50 DAV is 1,510,500
|
$118.79
-6.36%
|
4/18/2012
|
$110.04
|
PP = $115.29
|
|
MB = $121.05
|
Most Recent Note - 4/19/2012 12:59:52 PM
Y - Gapped up today and hit a new 52-week high after reporting +38% earnings on +25% sales revenues for the quarter ended March 31, 2012 versus the year ago period. Featured in the 4/18/12 mid-day report (read here) in yellow with a pivot point cited based on its 52-week high plus 10 cents after a few very tight closes on its weekly chart while also finding support at its 10-week moving average. See the latest FSU analysis for more details and a new annotated weekly graph.
>>> The latest Featured Stock Update with an annotated graph appeared on 4/18/2012. Click here.
View all notes |
Alert me of new notes |
CANSLIM.net Company Profile |
SEC |
Zacks Reports |
StockTalk |
News |
Chart |
Request a new note
C
A N
S L
I M
|