You are not logged in.
This means you
CAN ONLY VIEW reports that were published prior to Tuesday, July 9, 2024.
You
MUST UPGRADE YOUR MEMBERSHIP if you want to see any current reports.
AFTER MARKET UPDATE - MONDAY, APRIL 22ND, 2024
Previous After Market Report Next After Market Report >>>
|
|
|
|
DOW |
+253.58 |
38,239.98 |
+0.67% |
|
Volume |
939,483,781 |
-12% |
|
Volume |
4,792,822,700 |
-11% |
|
NASDAQ |
+169.30 |
15,451.31 |
+1.11% |
|
Advancers |
2,036 |
74% |
|
Advancers |
2,673 |
64% |
|
S&P 500 |
+43.37 |
5,010.60 |
+0.87% |
|
Decliners |
721 |
26% |
|
Decliners |
1,532 |
36% |
|
Russell 2000 |
+19.82 |
1,967.47 |
+1.02% |
|
52 Wk Highs |
27 |
|
|
52 Wk Highs |
37 |
|
|
S&P 600 |
+10.27 |
1,264.07 |
+0.82% |
|
52 Wk Lows |
44 |
|
|
52 Wk Lows |
185 |
|
|
Continued distributional action has been repeatedly noted here since Wednesday April 10th as it signaled a shift in (M criteria) conditions from an "uptrend under pressure" to a market "correction". Use greater caution, raise cash and reduce exposure by selling any weakening stocks on a case-by-case basis.
|
 |
Major Indices Rose With Just a Small Bit More Leadership
Kenneth J. Gruneisen - Passed the CAN SLIM® Master's Exam
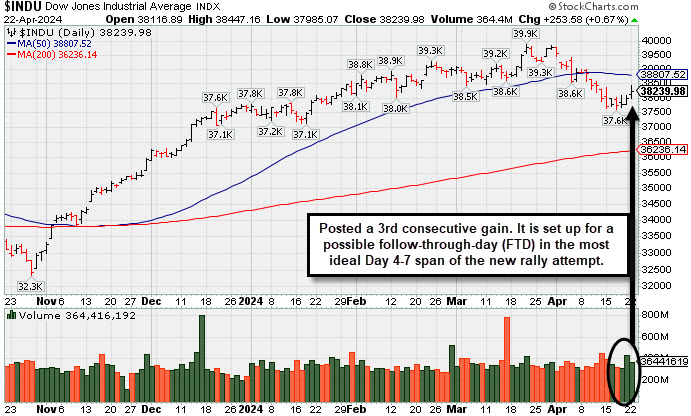
Major Indices posted unanimous gains on Monday, but only the Dow Jones Industrial Average is now poised for a possible follow-through day to confirm a new market uptrend under the fact-based investment system. Volume reported was lighter than the prior session total on the NYSE and on the Nasdaq exchange. Breadth was positive as advancers led decliners by almost a 3-1 margin on the NYSE and by a 5-3 margin on the Nasdaq exchange. There were 15 high-ranked companies from the Leaders List that hit new 52-week highs and were listed on the BreakOuts Page versus 5 on the prior session. New 52-week lows totals still outnumbered thin new 52-week highs totals on the NYSE and on the Nasdaq exchange. The major indices have shown distributional action indicative of a market correction (M criteria). Greater caution is important for all investors. Always stand ready to protect against losses.
PICTURED: The Dow Jones Industrial Average posted a 3rd consecutive gain. That leaves it set up for a possible follow-through-day during the most ideal Day 4-7 window of the rally attempt. Meanwhile, Monday marked Day 1 gains for the Nasdaq Composite and the S&P 500 Index.
Following last week's solid declines the market showed resilience and the major indices rose. EV price cuts caused Tesla (TSLA -3.40%) to sink, meanwhile Alphabet (GOOG +1.43%) and other large caps rose. By the end of the week, nearly 40% of the S&P 500 will report earnings. TSLA reports after the close on Tuesday, META reports after the close on Wednesday, MSFT and GOOG report after the close on Thursday.
All 11 S&P 500 sectors closed higher. The two weightiest sectors in the S&P 500 information technology (+1.3%) and financials (+1.2%) posted influential gains. Bank stocks also outperformed the broader market, and the financial sector is an importan tleading indicator for the broader market outlook. The 10-yr note yield settled one basis point higher at 4.62% and the 2-yr note yield settled unchanged from Friday at 4.97%.
This week's fresh economic releases include the Advance Q1 GDP report on Thursday and the core-PCE Price Index on Friday, the latter of which is the Fed's preferred inflation gauge.
|
 Kenneth J. Gruneisen started out as a licensed stockbroker in August 1987, a couple of months prior to the historic stock market crash that took the Dow Jones Industrial Average down -22.6% in a single day. He has published daily fact-based fundamental and technical analysis on high-ranked stocks online for two decades. Through FACTBASEDINVESTING.COM, Kenneth provides educational articles, news, market commentary, and other information regarding proven investment systems that work in good times and bad.
Comments contained in the body of this report are technical opinions only and are not necessarily those of Gruneisen Growth Corp. The material herein has been obtained from sources believed to be reliable and accurate, however, its accuracy and completeness cannot be guaranteed. Our firm, employees, and customers may effect transactions, including transactions contrary to any recommendation herein, or have positions in the securities mentioned herein or options with respect thereto. Any recommendation contained in this report may not be suitable for all investors and it is not to be deemed an offer or solicitation on our part with respect to the purchase or sale of any securities. |
|
 |
Tech, Retail, and Financial Groups Rose
Kenneth J. Gruneisen - Passed the CAN SLIM® Master's Exam
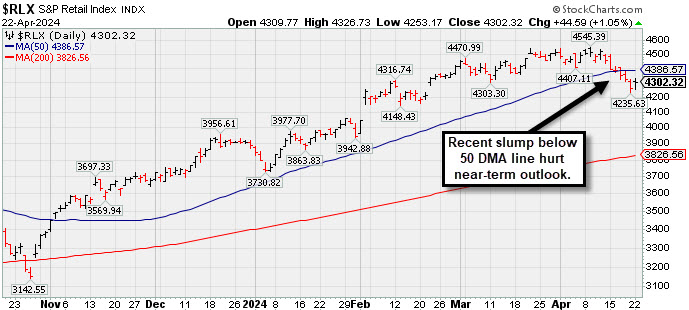
The Bank Index ($BKX +2.00%) outpaced the Broker/Dealer Index ($XBD +1.34%) as both financial indexes posted influential gains. The Retail Index ($RLX +1.05%) also had a positive impact on the major indices. The tech sector clearly had a positive bias as the Semiconductor Index ($SOX +1.74%), Networking Index ($NWX +0.85%), and the Biotech Index ($BTK +0.93%) each rose. The Gold & Silver Index ($XAU -3.68%) was a standout decliner while the Oil Services Index ($OSX -0.07%) ended sligyhtly in then red and the Integrated Oil Index ($XOI +0.84%) posted a modest gain.
![]() PICTURED: The Retail Index ($RLX +1.05%) recently slumped below its 50-day moving average (DMA) line during a streak of 6 consecutive losses. The retail index is an important market indictor because about 2/3 of the U.S. economy is driven by consumer spending. Near-term resilience would bode well for the market outlook, but further weakness would raise more serious concerns.
| Oil Services |
$OSX |
87.68 |
-0.06 |
-0.07% |
+4.53% |
| Integrated Oil |
$XOI |
2,176.62 |
+18.14 |
+0.84% |
+16.87% |
| Semiconductor |
$SOX |
4,381.92 |
+75.05 |
+1.74% |
+4.94% |
| Networking |
$NWX |
732.28 |
+6.20 |
+0.85% |
-12.07% |
| Broker/Dealer |
$XBD |
587.14 |
+7.78 |
+1.34% |
+5.36% |
| Retail |
$RLX |
4,302.32 |
+44.59 |
+1.05% |
+10.63% |
| Gold & Silver |
$XAU |
131.01 |
-5.00 |
-3.68% |
+4.23% |
| Bank |
$BKX |
102.08 |
+2.01 |
+2.00% |
+6.31% |
| Biotech |
$BTK |
4,911.03 |
+45.37 |
+0.93% |
-9.37% |
|
|
|
 |
Prior Highs Define Important Near-Term Support
Kenneth J. Gruneisen - Passed the CAN SLIM® Master's Exam
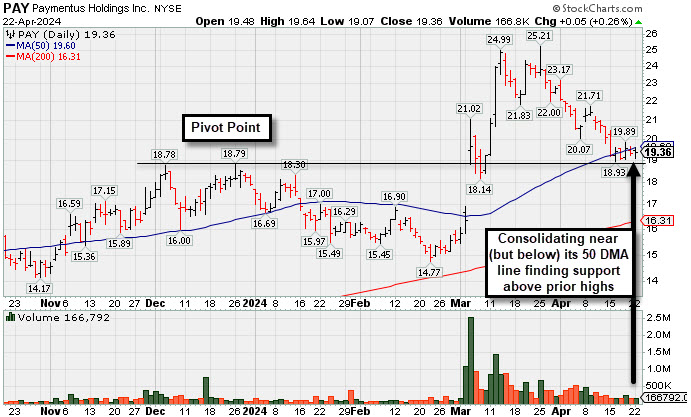
Paymentus Holdings (PAY +$0.05 or +0.26% to $19.36) has still been lingering near its 50-day moving average (DMA) line which defines important near-term support above prior highs in the $18 range. More damaging losses would raise greater concerns.
PAY has a 96 Earnings Per Share Rating. It reported Dec '23 quarterly earnings +175% on +25% sales revenues versus the year-ago period, its 3rd strong quarterly comparison well above the +25% minimum earnings guideline (C criteria). Its annual earnings history (A criteria) has been strong since its $21 IPO in May '21.
The number of top-rated funds owning its shares rose from 79 in Mar '23 to 115 in Dec '23, a reassuring sign concerning the I criteria. Its small supply of only 17.2 million shares in the public float (S criteria) can contribute to greater price volatility in the event of institutional buying or selling.
Chart courtesy of www.stockcharts.com
 Symbol/Exchange
Company Name
Industry Group | PRICE | CHANGE
(%Change) | Day High | Volume
(% DAV)
(% 50 day avg vol) | 52 Wk Hi
% From Hi | Featured
Date | Price
Featured | Pivot Featured | | Max Buy |  NVO - NYSE NVO - NYSE
Novo Nordisk ADR
Medical-Ethical Drugs | $125.26 | +2.55
2.08% | $126.25 | 3,798,340
78.49% of 50 DAV
50 DAV is 4,839,000 | $138.28
-9.42%
| 3/1/2024 | $124.23 | PP = $124.97 | | MB = $131.22 |  Most Recent Note - 4/22/2024 11:36:58 PM Most Recent Note - 4/22/2024 11:36:58 PM
G - Consolidating just below its 50 DMA line ($126) which may now act as resistance. A rebound above the 50 DMA line is needed for its outlook to improve.
>>> FEATURED STOCK ARTICLE : Volume Cools While Consolidating Above 50-Day Moving Average Line - 4/3/2024 | View all notes | Set NEW NOTE alert | Company Profile | SEC News | Chart | Request a new note C A S I | AXON - NASDAQ
Axon Enterprise
Security/Sfty | $293.80 | +0.20
0.07% | $296.88 | 513,484
98.94% of 50 DAV
50 DAV is 519,000 | $329.87
-10.93%
| 4/5/2024 | $309.90 | PP = $325.73 | | MB = $342.02 | Most Recent Note - 4/17/2024 3:43:19 PM
Y - Testing its 50 DMA line ($298.68) today after 3 consecutive losses. Color code was changed to yellow with new pivot point cited based on its 3/04/24 high plus 10 cents. A gain above the pivot point backed by at least +40% above average volume is needed to trigger a proper technical buy signal. Fundamentals remain strong.
>>> FEATURED STOCK ARTICLE : Volume Totals Cooling While Building a New Base - 4/8/2024 | View all notes | Set NEW NOTE alert | Company Profile | SEC News | Chart | Request a new note C A S I | TDG - NYSE
TransDigm Group
Aerospace/Defense | $1,200.93 | +13.23
1.11% | $1,213.66 | 147,923
72.87% of 50 DAV
50 DAV is 203,000 | $1,248.39
-3.80%
| 4/12/2024 | $1,224.21 | PP = $1,246.32 | | MB = $1,308.64 | Most Recent Note - 4/17/2024 4:03:56 PM
Y - Color code is changed to yellow after holding its ground in a tight range near its all-time high. New pivot point was cited based on its 4/04/24 high plus 10 cents. Subsequent gains above the pivot point backed by at least +40% above average volume are needed to trigger a proper new technical buy signal. Its 50 DMA line ($1,187) defines near-term support to watch.
>>> FEATURED STOCK ARTICLE : Volume Totals Cooling While Perched Near High - 4/9/2024 | View all notes | Set NEW NOTE alert | Company Profile | SEC News | Chart | Request a new note C A S I | PCAR - NASDAQ
Paccar
Trucks and Parts-Hvy Duty | $112.58 | +1.39
1.25% | $113.69 | 2,021,362
89.92% of 50 DAV
50 DAV is 2,248,000 | $125.50
-10.29%
| 1/23/2024 | $100.35 | PP = $98.57 | | MB = $103.50 | Most Recent Note - 4/19/2024 12:06:30 PM
G - Violated its 50 DMA line ($115) this week triggering a technical sell signal and it is on track today for a 6th consecutive loss. A prompt rebound above the 50 DMA line is needed for its outlook to improve. Fundamentals remain strong.
>>> FEATURED STOCK ARTICLE : Pulling Back From High and Slumping Toward 50-Day Moving Average - 4/12/2024 | View all notes | Set NEW NOTE alert | Company Profile | SEC News | Chart | Request a new note C A S I | HUBB - NYSE
Hubbell
Electrical-Power/Equipmt | $390.56 | +2.53
0.65% | $393.68 | 391,009
97.51% of 50 DAV
50 DAV is 401,000 | $429.61
-9.09%
| 1/30/2024 | $343.26 | PP = $336.83 | | MB = $353.67 | Most Recent Note - 4/19/2024 6:40:48 PM
G - Closed below its 50 DMA line ($390) with a loss today on near-average volume raising concerns. Slumped for 8 losses in the span of 10 sessions after a noted "negative reversal" at its all-time high on 4/04/24. See the latest FSU analysis for more details and a new annotated graph.
>>> FEATURED STOCK ARTICLE : Closed Just Below 50-Day Moving Average With Quiet Loss - 4/19/2024 | View all notes | Set NEW NOTE alert | Company Profile | SEC News | Chart | Request a new note C A S I | Symbol/Exchange
Company Name
Industry Group | PRICE | CHANGE
(%Change) | Day High | Volume
(% DAV)
(% 50 day avg vol) | 52 Wk Hi
% From Hi | Featured
Date | Price
Featured | Pivot Featured | | Max Buy | USLM - NASDAQ
U.S. Lime & Minerals
Bldg-Cement/Concrt/Ag | $300.36 | +3.60
1.21% | $303.08 | 18,428
80.12% of 50 DAV
50 DAV is 23,000 | $308.00
-2.48%
| 2/9/2024 | $254.68 | PP = $265.09 | | MB = $278.34 | Most Recent Note - 4/17/2024 4:04:26 PM
G - Still hovering in a tight range in recent weeks near its all-time high, stubbornly holding its ground despite encountering some distributional pressure. Its 50 DMA line ($279) defines near-term support to watch.
>>> FEATURED STOCK ARTICLE : Gain With Light Volume for Best Ever Close - 4/5/2024 | View all notes | Set NEW NOTE alert | Company Profile | SEC News | Chart | Request a new note C A S I | PAY - NYSE
Paymentus Holdings
Finance-CrdtCard/PmtPr | $19.36 | +0.05
0.26% | $19.64 | 166,792
42.66% of 50 DAV
50 DAV is 391,000 | $25.21
-23.21%
| 3/5/2024 | $19.97 | PP = $18.89 | | MB = $19.83 | Most Recent Note - 4/22/2024 11:35:27 PM
G - Still lingering near its 50 DMA line ($19.60) which defines important near-term support above prior highs in the $18 range. More damaging losses would raise greater concerns. See the latest FSU analysis for more details and a new annotated graph.
>>> FEATURED STOCK ARTICLE : Prior Highs Define Important Near-Term Support - 4/22/2024 | View all notes | Set NEW NOTE alert | Company Profile | SEC News | Chart | Request a new note C A S I | HUBS - NYSE
HubSpot
Comp Sftwr-Spec Enterprs | $633.04 | +1.80
0.29% | $641.55 | 511,528
94.55% of 50 DAV
50 DAV is 541,000 | $693.85
-8.76%
| 4/4/2024 | $686.66 | PP = $660.10 | | MB = $693.11 | Most Recent Note - 4/19/2024 6:42:23 PM
Y - Pulled back today testing its 50 DMA line ($625) with a loss on +52% above-average volume. Stalled after highlighted yellow in the 4/04/24 mid-day report with pivot point cited based on its 2/09/24 high plus 10 cents. Initial support is at its prior highs and its 50 DMA line ($626). Fundamentals remain strong. Faces some resistance due to old overhead supply up to the $866 level.
>>> FEATURED STOCK ARTICLE : Encountered Distributional Pressure and Finished Below Pivot Point - 4/4/2024 | View all notes | Set NEW NOTE alert | Company Profile | SEC News | Chart | Request a new note C A S I |
|
|
|
Color Codes Explained :
Y - Better candidates highlighted by our
staff of experts.
G - Previously featured
in past reports as yellow but may no longer be buyable under the
guidelines.
***Last / Change / Volume data in this table is the closing quote data***
|
|
|
THESE ARE NOT BUY RECOMMENDATIONS!
Comments contained in the body of this report are technical
opinions only. The material herein has been obtained
from sources believed to be reliable and accurate, however,
its accuracy and completeness cannot be guaranteed.
This site is not an investment advisor, hence it does
not endorse or recommend any securities or other investments.
Any recommendation contained in this report may not
be suitable for all investors and it is not to be deemed
an offer or solicitation on our part with respect to
the purchase or sale of any securities. All trademarks,
service marks and trade names appearing in this report
are the property of their respective owners, and are
likewise used for identification purposes only.
This report is a service available
only to active Paid Premium Members.
You may opt-out of receiving report notifications
at any time. Questions or comments may be submitted
by writing to Premium Membership Services 665 S.E. 10 Street, Suite 201 Deerfield Beach, FL 33441-5634 or by calling 1-800-965-8307
or 954-785-1121.
|
|
|