You are not logged in.
This means you
CAN ONLY VIEW reports that were published prior to Monday, April 14, 2025.
You
MUST UPGRADE YOUR MEMBERSHIP if you want to see any current reports.
AFTER MARKET UPDATE - THURSDAY, APRIL 22ND, 2010
Previous After Market Report Next After Market Report >>>
|
|
|
|
DOW |
+9.37 |
11,134.29 |
+0.08% |
|
Volume |
1,288,216,990 |
+7% |
|
Volume |
2,840,105,110 |
+7% |
|
NASDAQ |
+14.46 |
2,519.07 |
+0.58% |
|
Advancers |
2,014 |
64% |
|
Advancers |
1,685 |
59% |
|
S&P 500 |
+2.73 |
1,208.67 |
+0.23% |
|
Decliners |
1,050 |
33% |
|
Decliners |
1,019 |
36% |
|
Russell 2000 |
+8.12 |
734.31 |
+1.12% |
|
52 Wk Highs |
451 |
|
|
52 Wk Highs |
314 |
|
|
S&P 600 |
+4.62 |
390.71 |
+1.20% |
|
52 Wk Lows |
11 |
|
|
52 Wk Lows |
13 |
|
|
 |
Major Indices Finished Session Strong After Earlier Weakness
Adam Sarhan, Contributing Writer,
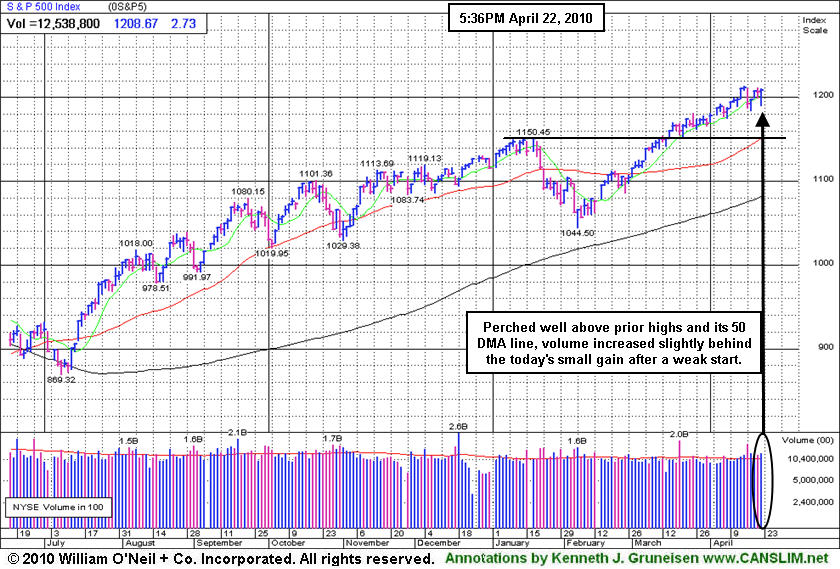
The major averages shook off earlier weakness and turned positive after President Obama outlined his plan to overhaul the financial system. Greek concerns swelled. Volume, an important indicator of institutional sponsorship, rose compared to Wednesday's totals. The expansion in volume behind the gains indicated that institutional investors were buying stocks (accumulating, as opposed to distributing/selling) while advancers led decliners by a 2-to-1 ratio on the NYSE and by a 3-to-2 ratio on the Nasdaq exchange. New 52-week highs again easily trumped new lows on both exchanges. There were 70 high-ranked companies from the CANSLIM.net Leaders List that made a new 52-week high and appeared on the CANSLIM.net BreakOuts Page, higher than the 54 issues that appeared on the prior session. A healthy crop of new leaders making new highs bodes well for any market rally.
The European Union said that Greece’s deficit was a stunning +13.6% of gross domestic product in 2009 which topped analysts estimates for a +12.9% reading. In addition, Ireland surpassed Greece as the EU nation with the largest deficit. It's deficit was revised up to +14.3%. Initially, this sent stocks plunging as investors were concerned that the EU and the IMF will have to bailout more nations. However, their fears were allayed after President Obama gave a speech in lower Manhattan which outlined his plan to over hall the financial system.
News was mixed on the earnings front, shares of Ebay Inc (EBAY -5.74%), Qualcomm Inc. (QCOM -7.74%), Nokia (NOK -13.11%) and Credit Suisse Group (CS -4.06%) all gapped down after reporting lackluster results. Meanwhile, shares of fast food chain Chipotle Mexican Grill (CMG +14.18%) and Isilon Systems (ISLN +22.77%) surged after reporting stellar results. After Thursday's close, shares of Amazon.com Inc. (AMZN -2.50%) and Microsoft Corp. (MSFT +0.19%) traded lower in after-hours trading after reporting their latest quarterly results while shares of American Express (AXP +1.70%) jumped in after hours after their latest quarterly report was released.
Professional Money Management Services- Inquire Today!
Our skilled team of portfolio managers knows how to follow the rules of this fact-based investment system. If your portfolio is greater than $100,000 and you would like a free portfolio review, click here to get connected with one of our portfolio managers. ** Serious inquires only, please.
PICTURED: The benchmark S&P 500 Index is perched well above prior highs and its 50-day moving average (DMA) line. Volume increased slightly behind the today's small gain after an initially weak start - and such action is typical of bull markets.
|
|
|
 |
Retail Index Roars Higher; Biotech Index Consolidating Near 50 DMA
Kenneth J. Gruneisen - Passed the CAN SLIM® Master's Exam
The Retail Index ($RLX +2.12%) was among Thursday's standout gainers rallying to new recovery highs and still underpinning the major averages' advance. Financial shares also worked their way higher again as the Broker/Dealer Index ($XBD +0.49%) and Bank Index ($BKX +0.80%) had a positive influence. The Gold & Silver Index ($XAU +1.15%) and Oil Services Index ($OSX +1.45%) posted solid gains while the Integrated Oil Index ($XOI -0.51%) and Healthcare Index ($HMO -0.30%) edged lower. The Semiconductor Index ($SOX +1.92%) was a standout leaders among the tech sector indices, meanwhile the Internet Index ($IIX +0.54%) posted a small gain and the Networking Index ($NWX -0.15%) edged lower.
Charts courtesy www.stockcharts.com
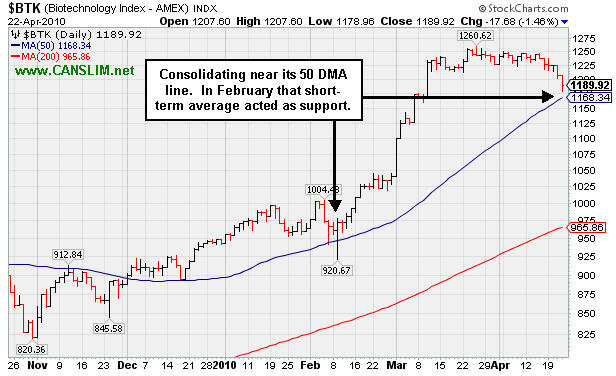
PICTURED: The Biotechnology Index ($BTK -1.43%) is consolidating near its 50-day moving average (DMA) line. In February that short-term average acted as support.
| Oil Services |
$OSX |
221.13 |
+3.15 |
+1.45% |
+13.45% |
| Healthcare |
$HMO |
1,536.80 |
-4.66 |
-0.30% |
+4.34% |
| Integrated Oil |
$XOI |
1,115.13 |
-5.77 |
-0.51% |
+4.39% |
| Semiconductor |
$SOX |
398.94 |
+7.52 |
+1.92% |
+10.84% |
| Networking |
$NWX |
272.78 |
-0.40 |
-0.15% |
+18.06% |
| Internet |
$IIX |
258.50 |
+1.36 |
+0.53% |
+10.54% |
| Broker/Dealer |
$XBD |
122.03 |
+0.58 |
+0.48% |
+6.07% |
| Retail |
$RLX |
491.96 |
+10.22 |
+2.12% |
+19.66% |
| Gold & Silver |
$XAU |
170.55 |
+1.94 |
+1.15% |
+1.37% |
| Bank |
$BKX |
57.73 |
+0.46 |
+0.80% |
+35.17% |
| Biotech |
$BTK |
1,189.91 |
-17.69 |
-1.46% |
+26.30% |
|
|
|
 |
Wedging Up For Another New High Close
Kenneth J. Gruneisen - Passed the CAN SLIM® Master's Exam
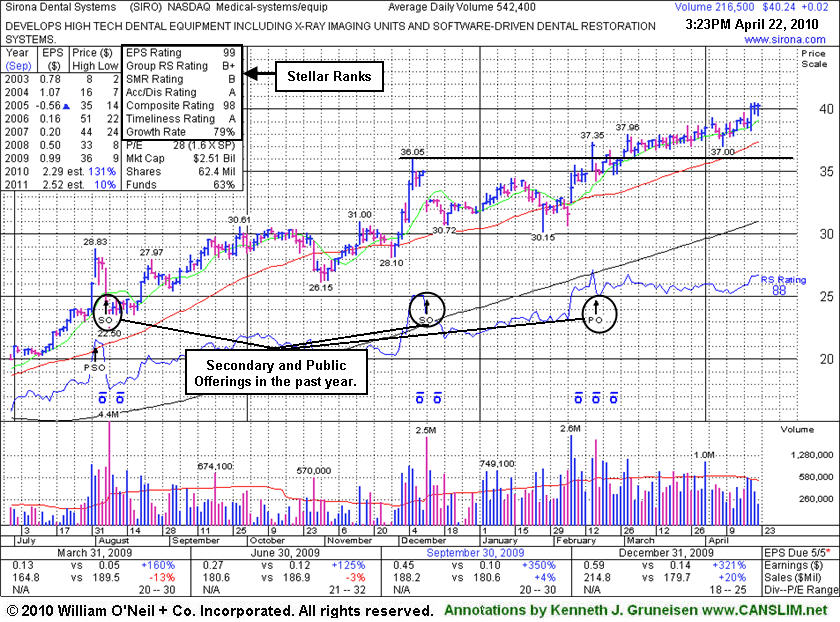
Sirona Dental Systems (SIRO +$0.20 or +0.50% to $40.42) has been wedging continually higher in recent weeks, and today it inched up for yet another new high close. It is not near a sound base now, and the company is scheduled to report results for the latests quarter before the market opens on May 5th. Prior chart highs and its 50-day moving average (DMA) line in the $36 area define important support to watch. It was featured in yellow in the 2/16/10 mid-day report (read here) as it broke out from a 10-week flat base.
Fundamentally, following 3 negative comparisons, its sales revenues in the Sep and Dec '09 quarters showed a return to growth. Quarterly earnings increases have been very strong along with great annual earnings growth in recent years (good C and A criteria). As it has rallied from January 2009 lows near $10, clearly it has been able to get help from underwriters as this high-ranked Medical - Systems/Equipment firm completed Secondary Offerings on 8/06/09 and 12/11/09, and yet another Public Offering on 2/17/10. The number of top-rated funds owning its shares rose from 55 in Mar '09 to 94 in Mar '10, which is nice reassurance with respect to the I criteria of the investment system. Companies often attract new institutional investors with the help of underwriters, but offerings often have the near-term effect of hindering upward price progress. Company management reportedly still owns a 70% interest in the company's shares even after those offerings, keeping them very motivated to maintain and build shareholder value.
|
|
|
Color Codes Explained :
Y - Better candidates highlighted by our
staff of experts.
G - Previously featured
in past reports as yellow but may no longer be buyable under the
guidelines.
***Last / Change / Volume quote data in this table corresponds with the timestamp on the note***
Symbol/Exchange
Company Name
Industry Group |
Last |
Chg. |
Vol
% DAV |
Date Featured |
Price Featured |
Latest Pivot Point
Featured |
Status |
| Latest Max Buy Price |
ARUN
- NASDAQ
Aruba Networks Inc
COMPUTER HARDWARE - Networking & Communication Dev
|
$13.43
|
+0.25
|
1,580,229
98% DAV
1,618,700
|
2/19/2010
(Date
Featured) |
$12.71
(Price
Featured) |
PP = $11.94 |
G |
| MB = $12.54 |
Most Recent Note - 4/22/2010 4:09:57 PM
G - Gapped down today, then overcame early weakness for a "positive reversal" and closed near the session high. It found prompt support on 4/19/10 after early lows near previously noted support levels to watch - its 50 DMA line and recent chart low $12.21 on 3/19/10.
>>> The latest Featured Stock Update with an annotated graph appeared on 3/31/2010. click here.
|
|
C
A
S
I |
News |
Chart |
SEC
View all notes Alert
me of new notes
Company
Profile
|
BIDU
- NASDAQ
Baidu Inc Ads
INTERNET - Internet Information Providers
|
$640.04
|
+10.07
|
821,740
51% DAV
1,615,100
|
1/13/2010
(Date
Featured) |
$431.25
(Price
Featured) |
PP = $426.75 |
G |
| MB = $448.09 |
Most Recent Note - 4/22/2010 4:11:58 PM
G - Small gain on light volume today for its second best close ever. Repeatedly noted as extended from any sound base after 11 consecutive weekly gains, however it could produce more climactic gains, especially due to the small supply (S criteria) of shares outstanding. Earnings news is due on Wednesday, 4/28/10.
>>> The latest Featured Stock Update with an annotated graph appeared on 4/20/2010. click here.
|
|
C
A
S
I |
News |
Chart |
SEC
View all notes Alert
me of new notes
Company
Profile
|
BPI
- NYSE
Bridgepoint Education
DIVERSIFIED SERVICES - Education &; Training Services
|
$25.72
|
-1.56
|
464,128
109% DAV
427,100
|
4/13/2010
(Date
Featured) |
$25.59
(Price
Featured) |
PP = $25.76 |
Y |
| MB = $27.05 |
Most Recent Note - 4/22/2010 4:15:12 PM
Y- Pulled back near its pivot point today from an all-time high with near average volume behind a considerable loss. Color code was changed to yellow based on the normal pullback, however subsequent losses leading to a close back in its prior base would raise concerns. Featured in yellow in the 4/13/10 mid-day report (read here), when it triggered a new technical buy signal as it rose from a cup-with-high-handle
>>> The latest Featured Stock Update with an annotated graph appeared on 4/13/2010. click here.
|
|
C
A
S
I |
News |
Chart |
SEC
View all notes Alert
me of new notes
Company
Profile
|
BRLI
- NASDAQ
Bio Reference Labs Inc
HEALTH SERVICES - Medical Laboratories & Researc
|
$24.63
|
+0.64
|
255,145
265% DAV
96,200
|
2/12/2010
(Date
Featured) |
$39.02
(Price
Featured) |
PP = $20.49 |
G |
| MB = $21.51 |
Most Recent Note - 4/22/2010 4:24:46 PM
G - Hit a new all-time high today and closed strong with its 12th consecutive gain, steadily rising from a brief consolidation above its 50 DMA line. Do not be confused by 2:1 stock split impacting share prices today (PP and MB prices associated with the latest 2/12/10 Featured Date have been adjusted accordingly). Prior chart highs may be an initial support level to watch above its 50 DMA line.
>>> The latest Featured Stock Update with an annotated graph appeared on 4/16/2010. click here.
|
|
C
A
S
I |
News |
Chart |
SEC
View all notes Alert
me of new notes
Company
Profile
|
CISG
- NASDAQ
Cninsure Inc Ads
INSURANCE - Insurance Brokers
|
$27.17
|
-0.01
|
103,752
41% DAV
253,600
|
3/3/2010
(Date
Featured) |
$24.38
(Price
Featured) |
PP = $23.10 |
G |
| MB = $24.26 |
Most Recent Note - 4/22/2010 4:26:26 PM
G - Held its ground today, and its rally back was an encouraging sign of prompt support after a loss on 4/16/10 with 3 times average volume was indicative of heavy distributional pressure. The 50 DMA line and recent low ($24.77 on 4/19/10) define important support now. CISG traded up as much as +17.4% since featured in yellow in the 3/03/10 mid-day report (read here).
>>> The latest Featured Stock Update with an annotated graph appeared on 4/19/2010. click here.
|
|
C
A
S
I |
News |
Chart |
SEC
View all notes Alert
me of new notes
Company
Profile
|
CRM
- NYSE
Salesforce.com Inc
INTERNET - Internet Software & Services
|
$88.70
|
+3.62
|
2,508,633
144% DAV
1,742,500
|
3/5/2010
(Date
Featured) |
$72.28
(Price
Featured) |
PP = $75.53 |
G |
| MB = $79.31 |
Most Recent Note - 4/22/2010 4:28:09 PM
G - Considerable gain on higher volume today for a new high close, yet getting very extended from prior chart highs and well above its "max buy" level. Volume totals were below the investment system guidelines as it rallied above its latest pivot point.
>>> The latest Featured Stock Update with an annotated graph appeared on 4/21/2010. click here.
|
|
C
A
S
I |
News |
Chart |
SEC
View all notes Alert
me of new notes
Company
Profile
|
CTRP
- NASDAQ
Ctrip.com Intl Ltd Adr
LEISURE - Resorts & Casinos
|
$38.06
|
+2.03
|
1,887,857
96% DAV
1,968,800
|
3/25/2010
(Date
Featured) |
$40.74
(Price
Featured) |
PP = $39.40 |
G |
| MB = $41.37 |
Most Recent Note - 4/22/2010 4:33:44 PM
G - Today's gain on average volume helped it rally back to close above its 50 DMA line, helping its outlook improve. Confirming gains with heavier volume would be reassuring. Continued weakness under its pivot point is a concern, however, as it has encountered ongoing distributional pressure since 3/25/10 when a detailed Stock Bulletin with annotated graph and expert analysis was published (read here).
>>> The latest Featured Stock Update with an annotated graph appeared on 4/12/2010. click here.
|
|
C
A
S
I |
News |
Chart |
SEC
View all notes Alert
me of new notes
Company
Profile
|
EZPW
- NASDAQ
Ezcorp Inc Cl A
SPECIALTY RETAIL - Specialty Retail, Other
|
$23.04
|
+0.38
|
573,051
112% DAV
513,300
|
4/14/2010
(Date
Featured) |
$21.80
(Price
Featured) |
PP = $22.29 |
Y |
| MB = $23.40 |
Most Recent Note - 4/22/2010 5:00:36 PM
Y - Posted a solid gain today for a new high close approaching its "max buy" level, then reported earnings news after the close. A considerable gain on 4/20/10 with +67% above average volume as it rallied above the pivot point triggered a technical buy signal. Rose from a 5-week flat base with no overhead supply to act as resistance for this high-ranked Finance - Consumer/Commercial Loans firm.
>>> The latest Featured Stock Update with an annotated graph appeared on 3/29/2010. click here.
|
|
C
A
S
I |
News |
Chart |
SEC
View all notes Alert
me of new notes
Company
Profile
|
GMCR
- NASDAQ
Green Mtn Coffee Roastrs
FOOD & BEVERAGE - Processed & Packaged Goods
|
$88.04
|
+4.14
|
2,057,556
182% DAV
1,131,000
|
2/26/2010
(Date
Featured) |
$84.39
(Price
Featured) |
PP = $88.75 |
G |
| MB = $93.19 |
Most Recent Note - 4/22/2010 5:03:55 PM
G - Considerable gain today ended a streak of 8 consecutive losses. It remains below its 50-day moving average (DMA) line, yet rebounded to close above its January high close after triggering damaging technical sell signals. Earnings news is due on 4/28/10. GMCR rallied more than 5-fold from its November '08 low.
>>> The latest Featured Stock Update with an annotated graph appeared on 4/5/2010. click here.
|
|
C
A
S
I |
News |
Chart |
SEC
View all notes Alert
me of new notes
Company
Profile
|
ISRG
- NASDAQ
Intuitive Surgical Inc
HEALTH SERVICES - Medical Appliances & Equipment
|
$368.73
|
+2.75
|
687,606
123% DAV
559,900
|
4/13/2010
(Date
Featured) |
$363.46
(Price
Featured) |
PP = $367.10 |
Y |
| MB = $385.46 |
Most Recent Note - 4/22/2010 5:10:13 PM
Y - Holding its ground stubbornly since its considerable loss with 4 times average volume on 4/16/10 after reporting earnings. Color code was changed to yellow based on its resilience leading to closes back above prior high closes, signs of support after heavy distribution. Any subsequent violation of its recent chart low or 50 DMA line could raise more serious concerns. ISRG was featured again in the 4/13/10 mid-day report (read here) with new pivot point cited based on its 3/03/10 high.
>>> The latest Featured Stock Update with an annotated graph appeared on 4/7/2010. click here.
|
|
C
A
S
I |
News |
Chart |
SEC
View all notes Alert
me of new notes
Company
Profile
|
LL
- NYSE
Lumber Liquidators Hldgs
RETAIL - Home Improvement Stores
|
$30.63
|
+0.69
|
661,313
178% DAV
371,400
|
4/22/2010
(Date
Featured) |
$29.87
(Price
Featured) |
PP = $29.03 |
Y |
| MB = $30.48 |
Most Recent Note - 4/22/2010 5:15:37 PM
Y - Closed strong today with +78% above average volume behind its gain meeting the guideline for a technical buy signal while it rallied slightly beyond its "max buy" level. In the mid-day report earlier it was featured in yellow (read here) as it was noted while rising from an orderly cup shaped pattern (without a proper handle) formed since last noted on 12/17/09. It rallied steadily after a "breakaway gap" on 8/05/09 helped it clear stubborn resistance in the $17 area. Quarterly sales and earnings increases have recently shown encouraging acceleration while growth rates have previously been noted as below the investment system's guidelines.
There are no Featured Stock Updates™ available for this stock at this time. You may request one by clicking here
|
|
C
A
S
I |
News |
Chart |
SEC
View all notes Alert
me of new notes
Company
Profile
|
LOPE
- NASDAQ
Grand Canyon Education
DIVERSIFIED SERVICES - Education &; Training Services
|
$26.66
|
-0.31
|
471,762
140% DAV
336,000
|
4/13/2010
(Date
Featured) |
$27.71
(Price
Featured) |
PP = $27.33 |
Y |
| MB = $28.70 |
Most Recent Note - 4/22/2010 5:19:43 PM
Y - Today it gapped down and slumped into its prior base intra-day, yet rebounded to close near its session high. The weakness below its pivot point raised concerns, yet it found some prompt support on the session and narrowly avoided a close below its old high close ($26.64 on 3/25/10). Featured in the 4/13/10 mid-day report (read here), its gain triggered a technical buy after an advanced "3-weeks tight" type pattern.
>>> The latest Featured Stock Update with an annotated graph appeared on 4/14/2010. click here.
|
|
C
A
S
I |
News |
Chart |
SEC
View all notes Alert
me of new notes
Company
Profile
|
PCLN
- NASDAQ
Priceline.com Inc
INTERNET - Internet Software & Services
|
$399.55
|
-4.72
|
584,812
N/A
|
11/1/2002
(Date
Featured) |
$399.55
(Price
Featured) |
PP = $428.20 |
Y |
| MB = $449.61 |
Most Recent Note - 1/2/2011
Y - Returns to Featured Stocks list with its appearance in the January 2011 CANSLIM.net News including detailed analysis and annotated daily and weekly graphs.
>>> The latest Featured Stock Update with an annotated graph appeared on 3/30/2010. click here.
|
|
C
A
S
I |
News |
Chart |
SEC
View all notes Alert
me of new notes
Company
Profile
|
PEGA
- NASDAQ
Pegasystems Inc
COMPUTER SOFTWARE & SERVICES - Business Software & Services
|
$39.29
|
+0.36
|
158,858
93% DAV
170,400
|
2/26/2010
(Date
Featured) |
$36.00
(Price
Featured) |
PP = $38.55 |
Y |
| MB = $40.48 |
Most Recent Note - 4/22/2010 5:25:00 PM
Y - Gain today with near average volume, finishing the session one cent off its best ever close. Hovering near all-time highs with volume totals cooling since its 3/15/10 breakout. A violation of its 50 DMA line or its recent low ($36.42 on 4/12/10) would raise concerns and trigger technical sell signals.
>>> The latest Featured Stock Update with an annotated graph appeared on 4/6/2010. click here.
|
|
C
A
S
I |
News |
Chart |
SEC
View all notes Alert
me of new notes
Company
Profile
|
ROVI
- NASDAQ
Rovi Corp
COMPUTER SOFTWARE & SERVICES - Security Software & Services
|
$38.47
|
+0.86
|
1,054,761
79% DAV
1,327,300
|
4/20/2010
(Date
Featured) |
$37.62
(Price
Featured) |
PP = $38.60 |
Y |
| MB = $40.53 |
Most Recent Note - 4/22/2010 5:28:07 PM
Y - Finished strong today with a gain for a new high close with below average volume. Its 50 DMA line and recent chart low ($35.91 on 4/08/10) define important support to watch. Color code was changed to yellow with new pivot point and "max buy" levels cited after forming a new flat base.
>>> The latest Featured Stock Update with an annotated graph appeared on 4/8/2010. click here.
|
|
C
A
S
I |
News |
Chart |
SEC
View all notes Alert
me of new notes
Company
Profile
|
SIRO
- NASDAQ
Sirona Dental Systems
HEALTH SERVICES - Medical Instruments & Supplies
|
$40.42
|
+0.20
|
260,295
44% DAV
588,200
|
2/16/2010
(Date
Featured) |
$36.43
(Price
Featured) |
PP = $36.15 |
G |
| MB = $37.96 |
Most Recent Note - 4/22/2010 5:29:01 PM
G - Wedging continually higher in recent weeks, today inched up for yet another new 52-week high. Prior chart highs and its 50 DMA line in the $36 area define an initial support level to watch.
>>> The latest Featured Stock Update with an annotated graph appeared on 4/22/2010. click here.
|
|
C
A
S
I |
News |
Chart |
SEC
View all notes Alert
me of new notes
Company
Profile
|
ULTA
- NASDAQ
Ulta Salon Cosm & Frag
SPECIALTY RETAIL - Specialty Retail, Other
|
$24.59
|
+1.41
|
602,482
154% DAV
391,300
|
3/12/2010
(Date
Featured) |
$22.81
(Price
Featured) |
PP = $21.72 |
G |
| MB = $22.81 |
Most Recent Note - 4/22/2010 5:31:25 PM
G - Posted a considerable confirming gain today for a new 52-week high with volume +53% above its average trading total. Prior chart highs and its 50 DMA line define support to watch in the $21 area. Featured earlier in a detailed Stock Bulletin and 3/12/10 mid-day report appearance.
>>> The latest Featured Stock Update with an annotated graph appeared on 4/1/2010. click here.
|
|
C
A
S
I |
News |
Chart |
SEC
View all notes Alert
me of new notes
Company
Profile
|
VIT
-
|
$25.50
|
-0.06
|
247,529
38% DAV
648,500
|
4/9/2010
(Date
Featured) |
$23.79
(Price
Featured) |
PP = $23.95 |
G |
| MB = $25.15 |
Most Recent Note - 4/22/2010 5:33:02 PM
G - Quietly held its ground today at its 52-week high above its "max buy" level. Color code was changed to green. On 4/09/10 it triggered a technical buy signal as a solid gain with heavy volume more than 4 times average helped it trade above its pivot point after a 5-week consolidation. Color code was yellow with new pivot point noted in the 4/09/10 mid-day report (read here).
>>> The latest Featured Stock Update with an annotated graph appeared on 4/9/2010. click here.
|
|
C
A
S
I |
News |
Chart |
SEC
View all notes Alert
me of new notes
Company
Profile
|
VPRT
- NASDAQ
Vistaprint Nv
DIVERSIFIED SERVICES - Business/Management Services
|
$61.04
|
+1.15
|
345,202
95% DAV
363,500
|
3/1/2010
(Date
Featured) |
$57.72
(Price
Featured) |
PP = $59.70 |
G |
| MB = $62.69 |
Most Recent Note - 4/22/2010 5:34:52 PM
G - Gapped down then positively reversed today and closed strong to post a 7th consecutive small gain on average volume. It has recently found impressive support near its 50 DMA line. A subsequent violation of the short-term average or recent chart low ($55.45) would raise concerns and trigger technical sell signals. It did not trigger a new technical buy signal since it was featured in the March 2010 CANSLIM.net News monthly newsletter (read here).
>>> The latest Featured Stock Update with an annotated graph appeared on 4/15/2010. click here.
|
|
C
A
S
I |
News |
Chart |
SEC
View all notes Alert
me of new notes
Company
Profile
|
|
 |
|
| Subscriber Questions: |
April 21, 2010 |
Ken,
If a stock goes from yellow to green and I bought that stock when it was yellow, should I sell the stock when it goes green? .
Mark |
| Ken's Response: |
April 22, 2010 |
Dear Mark,
Thanks for asking a great question! I believe it would be impossible to professionally answer without knowing more information. This service is designed to help investors with the day-to-day application of the winning investment system, however, we have no idea what your personal risk tolerance is or what is suitable "investment advice" for you. So, we have explained through legal disclaimers and otherwise, as clearly as possible, that CANSLIM.net does not publish buy recommendations or sell recommendations!
If a stock was, or currently is, color coded yellow in reports, be aware that the stock in question may not have recently triggered a proper technical buy signal. We talk about the requirements for "buy signals" and "sell signals" and point out when they have occurred in the notes, and we identify support and resistance levels while covering key criteria on an ongoing basis - always doing our best to guide those of you who want to follow the investment system's rules! My suggestion is that you follow along with the expert notes and use the CANSLIM.net reports as a time saving tool and guide to keep you from drifting too far away from the proven rules-based tactics for maximizing gains and minimizing losses.
We want you to understand and get the most from CANSLIM.net's services. If you have any additional questions or suggestions on how we can improve our services or make things any more clear, we gladly welcome your input.
Please let me know if you have any other feedback by filling out the inquiry form.

Kenneth J. Gruneisen
Founder & Contributing Writer for CANSLIM.net
www.canslim.net |
|
|
|
THESE ARE NOT BUY RECOMMENDATIONS!
Comments contained in the body of this report are technical
opinions only. The material herein has been obtained
from sources believed to be reliable and accurate, however,
its accuracy and completeness cannot be guaranteed.
This site is not an investment advisor, hence it does
not endorse or recommend any securities or other investments.
Any recommendation contained in this report may not
be suitable for all investors and it is not to be deemed
an offer or solicitation on our part with respect to
the purchase or sale of any securities. All trademarks,
service marks and trade names appearing in this report
are the property of their respective owners, and are
likewise used for identification purposes only.
This report is a service available
only to active Paid Premium Members.
You may opt-out of receiving report notifications
at any time. Questions or comments may be submitted
by writing to Premium Membership Services 665 S.E. 10 Street, Suite 201 Deerfield Beach, FL 33441-5634 or by calling 1-800-965-8307
or 954-785-1121.
|
|
|


