You are not logged in.
This means you
CAN ONLY VIEW reports that were published prior to Monday, April 14, 2025.
You
MUST UPGRADE YOUR MEMBERSHIP if you want to see any current reports.
AFTER MARKET UPDATE - MONDAY, APRIL 21ST, 2014
Previous After Market Report Next After Market Report >>>
|
|
|
|
DOW |
+40.71 |
16,449.25 |
+0.25% |
|
Volume |
590,927,340 |
-28% |
|
Volume |
1,446,982,240 |
-19% |
|
NASDAQ |
+26.03 |
4,121.55 |
+0.64% |
|
Advancers |
1,899 |
60% |
|
Advancers |
1,637 |
59% |
|
S&P 500 |
+7.04 |
1,871.89 |
+0.38% |
|
Decliners |
1,162 |
37% |
|
Decliners |
1,045 |
38% |
|
Russell 2000 |
+4.44 |
1,142.34 |
+0.39% |
|
52 Wk Highs |
99 |
|
|
52 Wk Highs |
59 |
|
|
S&P 600 |
+2.08 |
659.81 |
+0.32% |
|
52 Wk Lows |
13 |
|
|
52 Wk Lows |
31 |
|
|
 |
Major Averages Rose With Less Volume Conviction
Kenneth J. Gruneisen - Passed the CAN SLIM® Master's Exam
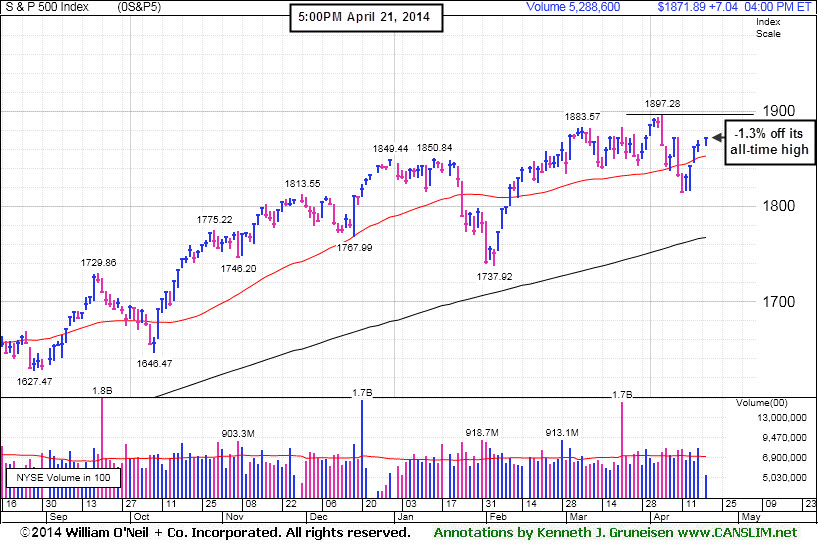
The major averages finished higher on Monday. The Dow rose 41 points to 16,449. The S&P 500 climbed 7 points to 1,871. The NASDAQ gained 26 points to close at 4,121. The volume totals were reported lighter than the prior session totals on both the NYSE and on the Nasdaq exchange, revealing lack of serious institutional buying demand. Advancers led decliners by a 3-2 margin on the NYSE and on the Nasdaq exchange. There were 25 high-ranked companies from the CANSLIM.net Leaders List that made new 52-week highs and appeared on the CANSLIM.net BreakOuts Page, down from the total of 32 stocks on the prior session. New 52-week highs outnumbered new 52-week lows on the NYSE and on the Nasdaq exchange. There were gains for all of the 4 high-ranked companies currently included on the Featured Stocks Page, a list that has grown shorter as numerous leaders have broken down in recent weeks. The Market (M criteria) pullback earned the label of a "correction" as a result of recent pressure on the indices. Graphs in the commentary following Thursday's action (read here) illustrated that recent weeks have been especially tough on many stocks which were high-ranked leaders in the previous rally. This is precisely how the fact-based investment system prompts investors to reduce their overall market exposure during weak periods.
The major averages advanced on Monday's session following a round of generally positive earnings releases. Halliburton (HAL +3.3%) following its better-than-expected quarterly results. Advanced Micro Devices (AMD +11.7%) after the chip-maker's profits topped consensus estimates. Shares of Netflix (NFLX +0.8%) edged higher ahead of its earnings release after the close.
On the economic front, the Conference Board's index of leading indicators rose +0.8% in March, slightly above a projected +0.7% increase. Attention was also on Ukraine. Vice President Joe Biden is visiting the country in an attempt to push for implementation of an agreement reached in Geneva last week.
Eight of 10 sectors in the S&P 500 were up on the session. Health care was the best performing group. Pfizer (PFE +2%) rose amid reports the drug maker recently held merger talks with Astra Zeneca. Utilities were the down the most, with Ameren (AEE -0.8%) among the decliners Financials also were lower with Citigroup (C -0.8%) falling less than -1%.
Treasuries were higher with the 10-year note up 2/32 to yield 2.71%.
To shift the market stance (M criteria) back to a "confirmed uptrend" requires a solid follow-through day or one or more of the major indices rallying to new high territory. Keep in mind that any sustained and meaningful market advance requires a healthy crop of stocks hitting new highs. The CANSLIM.net Featured Stocks Page shows the most action-worthy candidates and their latest notes and a Headline Link directs members to the latest detailed analysis with data-packed graphs annotated by a Certified expert along with links to additional resources. The Premium Member Homepage includes "dynamic archives" to all prior pay reports published. Watch for an announcement via email concerning the next WEBCAST.
PICTURED: The S&P 500 Index edged higher and finished -1.3% off its all-time high hit on 4/04/14.
|
 Kenneth J. Gruneisen started out as a licensed stockbroker in August 1987, a couple of months prior to the historic stock market crash that took the Dow Jones Industrial Average down -22.6% in a single day. He has published daily fact-based fundamental and technical analysis on high-ranked stocks online for two decades. Through FACTBASEDINVESTING.COM, Kenneth provides educational articles, news, market commentary, and other information regarding proven investment systems that work in good times and bad.
Comments contained in the body of this report are technical opinions only and are not necessarily those of Gruneisen Growth Corp. The material herein has been obtained from sources believed to be reliable and accurate, however, its accuracy and completeness cannot be guaranteed. Our firm, employees, and customers may effect transactions, including transactions contrary to any recommendation herein, or have positions in the securities mentioned herein or options with respect thereto. Any recommendation contained in this report may not be suitable for all investors and it is not to be deemed an offer or solicitation on our part with respect to the purchase or sale of any securities. |
|
 |
Retail, Tech, and Energy-Related Groups Rose
Kenneth J. Gruneisen - Passed the CAN SLIM® Master's Exam
The Retail Index ($RLX +0.62%) was a positive influence on the major averages while financial groups ended little changed. The Broker/Dealer Index ($XBD +0.14%) and the Bank Index ($BKX -0.06%) finished flat. Energy-related shares rose as the Oil Services Index ($OSX +1.02%) and Integrated Oil Index ($XOI +0.42%) both tallied modest gains. The Biotechnology Index ($BTK +1.23%) led the tech sector while the Networking Index ($NWX +0.43%) and the Semiconductor Index ($SOX +0.88%) also rose. Meanwhile the Gold & Silver Index ($XAU -0.31%) was a laggard as it edged lower.
Charts courtesy www.stockcharts.com
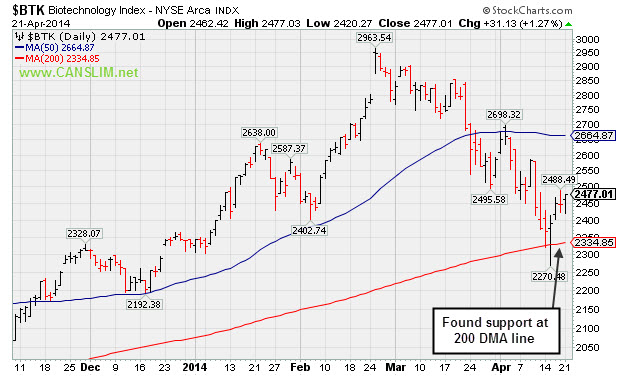
PICTURED: The Biotechnology Index ($BTK +1.23%) recently found support at its longer-term 200-day moving average (DMA) line.
| Oil Services |
$OSX |
300.21 |
+3.04 |
+1.02% |
+6.82% |
| Integrated Oil |
$XOI |
1,591.32 |
+6.69 |
+0.42% |
+5.87% |
| Semiconductor |
$SOX |
583.48 |
+5.07 |
+0.88% |
+9.06% |
| Networking |
$NWX |
333.97 |
+1.42 |
+0.43% |
+3.10% |
| Broker/Dealer |
$XBD |
154.58 |
+0.22 |
+0.14% |
-3.72% |
| Retail |
$RLX |
872.96 |
+5.42 |
+0.62% |
-7.11% |
| Gold & Silver |
$XAU |
89.90 |
-0.28 |
-0.31% |
+6.83% |
| Bank |
$BKX |
68.97 |
-0.04 |
-0.06% |
-0.42% |
| Biotech |
$BTK |
2,475.87 |
+29.99 |
+1.23% |
+6.24% |
|
|
|
 |
Submit Your Request for a Featured Stock Update
Kenneth J. Gruneisen - Passed the CAN SLIM® Master's Exam
Market conditions (the M criteria) are challenging at times. There are few stocks included on the Featured Stocks list and none of the companies need additional review in detail with annotated graphs. At times like these we have an opportunity to look back and review previously featured stocks which were dropped. This can serve as an educational review of the investment system's tactics. It is also a reminder that high-ranked leaders eventually fall out of favor. If you wish to request for a specific stock to receive more detailed coverage in this section please use the inquiry form to submit your request. Thank you! |
|
|
Color Codes Explained :
Y - Better candidates highlighted by our
staff of experts.
G - Previously featured
in past reports as yellow but may no longer be buyable under the
guidelines.
***Last / Change / Volume data in this table is the closing quote data***
Symbol/Exchange
Company Name
Industry Group |
PRICE |
CHANGE
(%Change) |
Day High |
Volume
(% DAV)
(% 50 day avg vol) |
52 Wk Hi
% From Hi |
Featured
Date |
Price
Featured |
Pivot Featured |
|
Max Buy |
EQM
-
NYSE
E Q T Midstream Partners
ENERGY - Oil and Gas Pipelines
|
$76.41
|
+1.59
2.13% |
$76.41
|
70,101
60.96% of 50 DAV
50 DAV is 115,000
|
$76.63
-0.29%
|
12/12/2013
|
$53.17
|
PP = $56.51
|
|
MB = $59.34
|
Most Recent Note - 4/16/2014 5:25:44 PM
G - Rallied for another new all-time high today. In strong shape, technically, despite fundamental concerns recently noted. Its 50 DMA line defines near-term support where a violation may trigger a technical sell signal.
>>> FEATURED STOCK ARTICLE : Technical Strength Continues Despite Fundamental Concerns - 4/9/2014
View all notes |
Set NEW NOTE alert |
CANSLIM.net Company Profile |
SEC
News |
Chart |
Request a new note
C
A N
S L
I M


|
GNRC
-
NYSE
Generac Hldgs Inc
Electrical-Power/Equipmt
|
$58.13
|
+0.41
0.71% |
$58.34
|
341,752
44.67% of 50 DAV
50 DAV is 765,000
|
$62.50
-6.99%
|
2/14/2014
|
$56.50
|
PP = $57.39
|
|
MB = $60.26
|
 Most Recent Note - 4/21/2014 5:42:02 PM
Y - Finding support near its 50 DMA line and prior highs in the $57 area recently. More damaging losses below its recent low ($55.27 on 4/14/14) would raise greater concerns.
>>> FEATURED STOCK ARTICLE : Finished Just Below its 50-Day Average Line - 4/11/2014
View all notes |
Set NEW NOTE alert |
CANSLIM.net Company Profile |
SEC
News |
Chart |
Request a new note
C
A N
S L
I M
|
ICON
-
NASDAQ
Iconix Brand Group Inc
CONSUMER NON-DURABLES - Textile - Apparel Footwear
|
$38.39
|
+0.83
2.21% |
$38.43
|
514,748
88.75% of 50 DAV
50 DAV is 580,000
|
$42.47
-9.60%
|
3/7/2014
|
$41.46
|
PP = $40.88
|
|
MB = $42.92
|
Most Recent Note - 4/21/2014 5:39:39 PM
G - Finished near the session high with near average volume behind its gain today. Halted its slide above its 200 DMA line but recent gains came on very light volume. Its Relative Strength rating improved to 84, above the 80+ minimum rank for buy candidates under the fact-based system. A rebound above the 50 DMA line is needed to help its outlook.
>>> FEATURED STOCK ARTICLE : Violated 50-Day Average and Relative Strength Rank Fell - 4/10/2014
View all notes |
Set NEW NOTE alert |
CANSLIM.net Company Profile |
SEC
News |
Chart |
Request a new note
C
A N
S L
I M
|
PSIX
-
NASDAQ
Power Solutions Intl Inc
Machinery-Gen Industrial
|
$82.47
|
+2.72
3.41% |
$82.99
|
52,456
78.29% of 50 DAV
50 DAV is 67,000
|
$87.40
-5.64%
|
2/28/2014
|
$74.65
|
PP = $76.93
|
|
MB = $80.78
|
Most Recent Note - 4/21/2014 5:36:49 PM
G- Rallied beyond its "max buy" level with today's 6th consecutive gain and its color code is changed to green. The recent low ($66.03 on 4/07/14) defines important near-term support below the 50 DMA line where further deterioration would raise greater concerns.
>>> FEATURED STOCK ARTICLE : Halted Slide After Slump Below 50-Day Moving Average - 4/14/2014
View all notes |
Set NEW NOTE alert |
CANSLIM.net Company Profile |
SEC
News |
Chart |
Request a new note
C
A N
S L
I M
|
|
|
|
THESE ARE NOT BUY RECOMMENDATIONS!
Comments contained in the body of this report are technical
opinions only. The material herein has been obtained
from sources believed to be reliable and accurate, however,
its accuracy and completeness cannot be guaranteed.
This site is not an investment advisor, hence it does
not endorse or recommend any securities or other investments.
Any recommendation contained in this report may not
be suitable for all investors and it is not to be deemed
an offer or solicitation on our part with respect to
the purchase or sale of any securities. All trademarks,
service marks and trade names appearing in this report
are the property of their respective owners, and are
likewise used for identification purposes only.
This report is a service available
only to active Paid Premium Members.
You may opt-out of receiving report notifications
at any time. Questions or comments may be submitted
by writing to Premium Membership Services 665 S.E. 10 Street, Suite 201 Deerfield Beach, FL 33441-5634 or by calling 1-800-965-8307
or 954-785-1121.
|
|
|

