You are not logged in.
This means you
CAN ONLY VIEW reports that were published prior to Tuesday, April 15, 2025.
You
MUST UPGRADE YOUR MEMBERSHIP if you want to see any current reports.
AFTER MARKET UPDATE - THURSDAY, APRIL 17TH, 2014
Previous After Market Report Next After Market Report >>>
|
|
|
|
DOW |
-16.31 |
16,408.54 |
-0.10% |
|
Volume |
819,612,280 |
+24% |
|
Volume |
1,784,210,070 |
+3% |
|
NASDAQ |
+9.29 |
4,095.52 |
+0.23% |
|
Advancers |
1,794 |
57% |
|
Advancers |
1,791 |
62% |
|
S&P 500 |
+2.54 |
1,864.85 |
+0.14% |
|
Decliners |
1,276 |
40% |
|
Decliners |
1,009 |
35% |
|
Russell 2000 |
+6.13 |
1,137.90 |
+0.54% |
|
52 Wk Highs |
131 |
|
|
52 Wk Highs |
53 |
|
|
S&P 600 |
+3.72 |
657.73 |
+0.57% |
|
52 Wk Lows |
18 |
|
|
52 Wk Lows |
39 |
|
|
 |
Major Averages Ended Higher on Holiday-Shortened Trading Week
Kenneth J. Gruneisen - Passed the CAN SLIM® Master's Exam
The major averages ended the holiday-shortened week in positive territory. The Dow and NASDAQ both rose +2.4% while the S&P 500 climbed +2.7%. Behind Thursday's gains the volume totals were reported higher than the prior session totals on both the NYSE and on the Nasdaq exchange, revealing a minor increase in institutional buying demand. Advancers led decliners by almost a 3-2 margin on the NYSE and 9-5 on the Nasdaq exchange. There were 32 high-ranked companies from the CANSLIM.net Leaders List that made new 52-week highs and appeared on the CANSLIM.net BreakOuts Page, up from the total of 22 stocks on the prior session. New 52-week highs outnumbered new 52-week lows on the NYSE and on the Nasdaq exchange. There were gains for 3 of the 4 high-ranked companies currently included on the Featured Stocks Page, a list that has grown shorter as numerous leaders have broken down in recent weeks. The Market (M criteria) pullback earned the label of a "correction" as a result of recent pressure on the indices. Graphs in the commentary below illustrate that recent weeks have been especially tough on many stocks which were high-ranked leaders in the previous rally. This is precisely how the fact-based investment system prompts investors to reduce their overall market exposure during weak periods.
Stocks finished little changed on Thursday. The Dow fell 16 points to 16,408. The S&P 500 was 3 points higher at 1,864. The NASDAQ rose 9 points to 4,095. The U.S. stock market is closed in observation of Good Friday for the Easter holiday.
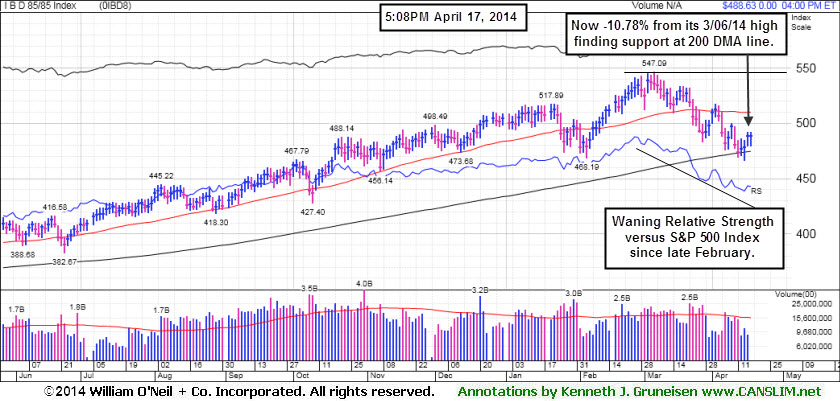
PICTURED 1: The IBD 85-85 Index is now -10.78% off its all-time high after finding support at its longer-term 200-day moving averages (DMA) line. Its Relative Strength line versus the benchmark S&P 500 Index hit its peak in late-February. Since then it has been slumping downward reflecting the fact that many high-ranked stocks have suffered big pullbacks in recent weeks. The major averages ended the session mixed as investors weighed a mixed bag of corporate profit releases. Shares of General Electric (GE +1.7%) after posting quarterly results above consensus estimates. Google (GOOGL -3.7%) as revenues fell short of analyst projections. Seven of 10 sectors in the S&P 500 were higher on the session. Energy was the best performing group. Chevron (CVX +1.5%). Utilities were down the most with Southern Company (SO -1.5%).
Investor attention was also on Ukraine. Stocks edged higher after a meeting of representatives from the European Union, Russia, Ukraine and the U.S concluded with an initial agreement to calm the conflict. On the economic front, weekly jobless claims rose modestly to 304,000, less than the 315,000 consensus projection.
Treasuries fell sharply with the 10-year note down 25/32 to yield 2.72%.
The CANSLIM.net Featured Stocks Page shows the most action-worthy candidates and their latest notes and a Headline Link directs members to the latest detailed analysis with data-packed graphs annotated by a Certified expert along with links to additional resources. The Premium Member Homepage includes "dynamic archives" to all prior pay reports published. Watch for an announcement via email concerning the next WEBCAST.

PICTURED 2: The S&P 500 Index managed to rebound above its 50-day moving average (DMA) line and finished within -1.74% of its all-time high hit on 4/04/14.
|
 Kenneth J. Gruneisen started out as a licensed stockbroker in August 1987, a couple of months prior to the historic stock market crash that took the Dow Jones Industrial Average down -22.6% in a single day. He has published daily fact-based fundamental and technical analysis on high-ranked stocks online for two decades. Through FACTBASEDINVESTING.COM, Kenneth provides educational articles, news, market commentary, and other information regarding proven investment systems that work in good times and bad.
Comments contained in the body of this report are technical opinions only and are not necessarily those of Gruneisen Growth Corp. The material herein has been obtained from sources believed to be reliable and accurate, however, its accuracy and completeness cannot be guaranteed. Our firm, employees, and customers may effect transactions, including transactions contrary to any recommendation herein, or have positions in the securities mentioned herein or options with respect thereto. Any recommendation contained in this report may not be suitable for all investors and it is not to be deemed an offer or solicitation on our part with respect to the purchase or sale of any securities. |
|
 |
Financial Indexes Consolidating Above 200-Day Moving Average Lines
Kenneth J. Gruneisen - Passed the CAN SLIM® Master's Exam
Energy-related shares had a positive bias as the Integrated Oil Index ($XOI +0.77%) and the Oil Services Index ($OSX +1.00%) rose. The Broker/Dealer Index ($XBD +1.09%) posted a gain while the Bank Index ($BKX -0.40%) edged lower. The Networking Index ($NWX +1.31%) and the Semiconductor Index ($SOX +1.85%) posted solid gains while the Biotechnology Index ($BTK -0.11%) lagged the rest of the tech sector. The Retail Index ($RLX +0.12%) edged higher. The Gold & Silver Index ($XAU -0.72%) was a laggard with a modest loss.
Charts courtesy www.stockcharts.com
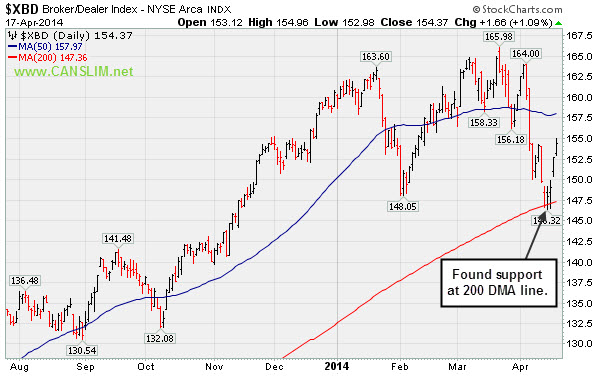
PICTURED 1: The Broker/Dealer Index ($XBD +1.09%) posted a 4th consecutive gain while rebounding from support at its longer-term 200-day moving average (DMA) line.
Charts courtesy www.stockcharts.com
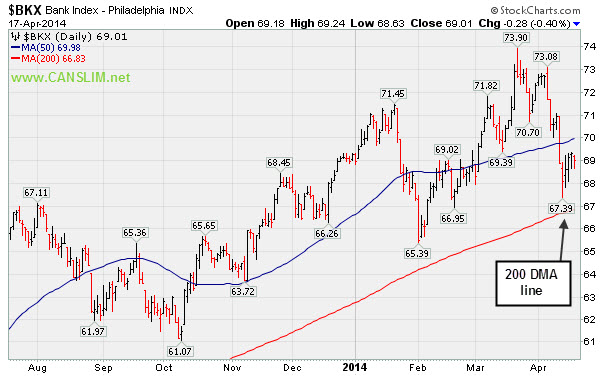
PICTURED 2: The Bank Index ($BKX -0.40%) recently halted its slide above its 200 DMA line. Further deterioration from the financial indices would bode poorly for the broader market outlook.
| Oil Services |
$OSX |
297.17 |
+2.95 |
+1.00% |
+5.74% |
| Integrated Oil |
$XOI |
1,584.63 |
+12.08 |
+0.77% |
+5.42% |
| Semiconductor |
$SOX |
578.41 |
+10.51 |
+1.85% |
+8.11% |
| Networking |
$NWX |
332.54 |
+4.30 |
+1.31% |
+2.66% |
| Broker/Dealer |
$XBD |
154.37 |
+1.66 |
+1.09% |
-3.86% |
| Retail |
$RLX |
867.54 |
+1.05 |
+0.12% |
-7.69% |
| Gold & Silver |
$XAU |
90.18 |
-0.65 |
-0.72% |
+7.17% |
| Bank |
$BKX |
69.01 |
-0.28 |
-0.40% |
-0.36% |
| Biotech |
$BTK |
2,445.88 |
-2.74 |
-0.11% |
+4.95% |
|
|
|
 |
Submit Your Request for a Featured Stock Update
Kenneth J. Gruneisen - Passed the CAN SLIM® Master's Exam
Market conditions (the M criteria) are challenging at times. There are few stocks included on the Featured Stocks list and none of the companies need additional review in detail with annotated graphs. At times like these we have an opportunity to look back and review previously featured stocks which were dropped. This can serve as an educational review of the investment system's tactics. It is also a reminder that high-ranked leaders eventually fall out of favor. If you wish to request for a specific stock to receive more detailed coverage in this section please use the inquiry form to submit your request. Thank you! |
|
|
Color Codes Explained :
Y - Better candidates highlighted by our
staff of experts.
G - Previously featured
in past reports as yellow but may no longer be buyable under the
guidelines.
***Last / Change / Volume data in this table is the closing quote data***
Symbol/Exchange
Company Name
Industry Group |
PRICE |
CHANGE
(%Change) |
Day High |
Volume
(% DAV)
(% 50 day avg vol) |
52 Wk Hi
% From Hi |
Featured
Date |
Price
Featured |
Pivot Featured |
|
Max Buy |
EQM
-
NYSE
E Q T Midstream Partners
ENERGY - Oil and Gas Pipelines
|
$74.82
|
-1.38
-1.81% |
$76.27
|
69,010
60.01% of 50 DAV
50 DAV is 115,000
|
$76.63
-2.36%
|
12/12/2013
|
$53.17
|
PP = $56.51
|
|
MB = $59.34
|
Most Recent Note - 4/16/2014 5:25:44 PM
G - Rallied for another new all-time high today. In strong shape, technically, despite fundamental concerns recently noted. Its 50 DMA line defines near-term support where a violation may trigger a technical sell signal.
>>> FEATURED STOCK ARTICLE : Technical Strength Continues Despite Fundamental Concerns - 4/9/2014
View all notes |
Set NEW NOTE alert |
CANSLIM.net Company Profile |
SEC
News |
Chart |
Request a new note
C
A N
S L
I M


|
GNRC
-
NYSE
Generac Hldgs Inc
Electrical-Power/Equipmt
|
$57.72
|
+0.39
0.68% |
$58.57
|
377,543
48.53% of 50 DAV
50 DAV is 778,000
|
$62.50
-7.65%
|
2/14/2014
|
$56.50
|
PP = $57.39
|
|
MB = $60.26
|
Most Recent Note - 4/16/2014 5:27:53 PM
Y - Finding support near its 50 DMA line and prior highs in the $57 area and its color code is changed to yellow. More damaging losses below its recent low ($55.27 on 4/14/14) would raise greater concerns.
>>> FEATURED STOCK ARTICLE : Finished Just Below its 50-Day Average Line - 4/11/2014
View all notes |
Set NEW NOTE alert |
CANSLIM.net Company Profile |
SEC
News |
Chart |
Request a new note
C
A N
S L
I M
|
ICON
-
NASDAQ
Iconix Brand Group Inc
CONSUMER NON-DURABLES - Textile - Apparel Footwear
|
$37.56
|
+0.15
0.40% |
$37.79
|
227,152
38.76% of 50 DAV
50 DAV is 586,000
|
$42.47
-11.55%
|
3/7/2014
|
$41.46
|
PP = $40.88
|
|
MB = $42.92
|
Most Recent Note - 4/16/2014 5:30:20 PM
G - Halted its slide near its 200 DMA line but recent gains came on very light volume. Its Relative Strength rating has slumped to 80, the minimum rank for buy candidates under the fact-based system. A rebound above the 50 DMA line is needed to help its outlook.
>>> FEATURED STOCK ARTICLE : Violated 50-Day Average and Relative Strength Rank Fell - 4/10/2014
View all notes |
Set NEW NOTE alert |
CANSLIM.net Company Profile |
SEC
News |
Chart |
Request a new note
C
A N
S L
I M
|
PSIX
-
NASDAQ
Power Solutions Intl Inc
Machinery-Gen Industrial
|
$79.75
|
+3.09
4.03% |
$80.45
|
90,406
134.93% of 50 DAV
50 DAV is 67,000
|
$87.40
-8.75%
|
2/28/2014
|
$74.65
|
PP = $76.93
|
|
MB = $80.78
|
 Most Recent Note - 4/17/2014 6:03:20 PM
Y - Rebounded toward its prior highs with today's 5th consecutive gain while consolidating above its 50 DMA line. The recent low ($66.03 on 4/07/14) defines important near-term support below the 50 DMA line where further deterioration would raise greater concerns.
>>> FEATURED STOCK ARTICLE : Halted Slide After Slump Below 50-Day Moving Average - 4/14/2014
View all notes |
Set NEW NOTE alert |
CANSLIM.net Company Profile |
SEC
News |
Chart |
Request a new note
C
A N
S L
I M
|
|
|
|
THESE ARE NOT BUY RECOMMENDATIONS!
Comments contained in the body of this report are technical
opinions only. The material herein has been obtained
from sources believed to be reliable and accurate, however,
its accuracy and completeness cannot be guaranteed.
This site is not an investment advisor, hence it does
not endorse or recommend any securities or other investments.
Any recommendation contained in this report may not
be suitable for all investors and it is not to be deemed
an offer or solicitation on our part with respect to
the purchase or sale of any securities. All trademarks,
service marks and trade names appearing in this report
are the property of their respective owners, and are
likewise used for identification purposes only.
This report is a service available
only to active Paid Premium Members.
You may opt-out of receiving report notifications
at any time. Questions or comments may be submitted
by writing to Premium Membership Services 665 S.E. 10 Street, Suite 201 Deerfield Beach, FL 33441-5634 or by calling 1-800-965-8307
or 954-785-1121.
|
|
|

