***Last / Change / Volume quote data in this table corresponds with the timestamp on the note***
Symbol/Exchange
Company Name
Industry Group |
Last |
Chg. |
Vol
% DAV |
Date Featured |
Price Featured |
Latest Pivot Point
Featured |
Status |
| Latest Max Buy Price |
ARUN
- NASDAQ
Aruba Networks Inc
COMPUTER HARDWARE - Networking & Communication Dev
|
$13.36
|
+0.30
|
988,140
61% DAV
1,627,000
|
2/19/2010
(Date
Featured) |
$12.71
(Price
Featured) |
PP = $11.94 |
G |
| MB = $12.54 |
Most Recent Note - 4/20/2010 5:42:46 PM
G - Posted a gain on light volume today. On the prior session it finished in the upper third of its intra-day range, a sign of prompt support after early lows near previously noted support levels to watch - its 50 DMA line and recent chart low $12.21 on 3/19/10.
>>> The latest Featured Stock Update with an annotated graph appeared on 3/31/2010. click here.
|
|
C
A
S
I |
News |
Chart |
SEC
View all notes Alert
me of new notes
Company
Profile
|
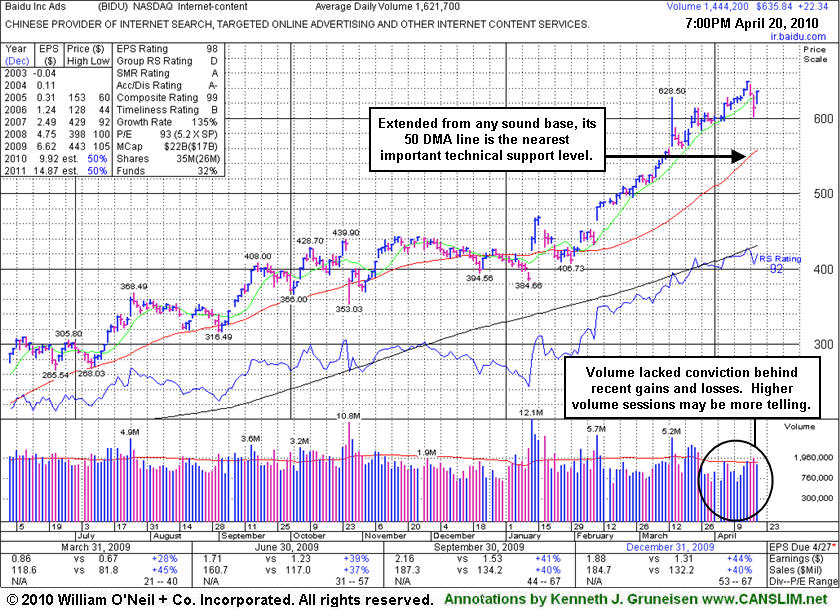
BIDU
- NASDAQ
Baidu Inc Ads
INTERNET - Internet Information Providers
|
$635.84
|
+22.34
|
1,451,365
89% DAV
1,621,700
|
1/13/2010
(Date
Featured) |
$431.25
(Price
Featured) |
PP = $426.75 |
G |
| MB = $448.09 |
Most Recent Note - 4/20/2010 5:53:36 PM
G - Posted a gain, fully repairing the prior session's considerable loss. It has been repeatedly noted as extended from any sound base after 10 consecutive weekly gains, however it could produce more climactic gains, especially due to the small supply (S criteria) of shares outstanding.
>>> The latest Featured Stock Update with an annotated graph appeared on 4/20/2010. click here.
|
|
C
A
S
I |
News |
Chart |
SEC
View all notes Alert
me of new notes
Company
Profile
|
BPI
- NYSE
Bridgepoint Education
DIVERSIFIED SERVICES - Education &; Training Services
|
$27.22
|
+0.91
|
452,766
107% DAV
422,300
|
4/13/2010
(Date
Featured) |
$25.59
(Price
Featured) |
PP = $25.76 |
G |
| MB = $27.05 |
Most Recent Note - 4/20/2010 6:02:56 PM
G- Closed at its sesssion high with a gain today on average volume for a new all-time high. Color code is changed to green after closing above its "max buy" level. Featured in yellow in the 4/13/10 mid-day report (read here), when it triggered a new technical buy signal as it rose from a cup-with-high-handle
>>> The latest Featured Stock Update with an annotated graph appeared on 4/13/2010. click here.
|
|
C
A
S
I |
News |
Chart |
SEC
View all notes Alert
me of new notes
Company
Profile
|
BRLI
- NASDAQ
Bio Reference Labs Inc
HEALTH SERVICES - Medical Laboratories & Researc
|
$47.78
|
+0.50
|
59,933
60% DAV
99,600
|
2/12/2010
(Date
Featured) |
$39.02
(Price
Featured) |
PP = $40.97 |
G |
| MB = $43.02 |
Most Recent Note - 4/20/2010 6:08:49 PM
G - Hit a new all-time high today with its 10th consecutive gain, rising from a brief consolidation above its 50 DMA line. Prior chart highs in the $45 area may be an initial support level to watch above its short-term average.
>>> The latest Featured Stock Update with an annotated graph appeared on 4/16/2010. click here.
|
|
C
A
S
I |
News |
Chart |
SEC
View all notes Alert
me of new notes
Company
Profile
|
CISG
- NASDAQ
Cninsure Inc Ads
INSURANCE - Insurance Brokers
|
$27.39
|
+1.92
|
256,988
102% DAV
252,800
|
3/3/2010
(Date
Featured) |
$24.38
(Price
Featured) |
PP = $23.10 |
G |
| MB = $24.26 |
Most Recent Note - 4/20/2010 6:11:05 PM
G - Rallied back today, a sign of prompt support. Loss on 4/16/10 with 3 times average volume was indicative of heavy distributional pressure while it pulled back near prior chart highs and its 50 DMA line in the $24 area which define an important support level. It traded up as much as +17.4% since featured in yellow in the 3/03/10 mid-day report (read here).
>>> The latest Featured Stock Update with an annotated graph appeared on 4/19/2010. click here.
|
|
C
A
S
I |
News |
Chart |
SEC
View all notes Alert
me of new notes
Company
Profile
|
CRM
- NYSE
Salesforce.com Inc
INTERNET - Internet Software & Services
|
$84.48
|
+1.83
|
1,073,770
60% DAV
1,783,300
|
3/5/2010
(Date
Featured) |
$72.28
(Price
Featured) |
PP = $75.53 |
G |
| MB = $79.31 |
Most Recent Note - 4/20/2010 6:14:05 PM
G - Gain on light volume today for a new high close. Now extended from prior chart highs and well above its "max buy" level. Volume totals were below the investment system guidelines as it rallied above its latest pivot point.
>>> The latest Featured Stock Update with an annotated graph appeared on 3/25/2010. click here.
|
|
C
A
S
I |
News |
Chart |
SEC
View all notes Alert
me of new notes
Company
Profile
|
CTRP
- NASDAQ
Ctrip.com Intl Ltd Adr
LEISURE - Resorts & Casinos
|
$37.12
|
+0.00
|
2,104,133
107% DAV
1,975,300
|
3/25/2010
(Date
Featured) |
$40.74
(Price
Featured) |
PP = $39.40 |
G |
| MB = $41.37 |
Most Recent Note - 4/20/2010 6:25:11 PM
G - Gapped up today then reversed into the red and closed unchanged and under its 50 DMA line again. Its color code was changed to green based on weakness under its pivot point. Encountered distributional pressure since 3/25/10 when a detailed Stock Bulletin with annotated graph and expert analysis was published (read here).
>>> The latest Featured Stock Update with an annotated graph appeared on 4/12/2010. click here.
|
|
C
A
S
I |
News |
Chart |
SEC
View all notes Alert
me of new notes
Company
Profile
|
EZPW
- NASDAQ
Ezcorp Inc Cl A
SPECIALTY RETAIL - Specialty Retail, Other
|
$22.70
|
+0.75
|
854,705
168% DAV
509,900
|
4/14/2010
(Date
Featured) |
$21.80
(Price
Featured) |
PP = $22.29 |
Y |
| MB = $23.40 |
Most Recent Note - 4/20/2010 6:27:24 PM
Y - Today's considerable gain with +67% above average volume as it rallied above the pivot point triggered a technical buy signal. Rose from a 5-week flat base with no overhead supply to act as resistance. Earnings news is due after the close on Thursday 4/22/10 from this high-ranked Finance - Consumer/Commercial Loans firm.
>>> The latest Featured Stock Update with an annotated graph appeared on 3/29/2010. click here.
|
|
C
A
S
I |
News |
Chart |
SEC
View all notes Alert
me of new notes
Company
Profile
|
GMCR
- NASDAQ
Green Mtn Coffee Roastrs
FOOD & BEVERAGE - Processed & Packaged Goods
|
$84.10
|
-6.59
|
5,527,387
531% DAV
1,040,700
|
2/26/2010
(Date
Featured) |
$84.39
(Price
Featured) |
PP = $88.75 |
G |
| MB = $93.19 |
Most Recent Note - 4/20/2010 6:30:09 PM
G - Suffered a considerable loss today with heavier volume behind its 7th consecutive loss, violating its 50-day moving average (DMA) line and its January highs in the $88 area, triggering technical sell signals. It had rallied more than 6-fold from its November '08 low.
>>> The latest Featured Stock Update with an annotated graph appeared on 4/5/2010. click here.
|
|
C
A
S
I |
News |
Chart |
SEC
View all notes Alert
me of new notes
Company
Profile
|
ISRG
- NASDAQ
Intuitive Surgical Inc
HEALTH SERVICES - Medical Appliances & Equipment
|
$366.68
|
+4.70
|
597,179
106% DAV
563,400
|
4/13/2010
(Date
Featured) |
$363.46
(Price
Featured) |
PP = $367.10 |
G |
| MB = $385.46 |
Most Recent Note - 4/20/2010 6:34:54 PM
G - Holding its ground and it rebounded back above its prior high closes. A considerable loss with 4 times average volume on 4/16/10 after reporting earnings negated its latest breakout with a close below its old high close. Color code was changed to green. ISRG was featured again in the 4/13/10 mid-day report (read here) with new pivot point cited based on its 3/03/10 high.
>>> The latest Featured Stock Update with an annotated graph appeared on 4/7/2010. click here.
|
|
C
A
S
I |
News |
Chart |
SEC
View all notes Alert
me of new notes
Company
Profile
|
LOPE
- NASDAQ
Grand Canyon Education
DIVERSIFIED SERVICES - Education &; Training Services
|
$27.01
|
+0.02
|
229,473
68% DAV
336,900
|
4/13/2010
(Date
Featured) |
$27.71
(Price
Featured) |
PP = $27.33 |
Y |
| MB = $28.70 |
Most Recent Note - 4/20/2010 6:42:44 PM
Y - Holding its ground this week, and recently consolidating below its pivot point. Subsequent weakness leading to a close below its old high close ($26.64 on 3/25/10) would raise concerns. Featured in the 4/13/10 mid-day report (read here), its gain triggered a technical buy after an advanced "3-weeks tight" type pattern.
>>> The latest Featured Stock Update with an annotated graph appeared on 4/14/2010. click here.
|
|
C
A
S
I |
News |
Chart |
SEC
View all notes Alert
me of new notes
Company
Profile
|
PCLN
- NASDAQ
Priceline.com Inc
INTERNET - Internet Software & Services
|
$399.55
|
-4.72
|
584,812
N/A
|
11/1/2002
(Date
Featured) |
$399.55
(Price
Featured) |
PP = $428.20 |
Y |
| MB = $449.61 |
Most Recent Note - 1/2/2011
Y - Returns to Featured Stocks list with its appearance in the January 2011 CANSLIM.net News including detailed analysis and annotated daily and weekly graphs.
>>> The latest Featured Stock Update with an annotated graph appeared on 3/30/2010. click here.
|
|
C
A
S
I |
News |
Chart |
SEC
View all notes Alert
me of new notes
Company
Profile
|
PEGA
- NASDAQ
Pegasystems Inc
COMPUTER SOFTWARE & SERVICES - Business Software & Services
|
$39.13
|
+1.31
|
114,444
65% DAV
176,200
|
2/26/2010
(Date
Featured) |
$36.00
(Price
Featured) |
PP = $38.55 |
Y |
| MB = $40.48 |
Most Recent Note - 4/20/2010 6:47:56 PM
Y - Gain today, finishing only 17 cents below a best ever close. A violation of its 50 DMA line or its recent low ($36.42 on 4/12/10) would raise concerns and trigger technical sell signals. Volume totals have been quiet while consolidating since 3/15/10, staying in a tight trading range near support.
>>> The latest Featured Stock Update with an annotated graph appeared on 4/6/2010. click here.
|
|
C
A
S
I |
News |
Chart |
SEC
View all notes Alert
me of new notes
Company
Profile
|
ROVI
- NASDAQ
Rovi Corp
COMPUTER SOFTWARE & SERVICES - Security Software & Services
|
$37.62
|
+0.75
|
477,384
36% DAV
1,337,100
|
4/20/2010
(Date
Featured) |
$37.62
(Price
Featured) |
PP = $38.60 |
Y |
| MB = $40.53 |
Most Recent Note - 4/20/2010 6:50:19 PM
Y - Quietly consolidating today only -2.3% off its 52-week high, perched above prior chart highs and its 50 DMA line coinciding in the $34 area which define an important support level to watch. Color code is changed to yellow with new pivot point and "max buy" levels cited after forming a new flat base.
>>> The latest Featured Stock Update with an annotated graph appeared on 4/8/2010. click here.
|
|
C
A
S
I |
News |
Chart |
SEC
View all notes Alert
me of new notes
Company
Profile
|
SIRO
- NASDAQ
Sirona Dental Systems
HEALTH SERVICES - Medical Instruments & Supplies
|
$40.18
|
+1.24
|
524,599
89% DAV
592,400
|
2/16/2010
(Date
Featured) |
$36.43
(Price
Featured) |
PP = $36.15 |
G |
| MB = $37.96 |
Most Recent Note - 4/20/2010 6:52:08 PM
G - Wedging continually higher in recent weeks, today reaching a new 52-week high. Prior chart highs and its 50 DMA line in the $36 area define an initial support level to watch.
>>> The latest Featured Stock Update with an annotated graph appeared on 3/26/2010. click here.
|
|
C
A
S
I |
News |
Chart |
SEC
View all notes Alert
me of new notes
Company
Profile
|
ULTA
- NASDAQ
Ulta Salon Cosm & Frag
SPECIALTY RETAIL - Specialty Retail, Other
|
$22.82
|
+0.65
|
196,752
50% DAV
393,900
|
3/12/2010
(Date
Featured) |
$22.81
(Price
Featured) |
PP = $21.72 |
G |
| MB = $22.81 |
Most Recent Note - 4/20/2010 6:53:31 PM
G - Posted a gain today on lighter volume after a considerable loss pressured it toward prior chart highs and its 50 DMA line which define support to watch in the $21 area. It made very little progress since the detailed Stock Bulletin and 3/12/10 mid-day report appearance.
>>> The latest Featured Stock Update with an annotated graph appeared on 4/1/2010. click here.
|
|
C
A
S
I |
News |
Chart |
SEC
View all notes Alert
me of new notes
Company
Profile
|
VIT
-
|
$24.95
|
+0.80
|
312,614
48% DAV
653,700
|
4/9/2010
(Date
Featured) |
$23.79
(Price
Featured) |
PP = $23.95 |
Y |
| MB = $25.15 |
Most Recent Note - 4/20/2010 6:54:58 PM
Y - Posted a small gap up gain today, finishing just 25 cents below its best ever close. Perched near its 52-week high, it has faced some distributional pressure. On 4/09/10 it triggered a technical buy signal as a solid gain with heavy volume more than 4 times average helped it trade above its pivot point after a 5-week consolidation. Color code was yellow with new pivot point noted in the 4/09/10 mid-day report (read here).
>>> The latest Featured Stock Update with an annotated graph appeared on 4/9/2010. click here.
|
|
C
A
S
I |
News |
Chart |
SEC
View all notes Alert
me of new notes
Company
Profile
|
VPRT
- NASDAQ
Vistaprint Nv
DIVERSIFIED SERVICES - Business/Management Services
|
$59.87
|
+0.43
|
205,056
55% DAV
369,600
|
3/1/2010
(Date
Featured) |
$57.72
(Price
Featured) |
PP = $59.70 |
G |
| MB = $62.69 |
Most Recent Note - 4/20/2010 6:56:21 PM
G - Posted a 5th consecutive small gain today on light or near average volume. It has recently found impressive support near its 50 DMA line. A subsequent violation of the short-term average or recent chart low ($55.45) would raise concerns and trigger technical sell signals. It did not trigger a new technical buy signal since it was featured in the March 2010 CANSLIM.net News monthly newsletter (read here).
>>> The latest Featured Stock Update with an annotated graph appeared on 4/15/2010. click here.
|
|
C
A
S
I |
News |
Chart |
SEC
View all notes Alert
me of new notes
Company
Profile
|