***Last / Change / Volume data in this table is the closing quote data***
Symbol/Exchange
Company Name
Industry Group |
PRICE |
CHANGE
(%Change) |
Day High |
Volume
(% DAV)
(% 50 day avg vol) |
52 Wk Hi
% From Hi |
Featured
Date |
Price
Featured |
Pivot Featured |
|
Max Buy |
ACN
-
NYSE
Accenture Plc
DIVERSIFIED SERVICES - Business/Management Services
|
$63.05
|
-0.51
-0.80% |
$63.71
|
3,079,608
93.47% of 50 DAV
50 DAV is 3,294,900
|
$65.89
-4.31%
|
3/23/2012
|
$64.13
|
PP = $63.76
|
|
MB = $66.95
|
Most Recent Note - 4/17/2012 5:35:28 PM
Y - Solid gain today with higher volume, rebounding back above its pivot point. Found support near prior highs in the $62-63 area and stayed well above its 50 DMA line.
>>> The latest Featured Stock Update with an annotated graph appeared on 3/23/2012. Click here.
View all notes |
Alert me of new notes |
CANSLIM.net Company Profile |
SEC |
Zacks Reports |
StockTalk |
News |
Chart |
Request a new note
C
A N
S L
I M


|
ADS
-
NYSE
Alliance Data Sys Corp
COMPUTER SOFTWARE and SERVICES - Information and Delivery Service
|
$127.44
|
+0.10
0.08% |
$130.31
|
1,446,725
235.70% of 50 DAV
50 DAV is 613,800
|
$128.44
-0.78%
|
1/17/2012
|
$108.24
|
PP = $107.43
|
|
MB = $112.80
|
 Most Recent Note - 4/19/2012 11:43:03 AM
G - No resistance remains due to overhead supply and it hit another new all-time high today. Reported earnings +17% on +20% sales revenues for the quarter ended March 31, 2012 versus the year-ago period. Fundamental concerns were raised earlier by earnings reported +9%, well below the +25% minimum guideline, for the latest quarter ended December 31, 2011 versus the year-ago period.
>>> The latest Featured Stock Update with an annotated graph appeared on 2/29/2012. Click here.
View all notes |
Alert me of new notes |
CANSLIM.net Company Profile |
SEC |
Zacks Reports |
StockTalk |
News |
Chart |
Request a new note
C
A N
S L
I M
|
ALLT
-
NASDAQ
Allot Communications Ltd
COMPUTER SOFTWARE andamp; SERVICES - Technical andamp; System Software
|
$23.55
|
-0.76
-3.13% |
$25.36
|
507,855
108.08% of 50 DAV
50 DAV is 469,900
|
$24.96
-5.65%
|
3/13/2012
|
$19.72
|
PP = $18.91
|
|
MB = $19.86
|
Most Recent Note - 4/18/2012 1:37:19 PM
G - Volume totals have been cooling while stubbornly holding its ground, a sign that few are exiting, while it remains perched near its 52-week high. Its latest consolidation has been brief, yet it may be forming an advanced "3-weeks tight" base well above its 50 DMA line and prior highs near $18-19 that define support to watch on pullbacks.
>>> The latest Featured Stock Update with an annotated graph appeared on 3/19/2012. Click here.
View all notes |
Alert me of new notes |
CANSLIM.net Company Profile |
SEC |
Zacks Reports |
StockTalk |
News |
Chart |
Request a new note
C
A N
S L
I M
|
ALXN
-
NASDAQ
Alexion Pharmaceuticals
DRUGS - Drug Manufacturers - Other
|
$90.97
|
+0.61
0.68% |
$92.38
|
792,847
61.46% of 50 DAV
50 DAV is 1,290,100
|
$95.01
-4.25%
|
3/12/2012
|
$87.87
|
PP = $87.73
|
|
MB = $92.12
|
Most Recent Note - 4/16/2012 7:02:56 PM
G - Testing support at its 50 DMA line today, which nearly coincides with its latest pivot point cited, after encountering recent distributional pressure. See the latest FSU analysis for more details and a new annotated graph.
>>> The latest Featured Stock Update with an annotated graph appeared on 4/16/2012. Click here.
View all notes |
Alert me of new notes |
CANSLIM.net Company Profile |
SEC |
Zacks Reports |
StockTalk |
News |
Chart |
Request a new note
C
A N
S L
I M
|
BODY
-
NASDAQ
Body Central Corp
RETAIL - Catalog andamp; Mail Order Houses
|
$27.27
|
-0.49
-1.77% |
$27.94
|
128,533
64.46% of 50 DAV
50 DAV is 199,400
|
$29.49
-7.53%
|
4/18/2012
|
$27.44
|
PP = $29.59
|
|
MB = $31.07
|
Most Recent Note - 4/18/2012 1:41:04 PM
Y - Hovering near its 50 DMA line today, finding support near that important short-term average. Color code is changed to yellow with new pivot point cited based on its 52-week high plus 10 cents. Volume-driven gains above the pivot point may trigger a new (or add-on) technical buy signal. Subsequent damaging losses below its recent lows would raise more serious concerns and trigger additional sell signals.
>>> The latest Featured Stock Update with an annotated graph appeared on 3/13/2012. Click here.
View all notes |
Alert me of new notes |
CANSLIM.net Company Profile |
SEC |
Zacks Reports |
StockTalk |
News |
Chart |
Request a new note
C
A N
S L
I M
|
Symbol/Exchange
Company Name
Industry Group |
PRICE |
CHANGE
(%Change) |
Day High |
Volume
(% DAV)
(% 50 day avg vol) |
52 Wk Hi
% From Hi |
Featured
Date |
Price
Featured |
Pivot Featured |
|
Max Buy |
CDNS
-
NASDAQ
Cadence Design Systems
COMPUTER SOFTWARE and SERVICES - Technical and System Software
|
$11.56
|
-0.19
-1.58% |
$11.90
|
2,861,616
100.07% of 50 DAV
50 DAV is 2,859,700
|
$12.60
-8.25%
|
2/3/2012
|
$11.66
|
PP = $11.15
|
|
MB = $11.71
|
Most Recent Note - 4/18/2012 1:42:38 PM
G - Still lingering below its 50 DMA line which may now act as resistance. Last week's low ($11.20 on 4/10/12) defines important near-term support level above its 200 DMA line.
>>> The latest Featured Stock Update with an annotated graph appeared on 3/28/2012. Click here.
View all notes |
Alert me of new notes |
CANSLIM.net Company Profile |
SEC |
Zacks Reports |
StockTalk |
News |
Chart |
Request a new note
C
A N
S L
I M
|
CELG
-
NASDAQ
Celgene Corp
DRUGS - Drug Manufacturers - Major
|
$78.59
|
-0.29
-0.37% |
$80.11
|
2,761,306
102.88% of 50 DAV
50 DAV is 2,683,900
|
$80.42
-2.28%
|
2/2/2012
|
$74.16
|
PP = $75.21
|
|
MB = $78.97
|
Most Recent Note - 4/18/2012 1:45:31 PM
G - Volume totals have been cooling while still stubbornly holding its ground and dipping below its "max buy" level briefly during the past week. Its 50 DMA line defines important support to watch.
>>> The latest Featured Stock Update with an annotated graph appeared on 3/26/2012. Click here.
View all notes |
Alert me of new notes |
CANSLIM.net Company Profile |
SEC |
Zacks Reports |
StockTalk |
News |
Chart |
Request a new note
C
A N
S L
I M
|
COO
-
NYSE
Cooper Companies Inc
HEALTH SERVICES - Medical Instruments and Supplies
|
$85.86
|
+0.93
1.10% |
$86.11
|
575,370
136.83% of 50 DAV
50 DAV is 420,500
|
$85.00
1.01%
|
3/9/2012
|
$83.05
|
PP = $81.02
|
|
MB = $85.07
|
Most Recent Note - 4/18/2012 1:51:04 PM
Y - Inching higher today with below average volume, trading at its 52-week high and near its "max buy" level. Wedging higher with no resistance remaining, but not showing signs of institutional accumulation since its big 4/05/12 gain on high volume. Its Relative Strength rating has improved to 84 now, better than the 80+ guideline for buy candidates.
>>> The latest Featured Stock Update with an annotated graph appeared on 3/9/2012. Click here.
View all notes |
Alert me of new notes |
CANSLIM.net Company Profile |
SEC |
Zacks Reports |
StockTalk |
News |
Chart |
Request a new note
C
A N
S L
I M
|
DISH
-
NASDAQ
Dish Network Corp Cl A
CONSUMER DURABLES - Electronic Equipment
|
$31.44
|
+0.69
2.24% |
$31.54
|
4,116,136
160.94% of 50 DAV
50 DAV is 2,557,600
|
$35.64
-11.78%
|
3/7/2012
|
$30.83
|
PP = $30.10
|
|
MB = $31.61
|
Most Recent Note - 4/18/2012 1:27:09 PM
G - Violated its 50 DMA line and slumping near its pivot point with a damaging loss today on above average volume raising concerns. A prompt show of support near that important short-term average would help its outlook, but a weak finish and further deterioration would raise more serious concerns.
>>> The latest Featured Stock Update with an annotated graph appeared on 3/14/2012. Click here.
View all notes |
Alert me of new notes |
CANSLIM.net Company Profile |
SEC |
Zacks Reports |
StockTalk |
News |
Chart |
Request a new note
C
A N
S L
I M
|
FEIC
-
NASDAQ
F E I Co
ELECTRONICS - Diversified Electronics
|
$47.00
|
-0.45
-0.95% |
$48.23
|
170,969
53.95% of 50 DAV
50 DAV is 316,900
|
$49.92
-5.85%
|
12/7/2011
|
$41.41
|
PP = $42.35
|
|
MB = $44.47
|
Most Recent Note - 4/18/2012 2:04:49 PM
G - Volume totals have been cooling while consolidating above its 50 DMA line. The latest quarterly report showed +21% earnings for the Dec '11 quarter, below the +25% minimum guideline for earnings growth.
>>> The latest Featured Stock Update with an annotated graph appeared on 3/12/2012. Click here.
View all notes |
Alert me of new notes |
CANSLIM.net Company Profile |
SEC |
Zacks Reports |
StockTalk |
News |
Chart |
Request a new note
C
A N
S L
I M
|
Symbol/Exchange
Company Name
Industry Group |
PRICE |
CHANGE
(%Change) |
Day High |
Volume
(% DAV)
(% 50 day avg vol) |
52 Wk Hi
% From Hi |
Featured
Date |
Price
Featured |
Pivot Featured |
|
Max Buy |
GNC
-
NYSE
G N C Holdings Inc
RETAIL - Drug Stores
|
$35.27
|
+0.10
0.28% |
$35.60
|
1,113,991
68.49% of 50 DAV
50 DAV is 1,626,500
|
$36.10
-2.30%
|
1/19/2012
|
$28.99
|
PP = $29.60
|
|
MB = $31.08
|
Most Recent Note - 4/17/2012 3:46:35 PM
G - Posting a solid gain today on higher volume, rallying after a pullback near its 50 DMA line, important support to watch on pullbacks. It completed Secondary Offerings on 10/25/11 and 3/13/12 after making steady progress following its 4/01/11 IPO.
>>> The latest Featured Stock Update with an annotated graph appeared on 3/5/2012. Click here.
View all notes |
Alert me of new notes |
CANSLIM.net Company Profile |
SEC |
Zacks Reports |
StockTalk |
News |
Chart |
Request a new note
C
A N
S L
I M
|
HLF
-
NYSE
Herbalife Ltd
DRUGS - Nutrition and Weight Management
|
$70.91
|
-0.02
-0.03% |
$71.38
|
785,997
57.69% of 50 DAV
50 DAV is 1,362,400
|
$72.11
-1.66%
|
4/18/2012
|
$71.19
|
PP = $72.21
|
|
MB = $75.82
|
Most Recent Note - 4/18/2012 2:03:02 PM
Y - Color code is changed to yellow with new pivot point cited based on its 52-week high plus 10 cents after forming an orderly flat base of sufficient length. Volume-driven gains for new highs may trigger a new (or add-on) technical buy signal. Consolidating above its 50 DMA line, important support to watch.
>>> The latest Featured Stock Update with an annotated graph appeared on 4/13/2012. Click here.
View all notes |
Alert me of new notes |
CANSLIM.net Company Profile |
SEC |
Zacks Reports |
StockTalk |
News |
Chart |
Request a new note
C
A N
S L
I M
|
ISRG
-
NASDAQ
Intuitive Surgical Inc
HEALTH SERVICES - Medical Appliances and Equipment
|
$579.22
|
-5.30
-0.91% |
$589.85
|
477,997
168.25% of 50 DAV
50 DAV is 284,100
|
$594.89
-2.63%
|
12/20/2011
|
$442.43
|
PP = $449.16
|
|
MB = $471.62
|
Most Recent Note - 4/18/2012 12:38:03 PM
G - Gapped up today, rallying from support at its 10-week moving average (WMA) line for a considerable volume-driven gain after reporting earnings +35% on +28% sales revenues for the quarter ended March 31, 2012 versus the year ago period. Color code remains green yet some may consider it a secondary buy point up to +5% above the latest high, and it also can be labeled a "breakaway gap" from a late-stage "3-weeks tight" base, an advanced base pattern. While it may produce more climactic gains, disciplined investors always limit losses if any stock falls -7% from their purchase price. It is on track for a 10th consecutive weekly gain.
>>> The latest Featured Stock Update with an annotated graph appeared on 3/1/2012. Click here.
View all notes |
Alert me of new notes |
CANSLIM.net Company Profile |
SEC |
Zacks Reports |
StockTalk |
News |
Chart |
Request a new note
C
A N
S L
I M
|
LULU
-
NASDAQ
Lululemon Athletica
MANUFACTURING - Textile Manufacturing
|
$72.96
|
-1.82
-2.43% |
$75.06
|
1,644,798
83.52% of 50 DAV
50 DAV is 1,969,300
|
$77.13
-5.41%
|
1/10/2012
|
$60.97
|
PP = $59.46
|
|
MB = $62.43
|
Most Recent Note - 4/16/2012 12:16:07 PM
G - Holding its ground since a damaging loss on 4/10/12 violated a previously noted upward trendline connecting January-March lows. Its 50 DMA line defines the next important support level to watch. See the latest FSU analysis for more details and an annotated graph.
>>> The latest Featured Stock Update with an annotated graph appeared on 4/12/2012. Click here.
View all notes |
Alert me of new notes |
CANSLIM.net Company Profile |
SEC |
Zacks Reports |
StockTalk |
News |
Chart |
Request a new note
C
A N
S L
I M
|
MA
-
NYSE
Mastercard Inc Cl A
DIVERSIFIED SERVICES - Business/Management Services
|
$436.82
|
+0.12
0.03% |
$440.79
|
687,998
83.25% of 50 DAV
50 DAV is 826,400
|
$443.80
-1.57%
|
3/12/2012
|
$419.86
|
PP = $428.67
|
|
MB = $450.10
|
Most Recent Note - 4/16/2012 5:48:34 PM
Y - Pulled back with lighter volume today following a prior gain on near average volume, not a fresh sign of institutional buying demand. Its 50 DMA line defines near-term support to watch.
>>> The latest Featured Stock Update with an annotated graph appeared on 4/11/2012. Click here.
View all notes |
Alert me of new notes |
CANSLIM.net Company Profile |
SEC |
Zacks Reports |
StockTalk |
News |
Chart |
Request a new note
C
A N
S L
I M
|
Symbol/Exchange
Company Name
Industry Group |
PRICE |
CHANGE
(%Change) |
Day High |
Volume
(% DAV)
(% 50 day avg vol) |
52 Wk Hi
% From Hi |
Featured
Date |
Price
Featured |
Pivot Featured |
|
Max Buy |
MELI
-
NASDAQ
Mercadolibre Inc
INTERNET - Internet Software and; Services
|
$91.44
|
+0.88
0.97% |
$94.56
|
457,091
93.76% of 50 DAV
50 DAV is 487,500
|
$104.50
-12.50%
|
2/6/2012
|
$97.09
|
PP = $95.58
|
|
MB = $100.36
|
Most Recent Note - 4/19/2012 11:18:44 AM
G - Up today after violating a previously noted low ($91.38 on 3/06/12) on the prior session. Only a prompt rebound above its 50 DMA line would help its technical stance and improve its outlook.
>>> The latest Featured Stock Update with an annotated graph appeared on 3/29/2012. Click here.
View all notes |
Alert me of new notes |
CANSLIM.net Company Profile |
SEC |
Zacks Reports |
StockTalk |
News |
Chart |
Request a new note
C
A N
S L
I M
|
MG
-
NYSE
Mistras Group Inc
DIVERSIFIED SERVICES - Bulding and Faci;ity Management Services
|
$23.01
|
-0.47
-2.00% |
$23.59
|
95,176
88.13% of 50 DAV
50 DAV is 108,000
|
$26.24
-12.31%
|
3/22/2012
|
$24.96
|
PP = $26.34
|
|
MB = $27.66
|
Most Recent Note - 4/17/2012 5:38:04 PM
G - Found support near its 50 DMA line and posted a gain today with light volume. Subsequent gains above its recent chart highs are needed to help its technical stance improve. Remained below the new pivot point cited in the 3/22/12 mid-day report based on its 52-week high plus 10 cents, not triggering a technical buy signal.
>>> The latest Featured Stock Update with an annotated graph appeared on 4/2/2012. Click here.
View all notes |
Alert me of new notes |
CANSLIM.net Company Profile |
SEC |
Zacks Reports |
StockTalk |
News |
Chart |
Request a new note
C
A N
S L
I M
|
MKTX
-
NASDAQ
Marketaxess Holdings Inc
FINANCIAL SERVICES - Investment Brokerage - Nationa
|
$36.47
|
+0.35
0.97% |
$36.78
|
110,748
35.66% of 50 DAV
50 DAV is 310,600
|
$37.95
-3.90%
|
3/8/2012
|
$35.80
|
PP = $35.52
|
|
MB = $37.30
|
Most Recent Note - 4/16/2012 1:59:56 PM
Y - Gapped up today, rallying within close striking distance of its best-ever close. Color code is changed to yellow based on its impressive resilience after finding prompt support. Rebounded above its 50 DMA line after an intra-day violation on 4/12/12 and loss with heavy volume raised concerns.
>>> The latest Featured Stock Update with an annotated graph appeared on 3/8/2012. Click here.
View all notes |
Alert me of new notes |
CANSLIM.net Company Profile |
SEC |
Zacks Reports |
StockTalk |
News |
Chart |
Request a new note
C
A N
S L
I M
|
NTES
-
NASDAQ
Netease Inc Adr
INTERNET - Internet Information Providers
|
$58.71
|
-0.98
-1.64% |
$60.50
|
786,753
114.34% of 50 DAV
50 DAV is 688,100
|
$60.47
-2.91%
|
3/19/2012
|
$56.18
|
PP = $55.10
|
|
MB = $57.86
|
Most Recent Note - 4/17/2012 5:50:42 PM
Y - Up today on higher but below average volume, rallying to a strong close near its "max buy" level. Last week's low and prior highs in the $55 area define important near-term chart support to watch.
>>> The latest Featured Stock Update with an annotated graph appeared on 3/27/2012. Click here.
View all notes |
Alert me of new notes |
CANSLIM.net Company Profile |
SEC |
Zacks Reports |
StockTalk |
News |
Chart |
Request a new note
C
A N
S L
I M
|
RAX
-
NYSE
Rackspace Hosting Inc
INTERNET - Internet Software and; Services
|
$57.35
|
-0.90
-1.55% |
$60.00
|
1,951,568
97.29% of 50 DAV
50 DAV is 2,005,900
|
$59.43
-3.50%
|
2/2/2012
|
$46.69
|
PP = $45.55
|
|
MB = $47.83
|
Most Recent Note - 4/17/2012 5:52:05 PM
G - Up today with higher but below average volume. Extended from its prior base and consolidating above its 50 DMA line which defines important near-term support to watch.
>>> The latest Featured Stock Update with an annotated graph appeared on 4/10/2012. Click here.
View all notes |
Alert me of new notes |
CANSLIM.net Company Profile |
SEC |
Zacks Reports |
StockTalk |
News |
Chart |
Request a new note
C
A N
S L
I M
|
Symbol/Exchange
Company Name
Industry Group |
PRICE |
CHANGE
(%Change) |
Day High |
Volume
(% DAV)
(% 50 day avg vol) |
52 Wk Hi
% From Hi |
Featured
Date |
Price
Featured |
Pivot Featured |
|
Max Buy |
RGR
-
NYSE
Sturm Ruger & Co Inc
CONSUMER DURABLES - Sporting Goods
|
$51.52
|
+0.06
0.12% |
$53.05
|
485,397
130.73% of 50 DAV
50 DAV is 371,300
|
$53.29
-3.32%
|
3/22/2012
|
$46.49
|
PP = $46.78
|
|
MB = $49.12
|
Most Recent Note - 4/18/2012 1:52:17 PM
G - Still holding its ground within close striking distance of its best-ever close. Found prompt support after a pullback near its prior high in the $46 area previously noted as support to watch above its 50 DMA line.
>>> The latest Featured Stock Update with an annotated graph appeared on 3/22/2012. Click here.
View all notes |
Alert me of new notes |
CANSLIM.net Company Profile |
SEC |
Zacks Reports |
StockTalk |
News |
Chart |
Request a new note
C
A N
S L
I M
|
RRTS
-
NYSE
Roadrunner Trans Systems
TRANSPORTATION - Air Delivery and Freight Service
|
$16.87
|
-0.41
-2.37% |
$17.54
|
54,893
48.49% of 50 DAV
50 DAV is 113,200
|
$18.59
-9.25%
|
2/10/2012
|
$17.40
|
PP = $17.50
|
|
MB = $18.38
|
Most Recent Note - 4/18/2012 1:54:41 PM
G - Sputtering near its 50 DMA line today. After finding recent support, any subsequent deterioration below the prior low ($16.65 on 4/10/12) would raise more serious concerns.
>>> The latest Featured Stock Update with an annotated graph appeared on 4/9/2012. Click here.
View all notes |
Alert me of new notes |
CANSLIM.net Company Profile |
SEC |
Zacks Reports |
StockTalk |
News |
Chart |
Request a new note
C
A N
S L
I M
|
SHFL
-
NASDAQ
Shuffle Master Inc
MANUFACTURING - Diversified Machinery
|
$16.76
|
-0.18
-1.06% |
$17.10
|
431,001
66.28% of 50 DAV
50 DAV is 650,300
|
$18.77
-10.71%
|
3/6/2012
|
$17.07
|
PP = $15.25
|
|
MB = $16.01
|
Most Recent Note - 4/18/2012 1:57:37 PM
G - Volume totals have been cooling while recently consolidating above its 50 DMA line. Last week's low and its short-term average define important near-term chart support to watch. It is -9.5% off its 52-week high today, extended from any sound base pattern.
>>> The latest Featured Stock Update with an annotated graph appeared on 3/15/2012. Click here.
View all notes |
Alert me of new notes |
CANSLIM.net Company Profile |
SEC |
Zacks Reports |
StockTalk |
News |
Chart |
Request a new note
C
A N
S L
I M
|
SXCI
-
NASDAQ
S X C Health Solutions
COMPUTER SOFTWARE and SERVICES - Healthcare Information Service
|
$97.00
|
+7.64
8.55% |
$97.59
|
5,338,232
780.22% of 50 DAV
50 DAV is 684,200
|
$89.58
8.28%
|
2/23/2012
|
$68.24
|
PP = $66.05
|
|
MB = $69.35
|
Most Recent Note - 4/19/2012 12:31:19 PM
G - Rallying today for a 2nd considerable volume-driven gain and yet another new 52-week high following 4/18/12 news it will acquire and merge with Catalyst Health Solutions Inc (CHSI). It is extended from its prior base and well above its 50 DMA line defining support to watch.
>>> The latest Featured Stock Update with an annotated graph appeared on 3/6/2012. Click here.
View all notes |
Alert me of new notes |
CANSLIM.net Company Profile |
SEC |
Zacks Reports |
StockTalk |
News |
Chart |
Request a new note
C
A N
S L
I M
|
TDG
-
NYSE
Transdigm Group Inc
AEROSPACE/DEFENSE - Aerospace/Defense Products and; Services
|
$119.07
|
-1.13
-0.94% |
$120.96
|
354,670
83.33% of 50 DAV
50 DAV is 425,600
|
$121.48
-1.98%
|
2/29/2012
|
$120.10
|
PP = $118.93
|
|
MB = $124.88
|
Most Recent Note - 4/17/2012 5:56:43 PM
Y - Rising from its 50 DMA line and it finished today at a best-ever close but its gain came with below average volume. Volume-driven gains for a new high close would be an encouraging sign of fresh institutional buying demand that could lead to a meaningful advance. Meanwhile, deterioration below prior lows ($110.60 on 3/20/12) would trigger a more worrisome technical sell signal.
>>> The latest Featured Stock Update with an annotated graph appeared on 3/30/2012. Click here.
View all notes |
Alert me of new notes |
CANSLIM.net Company Profile |
SEC |
Zacks Reports |
StockTalk |
News |
Chart |
Request a new note
C
A N
S L
I M
|
Symbol/Exchange
Company Name
Industry Group |
PRICE |
CHANGE
(%Change) |
Day High |
Volume
(% DAV)
(% 50 day avg vol) |
52 Wk Hi
% From Hi |
Featured
Date |
Price
Featured |
Pivot Featured |
|
Max Buy |
TIBX
-
NASDAQ
Tibco Software Inc
COMPUTER SOFTWARE and SERVICES - Business Software and Services
|
$33.71
|
-0.49
-1.43% |
$34.60
|
4,755,413
175.54% of 50 DAV
50 DAV is 2,709,000
|
$34.67
-2.77%
|
3/30/2012
|
$31.01
|
PP = $31.25
|
|
MB = $32.81
|
Most Recent Note - 4/18/2012 1:03:53 PM
G - Up today with volume running at an above average pace while getting further extended from its previous base. Color code was changed to green after rising beyond the cited "max buy" level. An upward trendline connecting its December, March, and April lows defines an initial support level to watch above additional support at prior highs in the $31 area and its 50 DMA line.
>>> The latest Featured Stock Update with an annotated graph appeared on 4/5/2012. Click here.
View all notes |
Alert me of new notes |
CANSLIM.net Company Profile |
SEC |
Zacks Reports |
StockTalk |
News |
Chart |
Request a new note
C
A N
S L
I M
|
TNGO
-
NASDAQ
Tangoe Inc
COMPUTER SOFTWARE and SERVICES - Technical and System Software
|
$21.53
|
+2.13
10.98% |
$21.69
|
1,350,496
213.96% of 50 DAV
50 DAV is 631,200
|
$20.05
7.38%
|
3/27/2012
|
$19.35
|
PP = $20.00
|
|
MB = $21.00
|
Most Recent Note - 4/19/2012 12:35:54 PM
Y - Color code was changed to yellow, and a strong finish with at least +40% above average volume may clinch a technical buy signal. Hitting a new 52-week high today, rising above its prior highs and quickly rallying near its "max buy" level.
>>> The latest Featured Stock Update with an annotated graph appeared on 4/3/2012. Click here.
View all notes |
Alert me of new notes |
CANSLIM.net Company Profile |
SEC |
Zacks Reports |
StockTalk |
News |
Chart |
Request a new note
C
A N
S L
I M
|
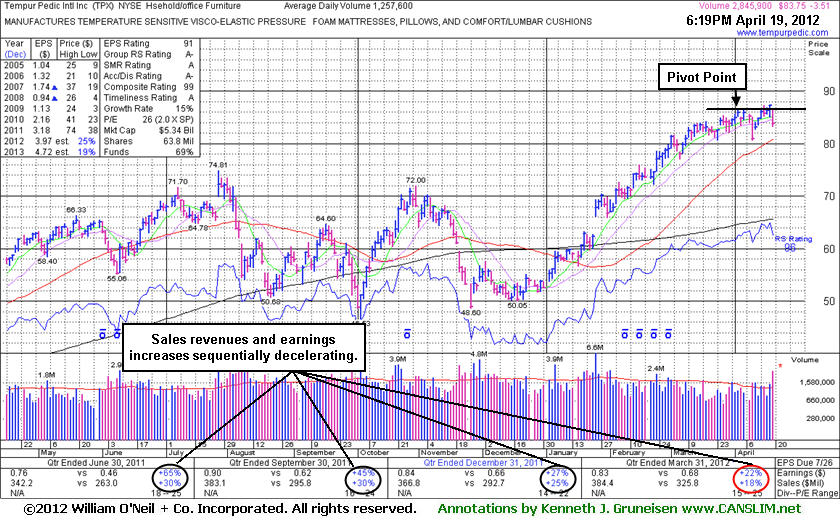
TPX
-
NYSE
Tempur Pedic Intl Inc
MANUFACTURING - Textile Manufacturing
|
$83.75
|
-3.51
-4.02% |
$86.59
|
3,655,892
290.70% of 50 DAV
50 DAV is 1,257,600
|
$87.43
-4.21%
|
4/19/2012
|
$84.83
|
PP = $86.71
|
|
MB = $91.05
|
Most Recent Note - 4/19/2012 6:34:22 PM
Y - Reported disappointing earnings after the close today after highlighted earlier in the mid-day report in yellow with pivot point cited based on its 4/03/12 high plus 10 cents and noted - "A volume-driven gain above its pivot point is still necessary to trigger a buy signal." See the latest FSU analysis for additional details and a new annotated graph.
>>> The latest Featured Stock Update with an annotated graph appeared on 4/19/2012. Click here.
View all notes |
Alert me of new notes |
CANSLIM.net Company Profile |
SEC |
Zacks Reports |
StockTalk |
News |
Chart |
Request a new note
C
A N
S L
I M
|
TSCO
-
NASDAQ
Tractor Supply Co
SPECIALTY RETAIL - Specialty Retail, Other
|
$98.88
|
-0.78
-0.78% |
$101.20
|
1,440,226
192.90% of 50 DAV
50 DAV is 746,600
|
$99.81
-0.93%
|
1/12/2012
|
$79.12
|
PP = $75.58
|
|
MB = $79.36
|
Most Recent Note - 4/19/2012 12:51:08 PM
G - Inching up for another new all-time high today, very extended from its prior base. Its 50 DMA line defines support to watch on pullbacks.
>>> The latest Featured Stock Update with an annotated graph appeared on 4/17/2012. Click here.
View all notes |
Alert me of new notes |
CANSLIM.net Company Profile |
SEC |
Zacks Reports |
StockTalk |
News |
Chart |
Request a new note
C
A N
S L
I M
|
UA
-
NYSE
Under Armour Inc Cl A
CONSUMER NON-DURABLES - Textile - Apparel Clothing
|
$96.50
|
-0.52
-0.54% |
$97.23
|
1,064,835
117.83% of 50 DAV
50 DAV is 903,700
|
$99.35
-2.87%
|
2/15/2012
|
$85.77
|
PP = $84.86
|
|
MB = $89.10
|
Most Recent Note - 4/17/2012 5:44:52 PM
G - Volume totals have been cooling while consolidating above its 50 DMA line. Prior gains above its pivot point did not have volume sufficient to trigger a proper technical buy signal, and recent losses on higher volume (near average, but above prior session totals) indicate mild distributional pressure while working on a possible new base-on-base pattern.
>>> The latest Featured Stock Update with an annotated graph appeared on 4/4/2012. Click here.
View all notes |
Alert me of new notes |
CANSLIM.net Company Profile |
SEC |
Zacks Reports |
StockTalk |
News |
Chart |
Request a new note
C
A N
S L
I M
|
Symbol/Exchange
Company Name
Industry Group |
PRICE |
CHANGE
(%Change) |
Day High |
Volume
(% DAV)
(% 50 day avg vol) |
52 Wk Hi
% From Hi |
Featured
Date |
Price
Featured |
Pivot Featured |
|
Max Buy |
UBNT
-
NASDAQ
Ubiquiti Networks Inc
TELECOMMUNICATIONS - Diversified Communication Serv
|
$33.29
|
+0.99
3.07% |
$33.94
|
350,497
102.57% of 50 DAV
50 DAV is 341,700
|
$35.32
-5.75%
|
4/12/2012
|
$33.89
|
PP = $34.07
|
|
MB = $35.77
|
Most Recent Note - 4/16/2012 1:51:18 PM
Y - Pulling back today from high today from an all-time high hit on the prior session. Its color code was changed to yellow with new pivot point cited based on its 3/26/12 high plus 10 cents after forming an advanced "ascending base" pattern marked by 3 pullbacks of 10-20% following its previous breakout. A volume-driven gain did not yet trigger a proper new (or add-on) technical buy signal.

>>> The latest Featured Stock Update with an annotated graph appeared on 3/21/2012. Click here.
View all notes |
Alert me of new notes |
CANSLIM.net Company Profile |
SEC |
Zacks Reports |
StockTalk |
News |
Chart |
Request a new note
C
A N
S L
I M
|
ULTA
-
NASDAQ
Ulta Salon Cosm & Frag
SPECIALTY RETAIL - Specialty Retail, Other
|
$94.49
|
-1.07
-1.12% |
$96.65
|
351,029
51.51% of 50 DAV
50 DAV is 681,500
|
$96.33
-1.91%
|
1/11/2012
|
$71.97
|
PP = $75.80
|
|
MB = $79.59
|
Most Recent Note - 4/16/2012 1:54:07 PM
G - Touched a new high today then reversed into the red. Its 50 DMA line defines support to watch well above its prior highs in the $75 area.
>>> The latest Featured Stock Update with an annotated graph appeared on 2/28/2012. Click here.
View all notes |
Alert me of new notes |
CANSLIM.net Company Profile |
SEC |
Zacks Reports |
StockTalk |
News |
Chart |
Request a new note
C
A N
S L
I M
|
V
-
NYSE
Visa Inc Cl A
DIVERSIFIED SERVICES - Business/Management Services
|
$121.19
|
-0.59
-0.48% |
$122.26
|
2,130,573
61.11% of 50 DAV
50 DAV is 3,486,500
|
$123.68
-2.01%
|
3/12/2012
|
$116.53
|
PP = $119.46
|
|
MB = $125.43
|
Most Recent Note - 4/16/2012 5:39:38 PM
Y - Pulled back today with a loss on above average volume. Friday's gain backed by +49% above average volume technically confirmed a buy signal. Its 50 DMA line defines support to watch well above prior highs in the $103-104 area.
>>> The latest Featured Stock Update with an annotated graph appeared on 3/7/2012. Click here.
View all notes |
Alert me of new notes |
CANSLIM.net Company Profile |
SEC |
Zacks Reports |
StockTalk |
News |
Chart |
Request a new note
C
A N
S L
I M
|
VMW
-
NYSE
Vmware Inc Cl A
COMPUTER SOFTWARE andamp; SERVICES - Technical andamp; System Software
|
$113.75
|
+2.46
2.21% |
$118.79
|
4,712,557
325.75% of 50 DAV
50 DAV is 1,446,700
|
$115.19
-1.25%
|
4/18/2012
|
$110.04
|
PP = $115.29
|
|
MB = $121.05
|
Most Recent Note - 4/19/2012 12:59:52 PM
Y - Gapped up today and hit a new 52-week high after reporting +38% earnings on +25% sales revenues for the quarter ended March 31, 2012 versus the year ago period. Featured in the 4/18/12 mid-day report (read here) in yellow with a pivot point cited based on its 52-week high plus 10 cents after a few very tight closes on its weekly chart while also finding support at its 10-week moving average. See the latest FSU analysis for more details and a new annotated weekly graph.
>>> The latest Featured Stock Update with an annotated graph appeared on 4/18/2012. Click here.
View all notes |
Alert me of new notes |
CANSLIM.net Company Profile |
SEC |
Zacks Reports |
StockTalk |
News |
Chart |
Request a new note
C
A N
S L
I M
|