You are not logged in.
This means you
CAN ONLY VIEW reports that were published prior to Tuesday, July 9, 2024.
You
MUST UPGRADE YOUR MEMBERSHIP if you want to see any current reports.
AFTER MARKET UPDATE - THURSDAY, APRIL 18TH, 2024
Previous After Market Report Next After Market Report >>>
|
|
|
|
DOW |
+22.07 |
37,775.38 |
+0.06% |
|
Volume |
894,100,003 |
+2% |
|
Volume |
4,998,642,100 |
-2% |
|
NASDAQ |
-81.87 |
15,601.50 |
-0.52% |
|
Advancers |
1,341 |
48% |
|
Advancers |
1,940 |
47% |
|
S&P 500 |
-11.09 |
5,011.12 |
-0.22% |
|
Decliners |
1,424 |
51% |
|
Decliners |
2,225 |
53% |
|
Russell 2000 |
-4.99 |
1,942.96 |
-0.26% |
|
52 Wk Highs |
11 |
|
|
52 Wk Highs |
21 |
|
|
S&P 600 |
+1.07 |
1,242.69 |
+0.09% |
|
52 Wk Lows |
56 |
|
|
52 Wk Lows |
240 |
|
|
Continued distributional action recently was noted as it signaled a shift in (M criteria) conditions from an "uptrend under pressure" to a market "correction". Use greater caution, raise cash and reduce exposure by selling any weakening stocks on a case-by-case basis.
|
 |
Mood of Market Remains Unenthused on Buy Side
Kenneth J. Gruneisen - Passed the CAN SLIM® Master's Exam
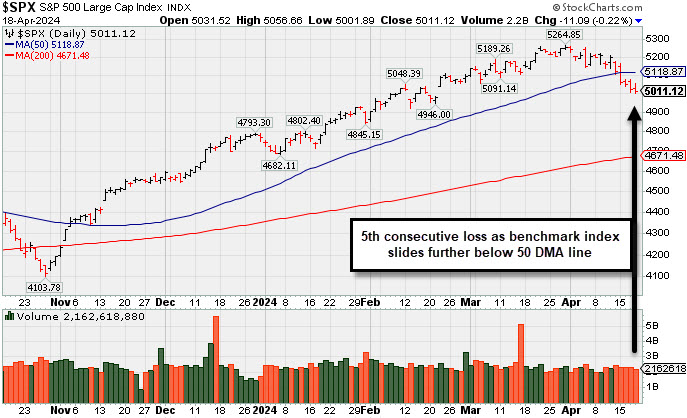
The S&P 500 (-0.2%), Nasdaq Composite (-0.5%), and Russell 2000 (-0.1%) each tallied a fifth consecutive loss while the Dow Jones Industrial Average eked out a 0.1% gain. Volume reported was mixed, higher than the prior session total on the NYSE and lighter on the Nasdaq exchange. Breadth was slightly negative as decliners led advancers by a narrow margin on the and the Nasdaq exchange. Leadership remained thin as only 3 high-ranked companies from the Leaders List hit new 52-week highs and were listed on the BreakOuts Page versus 2 on the prior session. New 52-week lows totals again outnumbered new 52-week highs on the NYSE and on the Nasdaq exchange. The major indices have shown distributional action indicative of a market correction (M criteria). Greater caution is important for all investors. Always stand ready to protect against losses.
PICTURED: The S&P 500 Index fell further below its 50-day moving average (DMA) line with a recent spurt of losses.
The S&P 500 information technology (-0.9%) and consumer discretionary (-0.7%) sectors were weak. Meanwhile, the communication services sector ended up +0.7%. The 10-yr note yield rose six basis points to 4.65% and the 2-yr note yield settled six basis points higher at 4.65%. The weekly jobless claims report showed no change from last week's level and there was better-than-expected data from the Philadelphia Fed survey for April.
Genuine Parts (GPC +11.22%) and Elevance Health (ELV +3.19%) were winning standouts after reporting earnings. Las Vegas Sands (LVS -8.66%) and Equifax (EFX -8.49%) logged the biggest declines among S&P 500 constituents after their quarterly results. Weakness in some heavily-weighted components like Microsoft (MSFT -1.8%), Amazon.com (AMZN -1.2%), and Tesla (TSLA-3.6%), which hit a new 52-week low today, had a disproportionate influence on index performance.
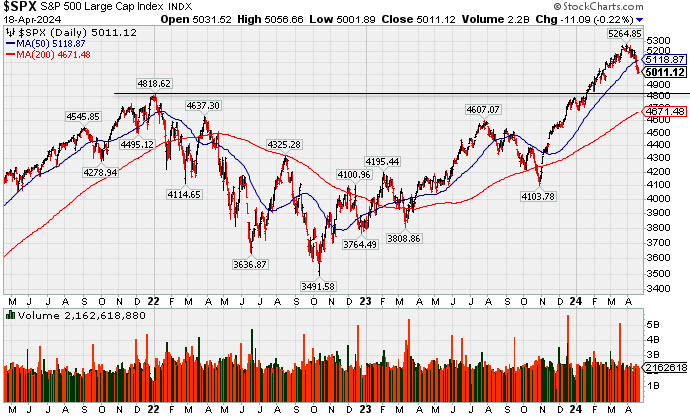
PICTURED: The 3-year S&P 500 Index graph shows how far above the January 2022 high the benchmark index has risen during the remarkable rally which began with a noted follow-through-day on November 1st, 2023.
|
 Kenneth J. Gruneisen started out as a licensed stockbroker in August 1987, a couple of months prior to the historic stock market crash that took the Dow Jones Industrial Average down -22.6% in a single day. He has published daily fact-based fundamental and technical analysis on high-ranked stocks online for two decades. Through FACTBASEDINVESTING.COM, Kenneth provides educational articles, news, market commentary, and other information regarding proven investment systems that work in good times and bad.
Comments contained in the body of this report are technical opinions only and are not necessarily those of Gruneisen Growth Corp. The material herein has been obtained from sources believed to be reliable and accurate, however, its accuracy and completeness cannot be guaranteed. Our firm, employees, and customers may effect transactions, including transactions contrary to any recommendation herein, or have positions in the securities mentioned herein or options with respect thereto. Any recommendation contained in this report may not be suitable for all investors and it is not to be deemed an offer or solicitation on our part with respect to the purchase or sale of any securities. |
|
 |
Bank and Gold & Silver Indexes
Kenneth J. Gruneisen - Passed the CAN SLIM® Master's Exam
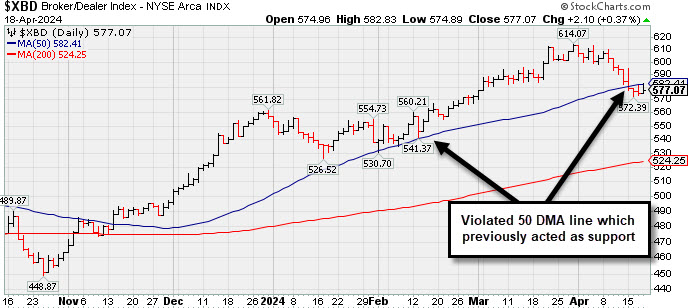
The Bank Index ($BKX +0.72%) outpaced the Broker/Dealer Index ($XBD +0.37%) with modest gains, meanwhile the Retail Index ($RLX -0.63%) created a drag on the major indices. The tech sector had a negative bias as the Semiconductor Index ($SOX -1.66%), Networking Index ($NWX -0.78%), and the Biotech Index ($BTK -1.56%) each ended lower. The Gold & Silver Index ($XAU +0.42%) and Oil Services Index ($OSX +0.21%) both rose while the Integrated Oil Index ($XOI -1.03%) ended the session with a loss.
![]() PICTURED: The Broker/Dealer Index ($XBD +0.37%) violated its 50-day moving average (DMA) line with recent losses. That important short-term average previously acted as support.
| Oil Services |
$OSX |
87.20 |
+0.18 |
+0.21% |
+3.96% |
| Integrated Oil |
$XOI |
2,136.70 |
-22.34 |
-1.03% |
+14.72% |
| Semiconductor |
$SOX |
4,491.71 |
-75.60 |
-1.66% |
+7.57% |
| Networking |
$NWX |
729.57 |
-5.73 |
-0.78% |
-12.40% |
| Broker/Dealer |
$XBD |
577.07 |
+2.10 |
+0.37% |
+3.55% |
| Retail |
$RLX |
4,320.91 |
-27.35 |
-0.63% |
+11.11% |
| Gold & Silver |
$XAU |
135.29 |
+0.56 |
+0.42% |
+7.64% |
| Bank |
$BKX |
98.18 |
+0.70 |
+0.72% |
+2.25% |
| Biotech |
$BTK |
4,861.76 |
-76.90 |
-1.56% |
-10.28% |
|
|
|
 |
Featured Stocks
Kenneth J. Gruneisen - Passed the CAN SLIM® Master's Exam
|
|
|
Color Codes Explained :
Y - Better candidates highlighted by our
staff of experts.
G - Previously featured
in past reports as yellow but may no longer be buyable under the
guidelines.
***Last / Change / Volume data in this table is the closing quote data***
Symbol/Exchange
Company Name
Industry Group |
PRICE |
CHANGE
(%Change) |
Day High |
Volume
(% DAV)
(% 50 day avg vol) |
52 Wk Hi
% From Hi |
Featured
Date |
Price
Featured |
Pivot Featured |
|
Max Buy |
 NVO
-
NYSE
NVO
-
NYSE
Novo Nordisk ADR
Medical-Ethical Drugs
|
$122.75
|
-1.78
-1.43% |
$124.10
|
2,837,978
57.59% of 50 DAV
50 DAV is 4,928,000
|
$138.28
-11.23%
|
3/1/2024
|
$124.23
|
PP = $124.97
|
|
MB = $131.22
|
Most Recent Note - 4/17/2024 3:56:57 PM
G - Color code is changed to green while sputtering below its 50 DMA line ($125.96) while volume totals have still been cooling. Losses below prior lows raised concerns and triggered a technical sell signal. A rebound above the 50 DMA line is needed for its outlook to improve.
>>> FEATURED STOCK ARTICLE : Volume Cools While Consolidating Above 50-Day Moving Average Line - 4/3/2024 |
View all notes |
Set NEW NOTE alert |
Company Profile |
SEC
News |
Chart |
Request a new note
C
A
S
I |
AXON
-
NASDAQ
Axon Enterprise
Security/Sfty
|
$297.59
|
-2.23
-0.74% |
$303.51
|
529,513
102.42% of 50 DAV
50 DAV is 517,000
|
$329.87
-9.79%
|
4/5/2024
|
$309.90
|
PP = $325.73
|
|
MB = $342.02
|
Most Recent Note - 4/17/2024 3:43:19 PM
Y - Testing its 50 DMA line ($298.68) today after 3 consecutive losses. Color code was changed to yellow with new pivot point cited based on its 3/04/24 high plus 10 cents. A gain above the pivot point backed by at least +40% above average volume is needed to trigger a proper technical buy signal. Fundamentals remain strong.
>>> FEATURED STOCK ARTICLE : Volume Totals Cooling While Building a New Base - 4/8/2024 |
View all notes |
Set NEW NOTE alert |
Company Profile |
SEC
News |
Chart |
Request a new note
C
A
S
I |
TDG
-
NYSE
TransDigm Group
Aerospace/Defense
|
$1,213.50
|
-12.20
-1.00% |
$1,237.39
|
205,492
98.79% of 50 DAV
50 DAV is 208,000
|
$1,248.39
-2.79%
|
4/12/2024
|
$1,224.21
|
PP = $1,246.32
|
|
MB = $1,308.64
|
Most Recent Note - 4/17/2024 4:03:56 PM
Y - Color code is changed to yellow after holding its ground in a tight range near its all-time high. New pivot point was cited based on its 4/04/24 high plus 10 cents. Subsequent gains above the pivot point backed by at least +40% above average volume are needed to trigger a proper new technical buy signal. Its 50 DMA line ($1,187) defines near-term support to watch.
>>> FEATURED STOCK ARTICLE : Volume Totals Cooling While Perched Near High - 4/9/2024 |
View all notes |
Set NEW NOTE alert |
Company Profile |
SEC
News |
Chart |
Request a new note
C
A
S
I |
PCAR
-
NASDAQ
Paccar
Trucks and Parts-Hvy Duty
|
$113.76
|
-2.17
-1.87% |
$116.87
|
2,236,302
102.11% of 50 DAV
50 DAV is 2,190,000
|
$125.50
-9.35%
|
1/23/2024
|
$100.35
|
PP = $98.57
|
|
MB = $103.50
|
Most Recent Note - 4/17/2024 3:59:27 PM
G - Quietly pulling back from its all-time high testing its 50 DMA line ($115.25) which defines near-term support to watch. Fundamentals remain strong.
>>> FEATURED STOCK ARTICLE : Pulling Back From High and Slumping Toward 50-Day Moving Average - 4/12/2024 |
View all notes |
Set NEW NOTE alert |
Company Profile |
SEC
News |
Chart |
Request a new note
C
A
S
I |
HUBB
-
NYSE
Hubbell
Electrical-Power/Equipmt
|
$392.28
|
+1.31
0.34% |
$397.94
|
299,079
73.85% of 50 DAV
50 DAV is 405,000
|
$429.61
-8.69%
|
1/30/2024
|
$343.26
|
PP = $336.83
|
|
MB = $353.67
|
Most Recent Note - 4/17/2024 3:48:23 PM
G - Pulling back testing its 50 DMA line ($389.24) which defines important support to watch. Slumping after a noted "negative reversal" at its all-time high on 4/04/24.
>>> FEATURED STOCK ARTICLE : Hubbell Perched at All-Time High After 5 Weekly Gains - 3/22/2024 |
View all notes |
Set NEW NOTE alert |
Company Profile |
SEC
News |
Chart |
Request a new note
C
A
S
I |
Symbol/Exchange
Company Name
Industry Group |
PRICE |
CHANGE
(%Change) |
Day High |
Volume
(% DAV)
(% 50 day avg vol) |
52 Wk Hi
% From Hi |
Featured
Date |
Price
Featured |
Pivot Featured |
|
Max Buy |
USLM
-
NASDAQ
U.S. Lime & Minerals
Bldg-Cement/Concrt/Ag
|
$295.01
|
+2.46
0.84% |
$297.43
|
30,417
132.25% of 50 DAV
50 DAV is 23,000
|
$308.00
-4.22%
|
2/9/2024
|
$254.68
|
PP = $265.09
|
|
MB = $278.34
|
Most Recent Note - 4/17/2024 4:04:26 PM
G - Still hovering in a tight range in recent weeks near its all-time high, stubbornly holding its ground despite encountering some distributional pressure. Its 50 DMA line ($279) defines near-term support to watch.
>>> FEATURED STOCK ARTICLE : Gain With Light Volume for Best Ever Close - 4/5/2024 |
View all notes |
Set NEW NOTE alert |
Company Profile |
SEC
News |
Chart |
Request a new note
C
A
S
I |
NOW
-
NYSE
ServiceNow
Computer Sftwr-Enterprse
|
$731.36
|
-5.09
-0.69% |
$739.89
|
788,274
69.64% of 50 DAV
50 DAV is 1,132,000
|
$815.32
-10.30%
|
2/22/2024
|
$771.75
|
PP = $815.32
|
|
MB = $856.09
|
Most Recent Note - 4/17/2024 3:51:20 PM
G - Color code is changed to green while sputtering under its 50 DMA line ($768.48). A rebound above the 50 DMA line is needed for its outlook to improve. Prior lows in the $730 area define the next important near-term support to watch.
>>> FEATURED STOCK ARTICLE : Quietly Consolidating Near 50-Day Moving Average Line - 4/11/2024 |
View all notes |
Set NEW NOTE alert |
Company Profile |
SEC
News |
Chart |
Request a new note
C
A
S
I |
PAY
-
NYSE
Paymentus Holdings
Finance-CrdtCard/PmtPr
|
$19.58
|
+0.50
2.62% |
$19.89
|
235,276
61.11% of 50 DAV
50 DAV is 385,000
|
$25.21
-22.33%
|
3/5/2024
|
$19.97
|
PP = $18.89
|
|
MB = $19.83
|
 Most Recent Note - 4/18/2024 5:55:56 PM
G - Still testing its 50 DMA line ($19.46) which defines important near-term support above prior highs in the $18 range. More damaging losses would raise greater concerns.
>>> FEATURED STOCK ARTICLE : Consolidating After Powerful Breakout and Volume-Driven Gains - 3/27/2024 |
View all notes |
Set NEW NOTE alert |
Company Profile |
SEC
News |
Chart |
Request a new note
C
A
S
I |
HUBS
-
NYSE
HubSpot
Comp Sftwr-Spec Enterprs
|
$649.58
|
+16.13
2.55% |
$668.65
|
722,157
137.82% of 50 DAV
50 DAV is 524,000
|
$693.85
-6.38%
|
4/4/2024
|
$686.66
|
PP = $660.10
|
|
MB = $693.11
|
Most Recent Note - 4/18/2024 12:17:37 PM
Y - Posting a solid gain today. Stalled after highlighted yellow in the 4/04/24 mid-day report with pivot point cited based on its 2/09/24 high plus 10 cents. Initial support is at its prior highs and its 50 DMA line ($625). Fundamentals remain strong. Faces some resistance due to old overhead supply up to the $866 level.
>>> FEATURED STOCK ARTICLE : Encountered Distributional Pressure and Finished Below Pivot Point - 4/4/2024 |
View all notes |
Set NEW NOTE alert |
Company Profile |
SEC
News |
Chart |
Request a new note
C
A
S
I |
|
|
|
THESE ARE NOT BUY RECOMMENDATIONS!
Comments contained in the body of this report are technical
opinions only. The material herein has been obtained
from sources believed to be reliable and accurate, however,
its accuracy and completeness cannot be guaranteed.
This site is not an investment advisor, hence it does
not endorse or recommend any securities or other investments.
Any recommendation contained in this report may not
be suitable for all investors and it is not to be deemed
an offer or solicitation on our part with respect to
the purchase or sale of any securities. All trademarks,
service marks and trade names appearing in this report
are the property of their respective owners, and are
likewise used for identification purposes only.
This report is a service available
only to active Paid Premium Members.
You may opt-out of receiving report notifications
at any time. Questions or comments may be submitted
by writing to Premium Membership Services 665 S.E. 10 Street, Suite 201 Deerfield Beach, FL 33441-5634 or by calling 1-800-965-8307
or 954-785-1121.
|
|
|