You are not logged in.
This means you
CAN ONLY VIEW reports that were published prior to Tuesday, July 9, 2024.
You
MUST UPGRADE YOUR MEMBERSHIP if you want to see any current reports.
AFTER MARKET UPDATE - WEDNESDAY, APRIL 17TH, 2024
Previous After Market Report Next After Market Report >>>
|
|
|
|
DOW |
-45.66 |
37,753.31 |
-0.12% |
|
Volume |
878,306,306 |
-7% |
|
Volume |
5,119,358,100 |
+2% |
|
NASDAQ |
-181.88 |
15,683.37 |
-1.15% |
|
Advancers |
1,318 |
48% |
|
Advancers |
1,635 |
39% |
|
S&P 500 |
-29.20 |
5,022.21 |
-0.58% |
|
Decliners |
1,403 |
52% |
|
Decliners |
2,559 |
61% |
|
Russell 2000 |
-19.53 |
1,947.95 |
-0.99% |
|
52 Wk Highs |
11 |
|
|
52 Wk Highs |
26 |
|
|
S&P 600 |
-9.82 |
1,241.62 |
-0.78% |
|
52 Wk Lows |
65 |
|
|
52 Wk Lows |
247 |
|
|
Continued distributional action recently was noted as it signaled a shift in (M criteria) conditions from an "uptrend under pressure" to a market "correction". Use greater caution, raise cash and reduce exposure by selling any weakening stocks on a case-by-case basis.
|
 |
Failing to Attract Buying Demand, Major Indices Ended Lower
Kenneth J. Gruneisen - Passed the CAN SLIM® Master's Exam
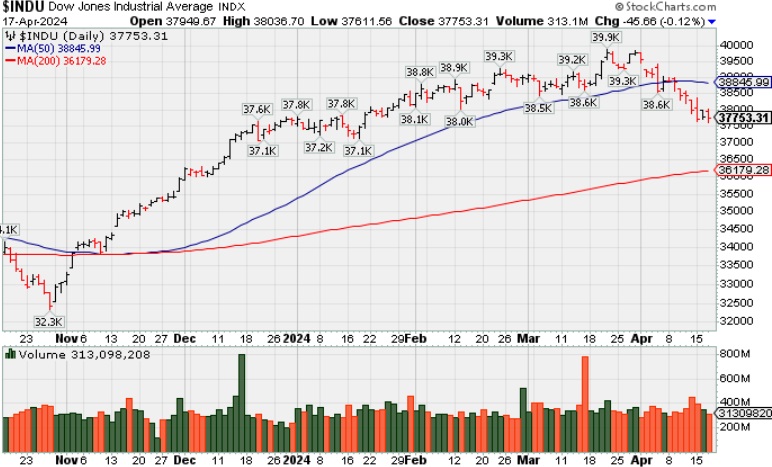
The major indices each ended slightly in the red, failing to attract meaningful buying demand. Volume reported was mixed, lighter than the prior session total on the NYSE and higher on the Nasdaq exchange. Breadth was negative as decliners led advancers by a narrow margin on the NYSE and by a 5-3 margin on the Nasdaq exchange. Leadership remained thin as only 2 high-ranked companies from the Leaders List hit new 52-week highs and were listed on the BreakOuts Page. New 52-week lows totals again expanded and outnumbered shrinking new 52-week highs on the NYSE and on the Nasdaq exchange. The major indices have shown distributional action indicative of a market correction (M criteria). Greater caution is important for all investors. Always stand ready to protect against losses.
PICTURED: The Dow Jones Industrial Average is sinking well below its 50-day moving average (DMA) line with a recent spurt of losses.
ASML (ASML -7.1%) was the worst performer in the SOX after reporting weaker-than-expected Q1 bookings. NVIDIA (NVDA -3.9%) was another influential laggard.
The S&P 500 information technology sector (-1.7%) was the worst performing sector followed by the real estate sector (-0.8%). Meanwhile, the utilities sector (+2.1%) saw the largest gain by a wide margin, followed by the consumer staples (+0.5%) and materials (+0.2%) sectors.
Dow component Travelers (TRV -7.4%) was a standout loser. J.B. Hunt Transport (JBHT -8.1%) also logged a big loss after disappointing quarterly results. United Airlines (UAL +17.5%) was up big after pleasing quarterly results.
The 10-yr note yield settled seven basis points lower at 4.59%. The 2-yr note yield fell three basis points to 4.93%. A fresh $13 billion 20-yr bond auction was met with excellent demand. |
 Kenneth J. Gruneisen started out as a licensed stockbroker in August 1987, a couple of months prior to the historic stock market crash that took the Dow Jones Industrial Average down -22.6% in a single day. He has published daily fact-based fundamental and technical analysis on high-ranked stocks online for two decades. Through FACTBASEDINVESTING.COM, Kenneth provides educational articles, news, market commentary, and other information regarding proven investment systems that work in good times and bad.
Comments contained in the body of this report are technical opinions only and are not necessarily those of Gruneisen Growth Corp. The material herein has been obtained from sources believed to be reliable and accurate, however, its accuracy and completeness cannot be guaranteed. Our firm, employees, and customers may effect transactions, including transactions contrary to any recommendation herein, or have positions in the securities mentioned herein or options with respect thereto. Any recommendation contained in this report may not be suitable for all investors and it is not to be deemed an offer or solicitation on our part with respect to the purchase or sale of any securities. |
|
 |
Bank Index and Gold & Silver Index Rose
Kenneth J. Gruneisen - Passed the CAN SLIM® Master's Exam
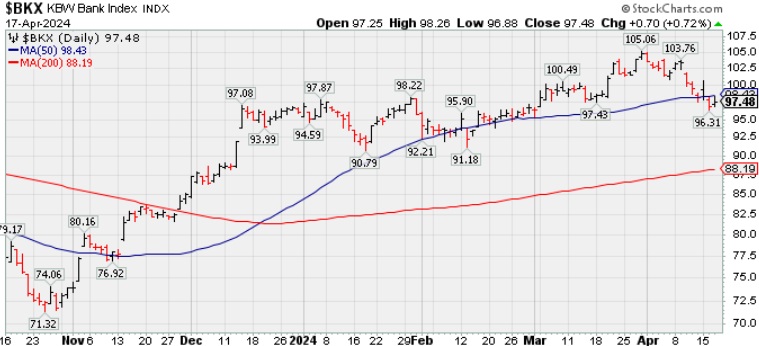
The Bank Index ($BKX +0.72%) rose while the Broker/Dealer Index ($XBD -0.21%) and the Retail Index ($RLX -0.82%) finished to the downside. The tech sector had a negative bias as the Semiconductor Index ($SOX -3.25%), Networking Index ($NWX -0.38%), and the Biotech Index ($BTK -0.83%) each ended lower. The Gold & Silver Index ($XAU +1.34%) rose while the Integrated Oil Index ($XOI -0.57%) and the Oil Services Index ($OSX -1.58%) ended the session with losses.
![]() PICTURED: The Bank Index ($BKX +0.72%) has slumped below its 50-day moving average (DMA) line with recent losses.
| Oil Services |
$OSX |
87.02 |
-1.40 |
-1.58% |
+3.75% |
| Integrated Oil |
$XOI |
2,159.05 |
-12.44 |
-0.57% |
+15.92% |
| Semiconductor |
$SOX |
4,567.31 |
-153.22 |
-3.25% |
+9.38% |
| Networking |
$NWX |
735.29 |
-2.82 |
-0.38% |
-11.71% |
| Broker/Dealer |
$XBD |
574.96 |
-1.21 |
-0.21% |
+3.17% |
| Retail |
$RLX |
4,348.26 |
-35.73 |
-0.82% |
+11.82% |
| Gold & Silver |
$XAU |
134.73 |
+1.78 |
+1.34% |
+7.19% |
| Bank |
$BKX |
97.48 |
+0.70 |
+0.72% |
+1.52% |
| Biotech |
$BTK |
4,938.66 |
-41.18 |
-0.83% |
-8.86% |
|
|
|
 |
Slumping Further Below 50-Day Moving Average Hurts Outlook
Kenneth J. Gruneisen - Passed the CAN SLIM® Master's Exam
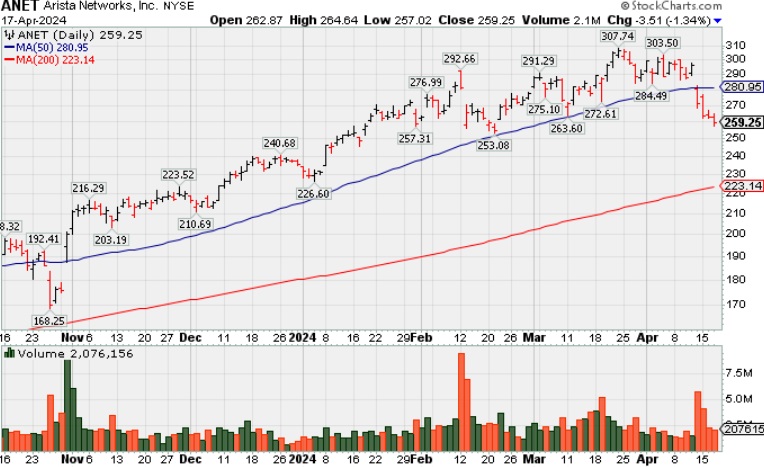
Arista Networks Inc (ANET -$3.51 or -1.34% to $259.25) fell further with today's 4th consecutive loss after noted when gapping down violating its 50-day moving average (DMA) line ($281.55) and an upward trendline connecting its October-March lows triggering technical sell signals.
ANET's color code was changed to yellow after forming a new flat base noted as a riskier "late stage" base. Following that it failed to produce a valid buy signal. ANET was featured in the 10/31/23 mid-day report (read here). It was last covered in detail in this FSU section on 3/26/24 with an annotated graph under the headline, "Consolidating Above Recent Highs and Above 50-Day Average".
Fundamentals remain strong. ANET currently has a 98 Earnings Per Share Rating. Through the Dec '23 quarter it has shown 8 consecutive quarterly comparisons with strong and steady earnings increases above the +25% minimum guideline (C criteria). Annual earnings (A criteria) had a downturn in FY '20 like many companies during the pandemic.
The number of top-rated funds owning its shares rose from 1,758 in Dec '21 to 2,591 in Feb '24, a reassuring sign concerning the I criteria. Its current Up/Down Volume Ratio of 0.7 is an unbiased indication its shares have been under distributional pressure over the past 50 days. The high-ranked Computer - Networking firm has a Timeliness Rating of A and a Sponsorship Rating of B. Its small supply of 253.2 million shares (S criteria) in the public float may contribute to greater volatility in the event of institutional buying or selling.
|
|
|
Color Codes Explained :
Y - Better candidates highlighted by our
staff of experts.
G - Previously featured
in past reports as yellow but may no longer be buyable under the
guidelines.
***Last / Change / Volume data in this table is the closing quote data***
Symbol/Exchange
Company Name
Industry Group |
PRICE |
CHANGE
(%Change) |
Day High |
Volume
(% DAV)
(% 50 day avg vol) |
52 Wk Hi
% From Hi |
Featured
Date |
Price
Featured |
Pivot Featured |
|
Max Buy |
 ANET
-
NYSE
ANET
-
NYSE
Arista Networks
Computer-Networking
|
$259.27
|
-3.49
-1.33% |
$264.64
|
2,525,865
91.19% of 50 DAV
50 DAV is 2,770,000
|
$307.74
-15.75%
|
3/18/2024
|
$188.84
|
PP = $292.76
|
|
MB = $307.40
|
 Most Recent Note - 4/17/2024 3:33:44 PM
Slumping further with today's 4th consecutive loss after noted when gapping down violating its 50 DMA line ($281.55) and an upward trendline connecting its October-March lows triggering technical sell signals. It will be dropped from the Featured Stocks list tonight. See the latest FSU analysis for more details and a new annotated graph.
>>> FEATURED STOCK ARTICLE : Slumping Further Below 50-Day Moving Average Hurts Outlook - 4/17/2024 |
View all notes |
Set NEW NOTE alert |
Company Profile |
SEC
News |
Chart |
Request a new note
C
A
S
I |
NVO
-
NYSE
Novo Nordisk ADR
Medical-Ethical Drugs
|
$124.53
|
+1.08
0.87% |
$125.21
|
3,074,903
60.99% of 50 DAV
50 DAV is 5,042,000
|
$138.28
-9.94%
|
3/1/2024
|
$124.23
|
PP = $124.97
|
|
MB = $131.22
|
Most Recent Note - 4/17/2024 3:56:57 PM
G - Color code is changed to green while sputtering below its 50 DMA line ($125.96) while volume totals have still been cooling. Losses below prior lows raised concerns and triggered a technical sell signal. A rebound above the 50 DMA line is needed for its outlook to improve.
>>> FEATURED STOCK ARTICLE : Volume Cools While Consolidating Above 50-Day Moving Average Line - 4/3/2024 |
View all notes |
Set NEW NOTE alert |
Company Profile |
SEC
News |
Chart |
Request a new note
C
A
S
I |
AXON
-
NASDAQ
Axon Enterprise
Security/Sfty
|
$299.82
|
-0.49
-0.16% |
$302.55
|
603,302
118.06% of 50 DAV
50 DAV is 511,000
|
$329.87
-9.11%
|
4/5/2024
|
$309.90
|
PP = $325.73
|
|
MB = $342.02
|
Most Recent Note - 4/17/2024 3:43:19 PM
Y - Testing its 50 DMA line ($298.68) today after 3 consecutive losses. Color code was changed to yellow with new pivot point cited based on its 3/04/24 high plus 10 cents. A gain above the pivot point backed by at least +40% above average volume is needed to trigger a proper technical buy signal. Fundamentals remain strong.
>>> FEATURED STOCK ARTICLE : Volume Totals Cooling While Building a New Base - 4/8/2024 |
View all notes |
Set NEW NOTE alert |
Company Profile |
SEC
News |
Chart |
Request a new note
C
A
S
I |
TDG
-
NYSE
TransDigm Group
Aerospace/Defense
|
$1,225.70
|
+2.55
0.21% |
$1,235.28
|
148,008
70.82% of 50 DAV
50 DAV is 209,000
|
$1,248.39
-1.82%
|
4/12/2024
|
$1,224.21
|
PP = $1,246.32
|
|
MB = $1,308.64
|
Most Recent Note - 4/17/2024 4:03:56 PM
Y - Color code is changed to yellow after holding its ground in a tight range near its all-time high. New pivot point was cited based on its 4/04/24 high plus 10 cents. Subsequent gains above the pivot point backed by at least +40% above average volume are needed to trigger a proper new technical buy signal. Its 50 DMA line ($1,187) defines near-term support to watch.
>>> FEATURED STOCK ARTICLE : Volume Totals Cooling While Perched Near High - 4/9/2024 |
View all notes |
Set NEW NOTE alert |
Company Profile |
SEC
News |
Chart |
Request a new note
C
A
S
I |
CRWD
-
NASDAQ
CrowdStrike Holdings
Computer Sftwr-Security
|
$293.69
|
-5.46
-1.83% |
$304.80
|
2,289,599
59.72% of 50 DAV
50 DAV is 3,834,000
|
$365.00
-19.54%
|
1/2/2024
|
$246.42
|
PP = $261.91
|
|
MB = $275.01
|
Most Recent Note - 4/17/2024 3:46:36 PM
Slumping further below its 50 DMA ($318.64) with a 4th consecutive loss on below-average volume. A rebound above the 50 DMA line is needed for its outlook to improve. It will be dropped from the Featured Stocks list tonight. Fundamentals remain strong after it reported Jan '24 quarterly earnings +102% on +33% sales revenues versus the year-ago period.
>>> FEATURED STOCK ARTICLE : 50-Day Moving Average Line Support Being Tested - 4/1/2024 |
View all notes |
Set NEW NOTE alert |
Company Profile |
SEC
News |
Chart |
Request a new note
C
A
S
I |
Symbol/Exchange
Company Name
Industry Group |
PRICE |
CHANGE
(%Change) |
Day High |
Volume
(% DAV)
(% 50 day avg vol) |
52 Wk Hi
% From Hi |
Featured
Date |
Price
Featured |
Pivot Featured |
|
Max Buy |
PCAR
-
NASDAQ
Paccar
Trucks and Parts-Hvy Duty
|
$115.93
|
-1.61
-1.37% |
$118.47
|
2,458,326
112.10% of 50 DAV
50 DAV is 2,193,000
|
$125.50
-7.63%
|
1/23/2024
|
$100.35
|
PP = $98.57
|
|
MB = $103.50
|
Most Recent Note - 4/17/2024 3:59:27 PM
G - Quietly pulling back from its all-time high testing its 50 DMA line ($115.25) which defines near-term support to watch. Fundamentals remain strong.
>>> FEATURED STOCK ARTICLE : Pulling Back From High and Slumping Toward 50-Day Moving Average - 4/12/2024 |
View all notes |
Set NEW NOTE alert |
Company Profile |
SEC
News |
Chart |
Request a new note
C
A
S
I |
HUBB
-
NYSE
Hubbell
Electrical-Power/Equipmt
|
$390.97
|
-5.31
-1.34% |
$397.99
|
396,855
97.27% of 50 DAV
50 DAV is 408,000
|
$429.61
-8.99%
|
1/30/2024
|
$343.26
|
PP = $336.83
|
|
MB = $353.67
|
Most Recent Note - 4/17/2024 3:48:23 PM
G - Pulling back testing its 50 DMA line ($389.24) which defines important support to watch. Slumping after a noted "negative reversal" at its all-time high on 4/04/24.
>>> FEATURED STOCK ARTICLE : Hubbell Perched at All-Time High After 5 Weekly Gains - 3/22/2024 |
View all notes |
Set NEW NOTE alert |
Company Profile |
SEC
News |
Chart |
Request a new note
C
A
S
I |
USLM
-
NASDAQ
U.S. Lime & Minerals
Bldg-Cement/Concrt/Ag
|
$292.55
|
+1.27
0.44% |
$294.51
|
28,950
125.87% of 50 DAV
50 DAV is 23,000
|
$308.00
-5.02%
|
2/9/2024
|
$254.68
|
PP = $265.09
|
|
MB = $278.34
|
Most Recent Note - 4/17/2024 4:04:26 PM
G - Still hovering in a tight range in recent weeks near its all-time high, stubbornly holding its ground despite encountering some distributional pressure. Its 50 DMA line ($279) defines near-term support to watch.
>>> FEATURED STOCK ARTICLE : Gain With Light Volume for Best Ever Close - 4/5/2024 |
View all notes |
Set NEW NOTE alert |
Company Profile |
SEC
News |
Chart |
Request a new note
C
A
S
I |
NOW
-
NYSE
ServiceNow
Computer Sftwr-Enterprse
|
$736.45
|
-8.33
-1.12% |
$748.99
|
721,624
63.30% of 50 DAV
50 DAV is 1,140,000
|
$815.32
-9.67%
|
2/22/2024
|
$771.75
|
PP = $815.32
|
|
MB = $856.09
|
Most Recent Note - 4/17/2024 3:51:20 PM
G - Color code is changed to green while sputtering under its 50 DMA line ($768.48). A rebound above the 50 DMA line is needed for its outlook to improve. Prior lows in the $730 area define the next important near-term support to watch.
>>> FEATURED STOCK ARTICLE : Quietly Consolidating Near 50-Day Moving Average Line - 4/11/2024 |
View all notes |
Set NEW NOTE alert |
Company Profile |
SEC
News |
Chart |
Request a new note
C
A
S
I |
SNPS
-
NASDAQ
Synopsys
Computer Sftwr-Design
|
$527.58
|
-13.51
-2.50% |
$546.67
|
1,120,851
107.05% of 50 DAV
50 DAV is 1,047,000
|
$629.38
-16.17%
|
2/22/2024
|
$600.65
|
PP = $582.85
|
|
MB = $611.99
|
Most Recent Note - 4/17/2024 4:03:16 PM
Slumped for a 4th consecutive loss today, falling further below its 50 DMA line ($568) and below the prior low ($546.91 on 3/15/23) where damaging losses raised concerns and triggered technical sell signals. It will be dropped from the Featured Stocks list tonight.
>>> FEATURED STOCK ARTICLE : Quietly Slumped Below 50-Day Moving Average Line - 4/10/2024 |
View all notes |
Set NEW NOTE alert |
Company Profile |
SEC
News |
Chart |
Request a new note
C
A
S
I |
Symbol/Exchange
Company Name
Industry Group |
PRICE |
CHANGE
(%Change) |
Day High |
Volume
(% DAV)
(% 50 day avg vol) |
52 Wk Hi
% From Hi |
Featured
Date |
Price
Featured |
Pivot Featured |
|
Max Buy |
PAY
-
NYSE
Paymentus Holdings
Finance-CrdtCard/PmtPr
|
$19.08
|
-0.33
-1.70% |
$19.56
|
162,846
42.41% of 50 DAV
50 DAV is 384,000
|
$25.21
-24.32%
|
3/5/2024
|
$19.97
|
PP = $18.89
|
|
MB = $19.83
|
Most Recent Note - 4/17/2024 3:58:12 PM
G - Testing its 50 DMA line ($19.38) which defines important near-term support above prior highs in the $18 range. More damaging losses would raise greater concerns.
>>> FEATURED STOCK ARTICLE : Consolidating After Powerful Breakout and Volume-Driven Gains - 3/27/2024 |
View all notes |
Set NEW NOTE alert |
Company Profile |
SEC
News |
Chart |
Request a new note
C
A
S
I |
HUBS
-
NYSE
HubSpot
Comp Sftwr-Spec Enterprs
|
$633.45
|
-0.40
-0.06% |
$656.88
|
556,939
106.90% of 50 DAV
50 DAV is 521,000
|
$693.85
-8.71%
|
4/4/2024
|
$686.66
|
PP = $660.10
|
|
MB = $693.11
|
Most Recent Note - 4/17/2024 3:49:47 PM
Y - Stalled after highlighted yellow in the 4/04/24 mid-day report with pivot point cited based on its 2/09/24 high plus 10 cents. Initial support is at its prior highs and its 50 DMA line ($624.57). Fundamentals remain strong. Faces some resistance due to old overhead supply up to the $866 level.
>>> FEATURED STOCK ARTICLE : Encountered Distributional Pressure and Finished Below Pivot Point - 4/4/2024 |
View all notes |
Set NEW NOTE alert |
Company Profile |
SEC
News |
Chart |
Request a new note
C
A
S
I |
|
|
|
THESE ARE NOT BUY RECOMMENDATIONS!
Comments contained in the body of this report are technical
opinions only. The material herein has been obtained
from sources believed to be reliable and accurate, however,
its accuracy and completeness cannot be guaranteed.
This site is not an investment advisor, hence it does
not endorse or recommend any securities or other investments.
Any recommendation contained in this report may not
be suitable for all investors and it is not to be deemed
an offer or solicitation on our part with respect to
the purchase or sale of any securities. All trademarks,
service marks and trade names appearing in this report
are the property of their respective owners, and are
likewise used for identification purposes only.
This report is a service available
only to active Paid Premium Members.
You may opt-out of receiving report notifications
at any time. Questions or comments may be submitted
by writing to Premium Membership Services 665 S.E. 10 Street, Suite 201 Deerfield Beach, FL 33441-5634 or by calling 1-800-965-8307
or 954-785-1121.
|
|
|