You are not logged in.
This means you
CAN ONLY VIEW reports that were published prior to Monday, April 14, 2025.
You
MUST UPGRADE YOUR MEMBERSHIP if you want to see any current reports.
AFTER MARKET UPDATE - TUESDAY, APRIL 16TH, 2013
Previous After Market Report Next After Market Report >>>
|
|
|
|
DOW |
+157.58 |
14,756.78 |
+1.08% |
|
Volume |
743,465,560 |
-24% |
|
Volume |
1,459,079,850 |
-16% |
|
NASDAQ |
+48.14 |
3,264.63 |
+1.50% |
|
Advancers |
2,501 |
79% |
|
Advancers |
1,926 |
75% |
|
S&P 500 |
+22.21 |
1,574.57 |
+1.43% |
|
Decliners |
539 |
17% |
|
Decliners |
555 |
22% |
|
Russell 2000 |
+16.12 |
923.30 |
+1.78% |
|
52 Wk Highs |
96 |
|
|
52 Wk Highs |
57 |
|
|
S&P 600 |
+8.42 |
516.66 |
+1.66% |
|
52 Wk Lows |
48 |
|
|
52 Wk Lows |
44 |
|
|
 |
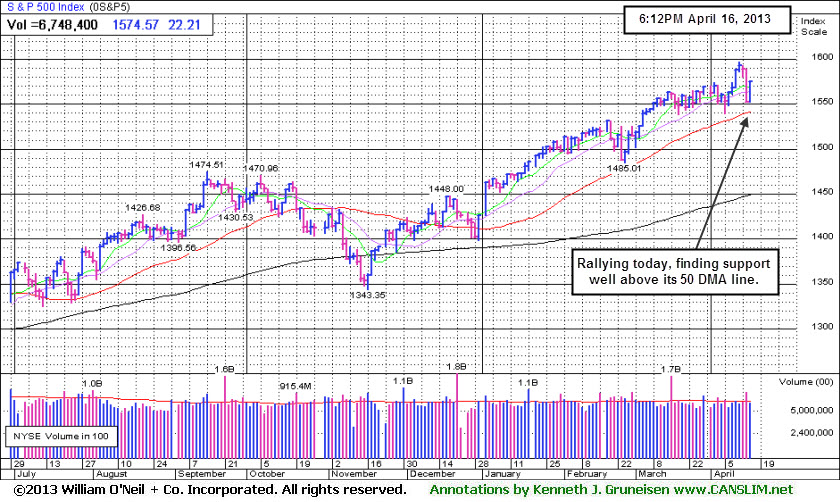
Major Averages Tally Gains With Lighter Volume Conviction
Kenneth J. Gruneisen - Passed the CAN SLIM® Master's Exam
The major averages experienced a turnaround on Tuesday bolstered by encouraging economic data and corporate earnings results. The volume totals on the exchanges were reported lighter than the prior session totals on the NYSE and on the Nasdaq exchange, however, indicating lackluster institutional buying demand. Breadth was solidly positive as advancers led decliners by nearly a 5 to 1 ratio on the NYSE and nearly a 4-1 ratio on the Nasdaq exchange. New 52-week highs totals expanded on both exchanges, and new 52-week lows outnumbered new 52-week highs on the Nasdaq exchange. There were 22 high-ranked companies from the CANSLIM.net Leaders List making new 52-week highs and appearing on the CANSLIM.net BreakOuts Page, up from the prior session total of 10 stocks. There were gains from all of the 16 high-ranked companies currently included on the Featured Stocks Page.
Before the open, a report showed housing starts unexpectedly climbed 7.0% in March to its highest level since June 2008. Another report showed consumer prices declined -0.2% last month. Excluding food and energy, the core CPI increased +0.1%. Industrial production rose +0.4% while capacity utilization edged up to 78.5% from a downwardly revised prior reading of 78.3%.
On the earnings front, Coca-Cola Co (KO +5.7%) and Johnson & Johnson (JNJ +2.12%) rallied after both companies posted positive quarterly results. Shares of W.W. Grainger Inc (GWW +7.17%) following the hardware supply distributor’s earnings beat and increased full-year forecast. In the financials, The Goldman Sachs Group Inc (GS -1.61%) fell and U.S. Bancorp (USB -1.77%) as revenues at both companies fell short of consensus estimates. Shares of International Paper Co (IP +4.7%) to pace the materials sector higher.
Treasuries were lower with the 10-year note down 12/32 to yield 1.72%.
The market's (M criteria) quick evaporation of leadership (stocks hitting new 52-week highs) and decisive pullback on higher volume is a sign of distribution which indicates the current rally is clearly under pressure. Investors should be watchful for technical sell signals and be ready to reduce market exposure if more damaging deterioration occurs in the near-term. New buying efforts are only justified in stocks meeting all key criteria, but investors should be especially cautious until broader strength returns. The most noteworthy and actionable leaders are listed on the Featured Stocks page.
Watch for an announcement via email concerning the next WEBCAST. The webcast will also be available via an updated link highlighted at the top of the Premium Member Homepage.
PICTURED: The S&P 500 Index rallied, finding support well above its 50-day moving average (DMA) line.
|
 Kenneth J. Gruneisen started out as a licensed stockbroker in August 1987, a couple of months prior to the historic stock market crash that took the Dow Jones Industrial Average down -22.6% in a single day. He has published daily fact-based fundamental and technical analysis on high-ranked stocks online for two decades. Through FACTBASEDINVESTING.COM, Kenneth provides educational articles, news, market commentary, and other information regarding proven investment systems that work in good times and bad.
Comments contained in the body of this report are technical opinions only and are not necessarily those of Gruneisen Growth Corp. The material herein has been obtained from sources believed to be reliable and accurate, however, its accuracy and completeness cannot be guaranteed. Our firm, employees, and customers may effect transactions, including transactions contrary to any recommendation herein, or have positions in the securities mentioned herein or options with respect thereto. Any recommendation contained in this report may not be suitable for all investors and it is not to be deemed an offer or solicitation on our part with respect to the purchase or sale of any securities. |
|
 |
Tech, Energy, Retail, and Financial Groups Rise
Kenneth J. Gruneisen - Passed the CAN SLIM® Master's Exam
The Retail Index ($RLX +0.87%) helped provide a positive influence for the major averages. The financial groups including the Broker/Dealer Index ($XBD +0.88%) and the Bank Index ($BKX +1.35%) also underpinned the market advance. Gains in energy-related shares helped the Oil Services Index ($OSX +1.54%) and the Integrated Oil Index ($XOI +1.25%) ratchet higher, and the Healthcare Index ($HMO +1.91%) also posted a solid gain. The Semiconductor Index ($SOX +2.17%) led the tech sector higher while the Biotechnology Index ($BTK +1.91%) and Internet Index ($IIX +1.30%) tallied solid gains and the Networking Index ($NWX +0.23%) also edged higher. Meanwhile, the Gold & Silver Index ($XAU -0.67%) sputtered for a small loss.
Charts courtesy www.stockcharts.com

PICTURED: The Semiconductor Index ($SOX +2.17%) is consolidating above its 50-day moving average (DMA) line after recently challenging its 2012 highs.
| Oil Services |
$OSX |
242.33 |
+3.67 |
+1.54% |
+10.07% |
| Healthcare |
$HMO |
2,962.45 |
+55.64 |
+1.91% |
+17.83% |
| Integrated Oil |
$XOI |
1,302.90 |
+16.09 |
+1.25% |
+4.92% |
| Semiconductor |
$SOX |
431.85 |
+9.18 |
+2.17% |
+12.44% |
| Networking |
$NWX |
226.47 |
+0.51 |
+0.23% |
-0.03% |
| Internet |
$IIX |
359.79 |
+4.63 |
+1.30% |
+10.03% |
| Broker/Dealer |
$XBD |
110.43 |
+0.96 |
+0.88% |
+17.07% |
| Retail |
$RLX |
742.64 |
+6.43 |
+0.87% |
+13.72% |
| Gold & Silver |
$XAU |
104.52 |
-0.71 |
-0.67% |
-36.88% |
| Bank |
$BKX |
55.64 |
+0.74 |
+1.35% |
+8.50% |
| Biotech |
$BTK |
1,854.82 |
+34.84 |
+1.91% |
+19.90% |
|
|
|
 |
Fundamental Concerns Remain While Hovering At Highs
Kenneth J. Gruneisen - Passed the CAN SLIM® Master's Exam
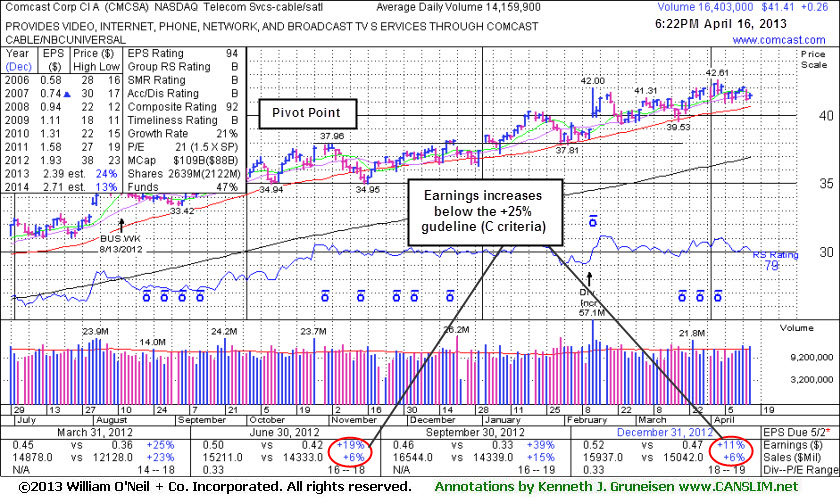
Comcast Corp Cl A (CMCSA +$0.26 or +0.63% to $41.41) is hovering near its 52-week high after finding recent support and rallying from its 50-day moving average (DMA) line. Its Relative Strength Rating has slumped to 79, just under the 80+ guideline for buy candidates. Fundamental concerns remain since it reported earnings +11% on +6% sales revenues for the Dec '12 quarter, below the +25% minimum guideline (C criteria). It was last shown in this FSU section on 3/19/13 with an annotated graph under the headline, "Weakening Fundamental and Technical Characteristics a Concern", while testing support at its 50-day moving average (DMA) line and enduring mild distributional pressure.
The high-ranked Telecom Services - Cable/Satellite firm's annual earnings (A criteria) history has been strong and leadership from other firms in the industry group is a reassuring sign concerning the L criteria. The number of top-rated funds owning its shares rose from 1,916 in Jun '11 to 2,273 in Mar '13, a reassuring sign concerning the I criteria. Its huge supply of 2.097 billion shares in the float could make it less likely to be a great sprinter, meanwhile, the S criteria calls for investors to usually look at small-cap or mid-cap companies.
|
|
|
Color Codes Explained :
Y - Better candidates highlighted by our
staff of experts.
G - Previously featured
in past reports as yellow but may no longer be buyable under the
guidelines.
***Last / Change / Volume data in this table is the closing quote data***
Symbol/Exchange
Company Name
Industry Group |
PRICE |
CHANGE
(%Change) |
Day High |
Volume
(% DAV)
(% 50 day avg vol) |
52 Wk Hi
% From Hi |
Featured
Date |
Price
Featured |
Pivot Featured |
|
Max Buy |
AMBA
-
NASDAQ
Ambarella Inc
ELECTRONICS - Semiconductor - Specialized
|
$13.74
|
+0.83
6.43% |
$13.80
|
332,701
94.01% of 50 DAV
50 DAV is 353,900
|
$16.00
-14.13%
|
3/26/2013
|
$15.31
|
PP = $14.83
|
|
MB = $15.57
|
 Most Recent Note - 4/16/2013 6:42:47 PM
Y - Rebounded today on near average volume after distributional losses. Near term support is at its 50 DMA line. Disciplined investors always limit losses by selling if any stock falls more than -7% from their purchase price.
>>> The latest Featured Stock Update with an annotated graph appeared on 3/26/2013. Click here.
View all notes |
Alert me of new notes |
CANSLIM.net Company Profile |
SEC |
Zacks Reports |
StockTalk |
News |
Chart |
Request a new note
C
A N
S L
I M


|
CELG
-
NASDAQ
Celgene Corp
DRUGS - Drug Manufacturers - Major
|
$122.50
|
+2.13
1.77% |
$123.00
|
2,472,457
78.38% of 50 DAV
50 DAV is 3,154,400
|
$124.10
-1.29%
|
3/27/2013
|
$113.24
|
PP = $115.54
|
|
MB = $121.32
|
Most Recent Note - 4/12/2013 3:09:14 PM
G - Color code is changed to green as it is now extended from any sound base pattern after wedging to new highs from an advanced "3-weeks tight" base with only average volume behind its gains
>>> The latest Featured Stock Update with an annotated graph appeared on 3/28/2013. Click here.
View all notes |
Alert me of new notes |
CANSLIM.net Company Profile |
SEC |
Zacks Reports |
StockTalk |
News |
Chart |
Request a new note
C
A N
S L
I M
|
CFNL
-
NASDAQ
Cardinal Financial Corp
BANKING - Regional - Southeast Banks
|
$16.53
|
+0.08
0.49% |
$16.58
|
226,956
111.36% of 50 DAV
50 DAV is 203,800
|
$18.40
-10.16%
|
3/22/2013
|
$17.99
|
PP = $18.29
|
|
MB = $19.20
|
Most Recent Note - 4/15/2013 8:03:11 PM
G - Color code is changed to green after today's 50 DMA line violation with a loss on above average volume triggered a technical sell signal
>>> The latest Featured Stock Update with an annotated graph appeared on 4/10/2013. Click here.
View all notes |
Alert me of new notes |
CANSLIM.net Company Profile |
SEC |
Zacks Reports |
StockTalk |
News |
Chart |
Request a new note
C
A N
S L
I M
|
CMCSA
-
NASDAQ
Comcast Corp Cl A
MEDIA - CATV Systems
|
$41.41
|
+0.26
0.63% |
$41.63
|
16,430,886
116.04% of 50 DAV
50 DAV is 14,159,900
|
$42.61
-2.82%
|
12/3/2012
|
$37.08
|
PP = $38.06
|
|
MB = $39.96
|
Most Recent Note - 4/16/2013 6:41:09 PM
G - Hovering near its 52-week high after finding recent support and rallying from its 50 DMA line. See the latest FSU analysis for more details and a new annotated graph.
>>> The latest Featured Stock Update with an annotated graph appeared on 4/16/2013. Click here.
View all notes |
Alert me of new notes |
CANSLIM.net Company Profile |
SEC |
Zacks Reports |
StockTalk |
News |
Chart |
Request a new note
C
A N
S L
I M
|
EVER
-
NYSE
Everbank Financial Corp
BANKING
|
$14.55
|
+0.02
0.14% |
$14.77
|
755,609
80.75% of 50 DAV
50 DAV is 935,700
|
$17.29
-15.85%
|
3/4/2013
|
$15.38
|
PP = $15.83
|
|
MB = $16.62
|
Most Recent Note - 4/12/2013 3:14:16 PM
G - Still holding its ground near its 50 DMA line ($15.15 now). That important short-term average has acted as support since damaging losses violated prior highs in the $16 area raising concerns while completely negating its prior technical breakout. Its Relative Strength (RS) rating has slumped to 70, below the 80+ minimum guideline for buy candidates.
>>> The latest Featured Stock Update with an annotated graph appeared on 4/2/2013. Click here.
View all notes |
Alert me of new notes |
CANSLIM.net Company Profile |
SEC |
Zacks Reports |
StockTalk |
News |
Chart |
Request a new note
C
A N
S L
I M
|
Symbol/Exchange
Company Name
Industry Group |
PRICE |
CHANGE
(%Change) |
Day High |
Volume
(% DAV)
(% 50 day avg vol) |
52 Wk Hi
% From Hi |
Featured
Date |
Price
Featured |
Pivot Featured |
|
Max Buy |
FLT
-
NYSE
Fleetcor Technologies
DIVERSIFIED SERVICES - Business/Management Services
|
$75.05
|
+1.24
1.68% |
$75.40
|
691,259
83.29% of 50 DAV
50 DAV is 829,900
|
$78.87
-4.84%
|
3/21/2013
|
$71.14
|
PP = $73.00
|
|
MB = $76.65
|
Most Recent Note - 4/15/2013 7:56:38 PM
Y - Enduring mild distributional pressure above prior highs in the $72 area defining near-term support above its 50 DMA line. See the latest FSU analysis for more details and a new annotated graph.
>>> The latest Featured Stock Update with an annotated graph appeared on 4/15/2013. Click here.
View all notes |
Alert me of new notes |
CANSLIM.net Company Profile |
SEC |
Zacks Reports |
StockTalk |
News |
Chart |
Request a new note
C
A N
S L
I M
|
LNKD
-
NYSE
Linkedin Corp Class A
INTERNET - Internet Information Providers
|
$182.47
|
+7.10
4.05% |
$182.93
|
2,362,055
93.96% of 50 DAV
50 DAV is 2,513,900
|
$186.06
-1.93%
|
4/12/2013
|
$182.69
|
PP = $184.25
|
|
MB = $193.46
|
Most Recent Note - 4/16/2013 6:43:53 PM
Y - Traded up today with lighter volume. Color code was changed to yellow with a new pivot point cited based on its 3/14/18 high plus 10 cents while forming a short 5-week flat base pattern. Volume-driven gains above the pivot point may trigger a new (or add-on) technical buy signal. Its 50 DMA line and recent low define important near-term chart support to watch.
>>> The latest Featured Stock Update with an annotated graph appeared on 4/5/2013. Click here.
View all notes |
Alert me of new notes |
CANSLIM.net Company Profile |
SEC |
Zacks Reports |
StockTalk |
News |
Chart |
Request a new note
C
A N
S L
I M
|
MIDD
-
NASDAQ
Middleby Corp
MANUFACTURING - Diversified Machinery
|
$145.61
|
+3.47
2.44% |
$146.77
|
106,713
116.88% of 50 DAV
50 DAV is 91,300
|
$154.74
-5.90%
|
10/8/2012
|
$118.46
|
PP = $122.67
|
|
MB = $128.80
|
Most Recent Note - 4/12/2013 3:24:15 PM
G - Its Relative Strength rating is 86 today, but the longer a stock lingers below its 50 DMA line the worse its outlook gets. Recent lows in the $144 area define important support to watch where violation may raise greater concerns. Fundamental concerns were recently noted.
>>> The latest Featured Stock Update with an annotated graph appeared on 3/25/2013. Click here.
View all notes |
Alert me of new notes |
CANSLIM.net Company Profile |
SEC |
Zacks Reports |
StockTalk |
News |
Chart |
Request a new note
C
A N
S L
I M
|
MNTX
-
NASDAQ
Manitex International
MANUFACTURING - Diversified Machinery
|
$10.75
|
+0.43
4.17% |
$10.83
|
108,879
52.70% of 50 DAV
50 DAV is 206,600
|
$13.14
-18.19%
|
3/20/2013
|
$11.29
|
PP = $12.05
|
|
MB = $12.65
|
Most Recent Note - 4/16/2013 6:45:48 PM
G - Rebounded near its 50 DMA line today with a gain on light volume. A rally above that important short-term average is needed for its outlook to improve.
>>> The latest Featured Stock Update with an annotated graph appeared on 4/12/2013. Click here.
View all notes |
Alert me of new notes |
CANSLIM.net Company Profile |
SEC |
Zacks Reports |
StockTalk |
News |
Chart |
Request a new note
C
A N
S L
I M
|
MRLN
-
NASDAQ
Marlin Business Services
DIVERSIFIED SERVICES - Rental and Leasing Services
|
$21.58
|
+0.48
2.27% |
$22.55
|
18,710
73.66% of 50 DAV
50 DAV is 25,400
|
$23.98
-10.01%
|
3/15/2013
|
$22.29
|
PP = $23.18
|
|
MB = $24.34
|
Most Recent Note - 4/15/2013 7:59:17 PM
G - Color code is changed to green after violating its 50 DMA line with a damaging loss on heavier volume today triggering a technical sell signal and raising concerns.
>>> The latest Featured Stock Update with an annotated graph appeared on 4/9/2013. Click here.
View all notes |
Alert me of new notes |
CANSLIM.net Company Profile |
SEC |
Zacks Reports |
StockTalk |
News |
Chart |
Request a new note
C
A N
S L
I M
|
Symbol/Exchange
Company Name
Industry Group |
PRICE |
CHANGE
(%Change) |
Day High |
Volume
(% DAV)
(% 50 day avg vol) |
52 Wk Hi
% From Hi |
Featured
Date |
Price
Featured |
Pivot Featured |
|
Max Buy |
MWIV
-
NASDAQ
M W I Veterinary Supply
HEALTH SERVICES - Medical Instruments and; Supplies
|
$125.06
|
+0.30
0.24% |
$125.74
|
48,489
79.88% of 50 DAV
50 DAV is 60,700
|
$137.18
-8.84%
|
3/4/2013
|
$130.90
|
PP = $129.45
|
|
MB = $135.92
|
Most Recent Note - 4/15/2013 8:01:13 PM
G - Color code is changed to green after today's loss violated its 50 DMA line triggering a technical sell signal. Only a prompt rebound above that important short-term average would help its outlook improve.
>>> The latest Featured Stock Update with an annotated graph appeared on 4/4/2013. Click here.
View all notes |
Alert me of new notes |
CANSLIM.net Company Profile |
SEC |
Zacks Reports |
StockTalk |
News |
Chart |
Request a new note
C
A N
S L
I M
|
N
-
NYSE
Netsuite Inc
DIVERSIFIED SERVICES - Business/Management Services
|
$79.26
|
+2.17
2.81% |
$79.30
|
258,536
67.77% of 50 DAV
50 DAV is 381,500
|
$80.33
-1.33%
|
12/12/2012
|
$64.75
|
PP = $67.12
|
|
MB = $70.48
|
Most Recent Note - 4/16/2013 6:47:10 PM
G - Hovering near its all-time high, extended after a recent streak of 7 consecutive weekly gains. Its 50 DMA line ($73.58 now) defines important near-term support to watch.
>>> The latest Featured Stock Update with an annotated graph appeared on 4/1/2013. Click here.
View all notes |
Alert me of new notes |
CANSLIM.net Company Profile |
SEC |
Zacks Reports |
StockTalk |
News |
Chart |
Request a new note
C
A N
S L
I M
|
NSR
-
NYSE
Neustar Inc
TELECOMMUNICATIONS - Diversified Communication Serv
|
$43.47
|
+1.09
2.57% |
$43.52
|
595,453
127.26% of 50 DAV
50 DAV is 467,900
|
$47.24
-7.98%
|
3/8/2013
|
$44.99
|
PP = $47.34
|
|
MB = $49.71
|
Most Recent Note - 4/16/2013 6:48:53 PM
Rebounded today with a gain backed by above average volume, but it is still below its 50 DMA line. Based on weak action it will be dropped from the Featured Stocks list tonight.
>>> The latest Featured Stock Update with an annotated graph appeared on 3/27/2013. Click here.
View all notes |
Alert me of new notes |
CANSLIM.net Company Profile |
SEC |
Zacks Reports |
StockTalk |
News |
Chart |
Request a new note
C
A N
S L
I M
|
PRLB
-
NYSE
Proto Labs Inc
MANUFACTURING - Small Tools and Accessories
|
$48.18
|
+1.77
3.81% |
$48.60
|
841,289
154.36% of 50 DAV
50 DAV is 545,000
|
$55.23
-12.76%
|
4/10/2013
|
$49.97
|
PP = $54.01
|
|
MB = $56.71
|
Most Recent Note - 4/16/2013 6:12:12 PM
Y - Managed a positive reversal today after dipping below its 50 DMA line, showing resilience near an important near-term support level. Abruptly reversed last week after hitting a new 52-week high and briefly trading above the pivot point cited based on its 2/13/13 high plus 10 cents. The latest FSU analysis includes more details and a new annotated graph under the headline, "Encountered Distributional Pressure After Trading Above Pivot Point"
>>> The latest Featured Stock Update with an annotated graph appeared on 4/11/2013. Click here.
View all notes |
Alert me of new notes |
CANSLIM.net Company Profile |
SEC |
Zacks Reports |
StockTalk |
News |
Chart |
Request a new note
C
A N
S L
I M
|
RRTS
-
NYSE
Roadrunner Trans Systems
TRANSPORTATION - Air Delivery and Freight Service
|
$23.05
|
+0.13
0.57% |
$23.15
|
119,943
60.39% of 50 DAV
50 DAV is 198,600
|
$23.88
-3.48%
|
4/3/2013
|
$22.77
|
PP = $23.75
|
|
MB = $24.94
|
Most Recent Note - 4/15/2013 12:00:51 PM
Y - Still perched near its 52-week high but pulling back today. Recent low and 50 DMA line define important near-term chart support to watch. Churned heavy volume recently but encountered resistance near prior highs. A solid volume-driven gain above its pivot point is still needed to trigger a new technical buy signal. Fundamentals remain strong enough to still satisfy the C and A criteria, however decelerating sales revenues and earnings increases in sequential quarterly comparisons through the Dec '12 quarter is a concern. Completed a new Public Offering on 12/06/12 and, technically, it broke out above previously stubborn resistance in $19 area with volume-driven gains in January.
>>> The latest Featured Stock Update with an annotated graph appeared on 4/3/2013. Click here.
View all notes |
Alert me of new notes |
CANSLIM.net Company Profile |
SEC |
Zacks Reports |
StockTalk |
News |
Chart |
Request a new note
C
A N
S L
I M
|
Symbol/Exchange
Company Name
Industry Group |
PRICE |
CHANGE
(%Change) |
Day High |
Volume
(% DAV)
(% 50 day avg vol) |
52 Wk Hi
% From Hi |
Featured
Date |
Price
Featured |
Pivot Featured |
|
Max Buy |
VRX
-
NYSE
Valeant Pharmaceuticals
DRUGS - Drug Manufacturers - Other
|
$73.09
|
+0.97
1.34% |
$73.38
|
755,184
55.54% of 50 DAV
50 DAV is 1,359,700
|
$76.56
-4.53%
|
12/20/2012
|
$60.24
|
PP = $61.21
|
|
MB = $64.27
|
Most Recent Note - 4/15/2013 11:47:27 AM
G - Still consolidating above its 50 DMA line ($69.84 now) defining important near-term support.
>>> The latest Featured Stock Update with an annotated graph appeared on 4/8/2013. Click here.
View all notes |
Alert me of new notes |
CANSLIM.net Company Profile |
SEC |
Zacks Reports |
StockTalk |
News |
Chart |
Request a new note
C
A N
S L
I M
|
|
|
|
THESE ARE NOT BUY RECOMMENDATIONS!
Comments contained in the body of this report are technical
opinions only. The material herein has been obtained
from sources believed to be reliable and accurate, however,
its accuracy and completeness cannot be guaranteed.
This site is not an investment advisor, hence it does
not endorse or recommend any securities or other investments.
Any recommendation contained in this report may not
be suitable for all investors and it is not to be deemed
an offer or solicitation on our part with respect to
the purchase or sale of any securities. All trademarks,
service marks and trade names appearing in this report
are the property of their respective owners, and are
likewise used for identification purposes only.
This report is a service available
only to active Paid Premium Members.
You may opt-out of receiving report notifications
at any time. Questions or comments may be submitted
by writing to Premium Membership Services 665 S.E. 10 Street, Suite 201 Deerfield Beach, FL 33441-5634 or by calling 1-800-965-8307
or 954-785-1121.
|
|
|

