You are not logged in.
This means you
CAN ONLY VIEW reports that were published prior to Tuesday, April 15, 2025.
You
MUST UPGRADE YOUR MEMBERSHIP if you want to see any current reports.
AFTER MARKET UPDATE - MONDAY, APRIL 15TH, 2013
Previous After Market Report Next After Market Report >>>
|
|
|
|
DOW |
-265.86 |
14,599.20 |
-1.79% |
|
Volume |
975,687,530 |
+39% |
|
Volume |
1,737,475,690 |
+22% |
|
NASDAQ |
-78.46 |
3,216.49 |
-2.38% |
|
Advancers |
377 |
12% |
|
Advancers |
279 |
11% |
|
S&P 500 |
-36.49 |
1,552.36 |
-2.30% |
|
Decliners |
2,702 |
86% |
|
Decliners |
2,246 |
87% |
|
Russell 2000 |
-35.67 |
907.18 |
-3.78% |
|
52 Wk Highs |
92 |
|
|
52 Wk Highs |
54 |
|
|
S&P 600 |
-18.20 |
508.24 |
-3.46% |
|
52 Wk Lows |
85 |
|
|
52 Wk Lows |
57 |
|
|
 |
Market Encountered More Distributional Pressure
Kenneth J. Gruneisen - Passed the CAN SLIM® Master's Exam
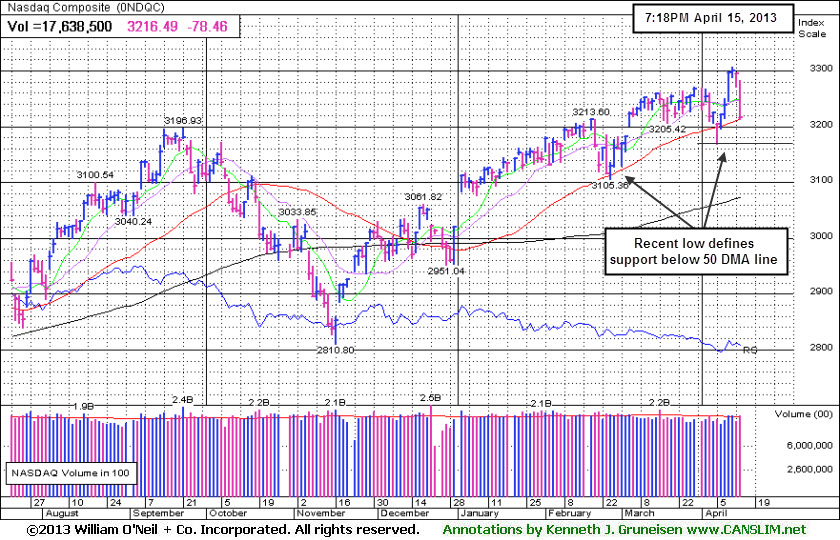
The Dow Jones Industrial Average, S&P 500 Index, and the Nasdaq Composite Index suffered unanimous losses on Monday. The volume totals on the exchanges were reported higher than the prior session totals on the NYSE and on the Nasdaq exchange, indicating heavier distributional pressure or selling from the institutional crowd. Breadth was solidly negative as decliners led advancers by 7 to 1 ratio on the NYSE and on the Nasdaq exchange. New 52-week highs totals contracted on both exchanges, and new 52-week lows outnumbered new 52-week highs on the Nasdaq exchange. There were only 10 high-ranked companies from the CANSLIM.net Leaders List making new 52-week highs and appearing on the CANSLIM.net BreakOuts Page, down from the prior session total of 35 stocks. There were unanimous losses for all 16 high-ranked companies currently included on the Featured Stocks Page.
The major averages fell on Monday and erased last week's gains. A batch of disappointing economic data prompted the sell-off. On our shores, manufacturing in the New York region expanded less than expected in April and homebuilder confidence unexpectedly fell for the third consecutive month. Meanwhile in the Pac-Rim, China's economic growth surprisingly slowed in the first-quarter, marking its longest streak of expansion below 8% in at least 20 years.
As a result, nearly all sectors lost ground. Materials and Energy paced the decline as commodities tumbled. Copper prices fell to the lowest level in over a year, crude oil hit a four-month low and gold experienced its biggest one-day percentage drop since 1980. In turn, Freeport-McMoRan Copper & Gold Inc (FCX -8.3%) and Exxon Mobil Corp (XOM -2.81%).
The more defensive Telecommunications group eked out minor gains thanks to Sprint Nextel Corp's (S +13.50%) rally after receiving a takeover bid from Dish Network Corp (DISH -2.29%).
In fixed-income, flight to safety bids pushed Treasury prices higher. The 10-year note gained 8/32 to yield 1.69% and the 30-year bond increased 28/32 to yield 2.87%.
The market's (M criteria) quick evaporation of leadership (stocks hitting new 52-week highs) and decisive pullback on higher volume is a sign of distribution which indicates the current rally is clearly under pressure. Investors should be watchful for technical sell signals and be ready to reduce market exposure if more damaging deterioration occurs in the near-term. New buying efforts are only justified in stocks meeting all key criteria, but investors should be especially cautious until broader strength returns. The most noteworthy and actionable leaders are listed on the Featured Stocks page.
Watch for an announcement via email concerning the next WEBCAST. The webcast will also be available via an updated link highlighted at the top of the Premium Member Homepage.
PICTURED: The Nasdaq Composite Index pulled back near its 50-day moving average (DMA) line. The recent low below that at short-term average defines the next important near-term chart support level to watch.
|
 Kenneth J. Gruneisen started out as a licensed stockbroker in August 1987, a couple of months prior to the historic stock market crash that took the Dow Jones Industrial Average down -22.6% in a single day. He has published daily fact-based fundamental and technical analysis on high-ranked stocks online for two decades. Through FACTBASEDINVESTING.COM, Kenneth provides educational articles, news, market commentary, and other information regarding proven investment systems that work in good times and bad.
Comments contained in the body of this report are technical opinions only and are not necessarily those of Gruneisen Growth Corp. The material herein has been obtained from sources believed to be reliable and accurate, however, its accuracy and completeness cannot be guaranteed. Our firm, employees, and customers may effect transactions, including transactions contrary to any recommendation herein, or have positions in the securities mentioned herein or options with respect thereto. Any recommendation contained in this report may not be suitable for all investors and it is not to be deemed an offer or solicitation on our part with respect to the purchase or sale of any securities. |
|
 |
Commodity-Linked Groups Display Weakest Action
Kenneth J. Gruneisen - Passed the CAN SLIM® Master's Exam
The classic "safe haven" group dove lower on Monday as the Gold & Silver Index ($XAU -9.57%) fell nearly -10% on the session. Energy-related shares were also very weak as the Oil Services Index ($OSX -4.31%) and the Integrated Oil Index ($XOI -3.79%) slid. The Networking Index ($NWX -3.70%), Biotechnology Index ($BTK -2.99%), Semiconductor Index ($SOX -2.53%), and Internet Index ($IIX -2.24%) suffered unanimous losses. The Broker/Dealer Index ($XBD -2.55%) and Bank Index ($BKX -2.33%) both lost ground, and the Retail Index ($RLX -2.27%) also weighed on the major averages with a loss. The Healthcare Index ($HMO -2.52%) rounded out the solidly negative session with a big loss.
Charts courtesy www.stockcharts.com
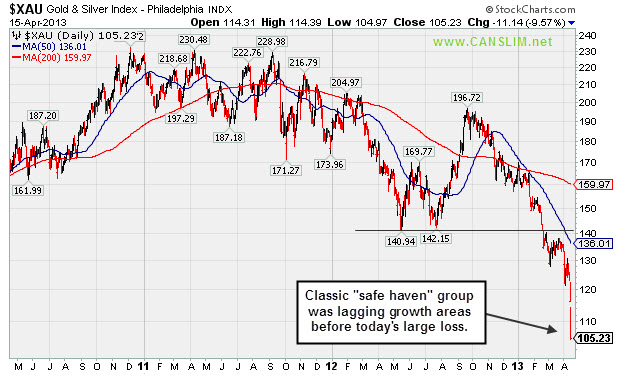
PICTURED: The classic "safe haven" group dove lower on Monday as the Gold & Silver Index ($XAU -9.57%) fell nearly -10% on the session. It was already lagging growth-oriented groups before the large tumble.
| Oil Services |
$OSX |
238.66 |
-10.76 |
-4.31% |
+8.40% |
| Healthcare |
$HMO |
2,906.81 |
-75.29 |
-2.52% |
+15.62% |
| Integrated Oil |
$XOI |
1,286.82 |
-50.63 |
-3.79% |
+3.62% |
| Semiconductor |
$SOX |
422.67 |
-10.96 |
-2.53% |
+10.05% |
| Networking |
$NWX |
225.96 |
-8.68 |
-3.70% |
-0.26% |
| Internet |
$IIX |
355.16 |
-8.14 |
-2.24% |
+8.61% |
| Broker/Dealer |
$XBD |
109.47 |
-2.87 |
-2.55% |
+16.05% |
| Retail |
$RLX |
736.21 |
-17.12 |
-2.27% |
+12.73% |
| Gold & Silver |
$XAU |
105.23 |
-11.14 |
-9.57% |
-36.46% |
| Bank |
$BKX |
54.90 |
-1.31 |
-2.33% |
+7.06% |
| Biotech |
$BTK |
1,819.98 |
-56.14 |
-2.99% |
+17.64% |
|
|
|
 |
Distributional Action Followed Latest Breakout After Little Progress
Kenneth J. Gruneisen - Passed the CAN SLIM® Master's Exam
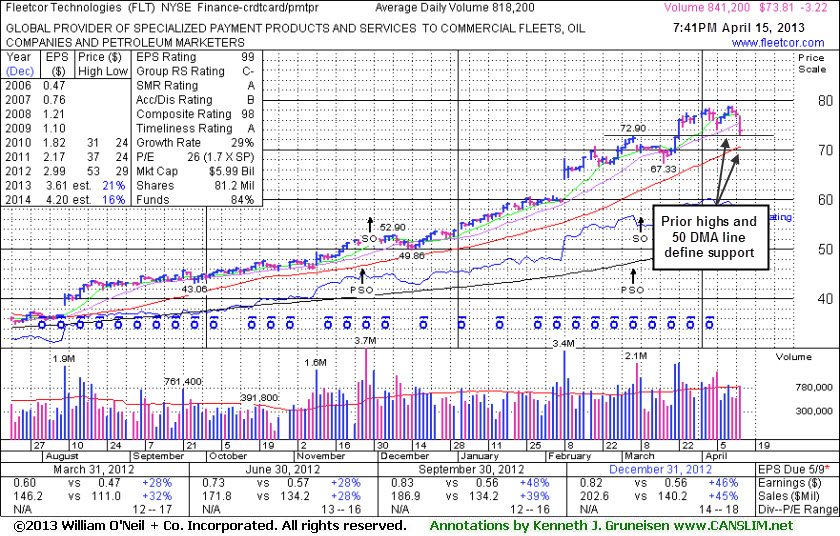
FleetCor Technologies, Inc. (FLT -$3.22 or -4.18% to $73.81) is consolidating above prior highs in the $72 area defining near-term support to watch above its 50-day moving average (DMA) line. It was last shown in this FSU section on 3/21/13 with an annotated graph under the headline, "Rallied Near Pivot Point of Advanced '3-Weeks Tight' Base ". Volume driven gains above the pivot point triggered a technical buy signal, but it made limited price progress before encountering distributional pressure. Losses on higher volume than the prior session are defined as "distribution" days. Disciplined investors always limit losses by selling if any stock falls more than -7% from their purchase price.
The company completed another Secondary Offering on 3/08/13 after a streak of volume-driven gains into new high territory. It reported earnings +46% on +45% sales for the Dec '12 quarter, marking its 4th consecutive quarterly comparison with earnings above the +25% guideline (C criteria). On 3/14/12, 6/11/12, and 11/29/12 it priced Secondary Offerings and it was previously noted, "Such offerings often are a short-term hindrance to upward price progress yet typically result in broader institutional ownership interest."
The number of top-rated funds owning its shares rose from 193 in Mar '12 to 316 in Mar '13, a reassuring sign concerning the I criteria. Its current Up/Down Volume Ratio of 1.9 is also an unbiased indication that its shares have been under accumulation over the past 50 days. The company hails from the Finance - Credit Card Payment Processing group which currently has a below average 31 Group Relative Strength Rating, however impressive strength and leadership from a couple of other firms in the same industry group is considered sufficient reassurance concerning the L criteria.
|
|
|
Color Codes Explained :
Y - Better candidates highlighted by our
staff of experts.
G - Previously featured
in past reports as yellow but may no longer be buyable under the
guidelines.
***Last / Change / Volume data in this table is the closing quote data***
Symbol/Exchange
Company Name
Industry Group |
PRICE |
CHANGE
(%Change) |
Day High |
Volume
(% DAV)
(% 50 day avg vol) |
52 Wk Hi
% From Hi |
Featured
Date |
Price
Featured |
Pivot Featured |
|
Max Buy |
AMBA
-
NASDAQ
Ambarella Inc
ELECTRONICS - Semiconductor - Specialized
|
$12.91
|
-1.08
-7.72% |
$13.99
|
520,356
148.72% of 50 DAV
50 DAV is 349,900
|
$16.00
-19.31%
|
3/26/2013
|
$15.31
|
PP = $14.83
|
|
MB = $15.57
|
 Most Recent Note - 4/15/2013 11:39:06 AM
Y - Enduring more distributional pressure today and slumping toward its 50 DMA line. Disciplined investors always limit losses by selling if any stock falls more than -7% from their purchase price.
>>> The latest Featured Stock Update with an annotated graph appeared on 3/26/2013. Click here.
View all notes |
Alert me of new notes |
CANSLIM.net Company Profile |
SEC |
Zacks Reports |
StockTalk |
News |
Chart |
Request a new note
C
A N
S L
I M


|
CELG
-
NASDAQ
Celgene Corp
DRUGS - Drug Manufacturers - Major
|
$120.37
|
-2.63
-2.14% |
$123.01
|
3,357,321
106.73% of 50 DAV
50 DAV is 3,145,500
|
$124.10
-3.01%
|
3/27/2013
|
$113.24
|
PP = $115.54
|
|
MB = $121.32
|
Most Recent Note - 4/12/2013 3:09:14 PM
G - Color code is changed to green as it is now extended from any sound base pattern after wedging to new highs from an advanced "3-weeks tight" base with only average volume behind its gains
>>> The latest Featured Stock Update with an annotated graph appeared on 3/28/2013. Click here.
View all notes |
Alert me of new notes |
CANSLIM.net Company Profile |
SEC |
Zacks Reports |
StockTalk |
News |
Chart |
Request a new note
C
A N
S L
I M
|
CFNL
-
NASDAQ
Cardinal Financial Corp
BANKING - Regional - Southeast Banks
|
$16.45
|
-0.79
-4.58% |
$17.23
|
446,550
224.62% of 50 DAV
50 DAV is 198,800
|
$18.40
-10.60%
|
3/22/2013
|
$17.99
|
PP = $18.29
|
|
MB = $19.20
|
Most Recent Note - 4/15/2013 8:03:11 PM
G - Color code is changed to green after today's 50 DMA line violation with a loss on above average volume triggered a technical sell signal
>>> The latest Featured Stock Update with an annotated graph appeared on 4/10/2013. Click here.
View all notes |
Alert me of new notes |
CANSLIM.net Company Profile |
SEC |
Zacks Reports |
StockTalk |
News |
Chart |
Request a new note
C
A N
S L
I M
|
CMCSA
-
NASDAQ
Comcast Corp Cl A
MEDIA - CATV Systems
|
$41.15
|
-0.85
-2.02% |
$41.87
|
13,544,455
94.13% of 50 DAV
50 DAV is 14,389,300
|
$42.61
-3.43%
|
12/3/2012
|
$37.08
|
PP = $38.06
|
|
MB = $39.96
|
Most Recent Note - 4/12/2013 3:12:51 PM
G - Hovering near its 52-week high after finding recent support and rallying from its 50 DMA line. Relative Strength Rating slumped to 79, just under the 80+ guideline for buy candidates. Fundamental concerns remain since it reported earnings +11% on +6% sales revenues for the Dec '12 quarter, below the +25% minimum guideline (C criteria).
>>> The latest Featured Stock Update with an annotated graph appeared on 3/19/2013. Click here.
View all notes |
Alert me of new notes |
CANSLIM.net Company Profile |
SEC |
Zacks Reports |
StockTalk |
News |
Chart |
Request a new note
C
A N
S L
I M
|
EVER
-
NYSE
Everbank Financial Corp
BANKING
|
$14.53
|
-0.60
-3.97% |
$15.05
|
398,376
42.29% of 50 DAV
50 DAV is 941,900
|
$17.29
-15.96%
|
3/4/2013
|
$15.38
|
PP = $15.83
|
|
MB = $16.62
|
Most Recent Note - 4/12/2013 3:14:16 PM
G - Still holding its ground near its 50 DMA line ($15.15 now). That important short-term average has acted as support since damaging losses violated prior highs in the $16 area raising concerns while completely negating its prior technical breakout. Its Relative Strength (RS) rating has slumped to 70, below the 80+ minimum guideline for buy candidates.
>>> The latest Featured Stock Update with an annotated graph appeared on 4/2/2013. Click here.
View all notes |
Alert me of new notes |
CANSLIM.net Company Profile |
SEC |
Zacks Reports |
StockTalk |
News |
Chart |
Request a new note
C
A N
S L
I M
|
Symbol/Exchange
Company Name
Industry Group |
PRICE |
CHANGE
(%Change) |
Day High |
Volume
(% DAV)
(% 50 day avg vol) |
52 Wk Hi
% From Hi |
Featured
Date |
Price
Featured |
Pivot Featured |
|
Max Buy |
FLT
-
NYSE
Fleetcor Technologies
DIVERSIFIED SERVICES - Business/Management Services
|
$73.81
|
-3.22
-4.18% |
$76.66
|
843,771
103.13% of 50 DAV
50 DAV is 818,200
|
$78.87
-6.42%
|
3/21/2013
|
$71.14
|
PP = $73.00
|
|
MB = $76.65
|
Most Recent Note - 4/15/2013 7:56:38 PM
Y - Enduring mild distributional pressure above prior highs in the $72 area defining near-term support above its 50 DMA line. See the latest FSU analysis for more details and a new annotated graph.
>>> The latest Featured Stock Update with an annotated graph appeared on 4/15/2013. Click here.
View all notes |
Alert me of new notes |
CANSLIM.net Company Profile |
SEC |
Zacks Reports |
StockTalk |
News |
Chart |
Request a new note
C
A N
S L
I M
|
LNKD
-
NYSE
Linkedin Corp Class A
INTERNET - Internet Information Providers
|
$175.37
|
-10.02
-5.40% |
$185.30
|
2,817,123
113.58% of 50 DAV
50 DAV is 2,480,300
|
$186.06
-5.75%
|
4/12/2013
|
$182.69
|
PP = $184.25
|
|
MB = $193.46
|
Most Recent Note - 4/12/2013 3:20:48 PM
Y - Color code is changed to yellow with a new pivot point cited based on its 3/14/18 high plus 10 cents while forming a short 5-week flat base pattern. Volume-driven gains above the pivot point may trigger a new (or add-on) technical buy signal. Its 50 DMA line and recent low define important near-term chart support to watch.
>>> The latest Featured Stock Update with an annotated graph appeared on 4/5/2013. Click here.
View all notes |
Alert me of new notes |
CANSLIM.net Company Profile |
SEC |
Zacks Reports |
StockTalk |
News |
Chart |
Request a new note
C
A N
S L
I M
|
MIDD
-
NASDAQ
Middleby Corp
MANUFACTURING - Diversified Machinery
|
$142.14
|
-5.20
-3.53% |
$148.00
|
114,227
126.50% of 50 DAV
50 DAV is 90,300
|
$154.74
-8.14%
|
10/8/2012
|
$118.46
|
PP = $122.67
|
|
MB = $128.80
|
Most Recent Note - 4/12/2013 3:24:15 PM
G - Its Relative Strength rating is 86 today, but the longer a stock lingers below its 50 DMA line the worse its outlook gets. Recent lows in the $144 area define important support to watch where violation may raise greater concerns. Fundamental concerns were recently noted.
>>> The latest Featured Stock Update with an annotated graph appeared on 3/25/2013. Click here.
View all notes |
Alert me of new notes |
CANSLIM.net Company Profile |
SEC |
Zacks Reports |
StockTalk |
News |
Chart |
Request a new note
C
A N
S L
I M
|
MNTX
-
NASDAQ
Manitex International
MANUFACTURING - Diversified Machinery
|
$10.32
|
-0.70
-6.35% |
$11.04
|
273,357
135.39% of 50 DAV
50 DAV is 201,900
|
$13.14
-21.46%
|
3/20/2013
|
$11.29
|
PP = $12.05
|
|
MB = $12.65
|
Most Recent Note - 4/15/2013 11:42:07 AM
G - Color code is changed to green. Violated its 50 DMA line today with a damaging loss on higher volume, also undercutting the recent low ($10.21 on 4/04/13), raising more serious concerns and triggering technical sell signals.
>>> The latest Featured Stock Update with an annotated graph appeared on 4/12/2013. Click here.
View all notes |
Alert me of new notes |
CANSLIM.net Company Profile |
SEC |
Zacks Reports |
StockTalk |
News |
Chart |
Request a new note
C
A N
S L
I M
|
MRLN
-
NASDAQ
Marlin Business Services
DIVERSIFIED SERVICES - Rental and Leasing Services
|
$21.10
|
-1.81
-7.90% |
$22.96
|
72,507
298.38% of 50 DAV
50 DAV is 24,300
|
$23.98
-12.01%
|
3/15/2013
|
$22.29
|
PP = $23.18
|
|
MB = $24.34
|
Most Recent Note - 4/15/2013 7:59:17 PM
G - Color code is changed to green after violating its 50 DMA line with a damaging loss on heavier volume today triggering a technical sell signal and raising concerns.
>>> The latest Featured Stock Update with an annotated graph appeared on 4/9/2013. Click here.
View all notes |
Alert me of new notes |
CANSLIM.net Company Profile |
SEC |
Zacks Reports |
StockTalk |
News |
Chart |
Request a new note
C
A N
S L
I M
|
Symbol/Exchange
Company Name
Industry Group |
PRICE |
CHANGE
(%Change) |
Day High |
Volume
(% DAV)
(% 50 day avg vol) |
52 Wk Hi
% From Hi |
Featured
Date |
Price
Featured |
Pivot Featured |
|
Max Buy |
MWIV
-
NASDAQ
M W I Veterinary Supply
HEALTH SERVICES - Medical Instruments and; Supplies
|
$124.76
|
-4.11
-3.19% |
$129.18
|
64,802
107.11% of 50 DAV
50 DAV is 60,500
|
$137.18
-9.05%
|
3/4/2013
|
$130.90
|
PP = $129.45
|
|
MB = $135.92
|
Most Recent Note - 4/15/2013 8:01:13 PM
G - Color code is changed to green after today's loss violated its 50 DMA line triggering a technical sell signal. Only a prompt rebound above that important short-term average would help its outlook improve.
>>> The latest Featured Stock Update with an annotated graph appeared on 4/4/2013. Click here.
View all notes |
Alert me of new notes |
CANSLIM.net Company Profile |
SEC |
Zacks Reports |
StockTalk |
News |
Chart |
Request a new note
C
A N
S L
I M
|
N
-
NYSE
Netsuite Inc
DIVERSIFIED SERVICES - Business/Management Services
|
$77.09
|
-2.01
-2.54% |
$79.31
|
262,205
67.88% of 50 DAV
50 DAV is 386,300
|
$80.33
-4.03%
|
12/12/2012
|
$64.75
|
PP = $67.12
|
|
MB = $70.48
|
Most Recent Note - 4/12/2013 3:31:14 PM
G - Perched at all-time highs, extended after a recent streak of 7 consecutive weekly gains. Its 50 DMA line ($73.74 now) defines important near-term support to watch.
>>> The latest Featured Stock Update with an annotated graph appeared on 4/1/2013. Click here.
View all notes |
Alert me of new notes |
CANSLIM.net Company Profile |
SEC |
Zacks Reports |
StockTalk |
News |
Chart |
Request a new note
C
A N
S L
I M
|
NSR
-
NYSE
Neustar Inc
TELECOMMUNICATIONS - Diversified Communication Serv
|
$42.38
|
-1.34
-3.06% |
$43.43
|
626,459
134.23% of 50 DAV
50 DAV is 466,700
|
$47.24
-10.29%
|
3/8/2013
|
$44.99
|
PP = $47.34
|
|
MB = $49.71
|
Most Recent Note - 4/12/2013 3:04:27 PM
G - It is lingering below its 50 DMA line but only -7.5% off its 52-week high. Building a possible "double bottom" base pattern, but no new pivot point is being cited. Its Relative Strength rating has slumped to 63, well below the 80+ minimum guideline for buy candidates.
>>> The latest Featured Stock Update with an annotated graph appeared on 3/27/2013. Click here.
View all notes |
Alert me of new notes |
CANSLIM.net Company Profile |
SEC |
Zacks Reports |
StockTalk |
News |
Chart |
Request a new note
C
A N
S L
I M
|
PRLB
-
NYSE
Proto Labs Inc
MANUFACTURING - Small Tools and Accessories
|
$46.41
|
-3.74
-7.46% |
$50.05
|
1,168,368
222.93% of 50 DAV
50 DAV is 524,100
|
$55.23
-15.97%
|
4/10/2013
|
$49.97
|
PP = $54.01
|
|
MB = $56.71
|
Most Recent Note - 4/15/2013 11:45:35 AM
Y - Slumping back toward its 50 DMA line today, defining important near-term support. Abruptly reversed last week after hitting a new 52-week high and briefly trading above the pivot point cited based on its 2/13/13 high plus 10 cents. The latest FSU analysis includes more details and a new annotated graph under the headline, "Encountered Distributional Pressure After Trading Above Pivot Point"
>>> The latest Featured Stock Update with an annotated graph appeared on 4/11/2013. Click here.
View all notes |
Alert me of new notes |
CANSLIM.net Company Profile |
SEC |
Zacks Reports |
StockTalk |
News |
Chart |
Request a new note
C
A N
S L
I M
|
RRTS
-
NYSE
Roadrunner Trans Systems
TRANSPORTATION - Air Delivery and Freight Service
|
$22.92
|
-0.58
-2.47% |
$23.54
|
274,800
140.42% of 50 DAV
50 DAV is 195,700
|
$23.88
-4.02%
|
4/3/2013
|
$22.77
|
PP = $23.75
|
|
MB = $24.94
|
Most Recent Note - 4/15/2013 12:00:51 PM
Y - Still perched near its 52-week high but pulling back today. Recent low and 50 DMA line define important near-term chart support to watch. Churned heavy volume recently but encountered resistance near prior highs. A solid volume-driven gain above its pivot point is still needed to trigger a new technical buy signal. Fundamentals remain strong enough to still satisfy the C and A criteria, however decelerating sales revenues and earnings increases in sequential quarterly comparisons through the Dec '12 quarter is a concern. Completed a new Public Offering on 12/06/12 and, technically, it broke out above previously stubborn resistance in $19 area with volume-driven gains in January.
>>> The latest Featured Stock Update with an annotated graph appeared on 4/3/2013. Click here.
View all notes |
Alert me of new notes |
CANSLIM.net Company Profile |
SEC |
Zacks Reports |
StockTalk |
News |
Chart |
Request a new note
C
A N
S L
I M
|
Symbol/Exchange
Company Name
Industry Group |
PRICE |
CHANGE
(%Change) |
Day High |
Volume
(% DAV)
(% 50 day avg vol) |
52 Wk Hi
% From Hi |
Featured
Date |
Price
Featured |
Pivot Featured |
|
Max Buy |
VRX
-
NYSE
Valeant Pharmaceuticals
DRUGS - Drug Manufacturers - Other
|
$72.12
|
-1.05
-1.44% |
$73.69
|
1,130,387
82.95% of 50 DAV
50 DAV is 1,362,700
|
$76.56
-5.80%
|
12/20/2012
|
$60.24
|
PP = $61.21
|
|
MB = $64.27
|
Most Recent Note - 4/15/2013 11:47:27 AM
G - Still consolidating above its 50 DMA line ($69.84 now) defining important near-term support.
>>> The latest Featured Stock Update with an annotated graph appeared on 4/8/2013. Click here.
View all notes |
Alert me of new notes |
CANSLIM.net Company Profile |
SEC |
Zacks Reports |
StockTalk |
News |
Chart |
Request a new note
C
A N
S L
I M
|
|
|
|
THESE ARE NOT BUY RECOMMENDATIONS!
Comments contained in the body of this report are technical
opinions only. The material herein has been obtained
from sources believed to be reliable and accurate, however,
its accuracy and completeness cannot be guaranteed.
This site is not an investment advisor, hence it does
not endorse or recommend any securities or other investments.
Any recommendation contained in this report may not
be suitable for all investors and it is not to be deemed
an offer or solicitation on our part with respect to
the purchase or sale of any securities. All trademarks,
service marks and trade names appearing in this report
are the property of their respective owners, and are
likewise used for identification purposes only.
This report is a service available
only to active Paid Premium Members.
You may opt-out of receiving report notifications
at any time. Questions or comments may be submitted
by writing to Premium Membership Services 665 S.E. 10 Street, Suite 201 Deerfield Beach, FL 33441-5634 or by calling 1-800-965-8307
or 954-785-1121.
|
|
|

