You are not logged in.
This means you
CAN ONLY VIEW reports that were published prior to Monday, February 26, 2024.
You
MUST UPGRADE YOUR MEMBERSHIP if you want to see any current reports.
AFTER MARKET UPDATE - WEDNESDAY, APRIL 15TH, 2020
Previous After Market Report Next After Market Report >>>
|
|
|
|
DOW |
-445.41 |
23,504.35 |
-1.86% |
|
Volume |
1,119,045,988 |
-3% |
|
Volume |
3,290,958,700 |
-11% |
|
NASDAQ |
-122.56 |
8,393.18 |
-1.44% |
|
Advancers |
481 |
17% |
|
Advancers |
743 |
23% |
|
S&P 500 |
-62.70 |
2,783.36 |
-2.20% |
|
Decliners |
2,418 |
83% |
|
Decliners |
2,479 |
77% |
|
Russell 2000 |
-53.36 |
1,183.98 |
-4.31% |
|
52 Wk Highs |
10 |
|
|
52 Wk Highs |
29 |
|
|
S&P 600 |
-35.37 |
695.73 |
-4.84% |
|
52 Wk Lows |
22 |
|
|
52 Wk Lows |
29 |
|
|
 |
Breadth Negative as Major Indices Pulled Back and Leadership Waned
Kenneth J. Gruneisen - Passed the CAN SLIM® Master's Exam
The Dow lost 445 points, while the S&P 500 declined 2.2%. The Nasdaq Composite slipped 1.4%. Breadth was negative as decliners led advancers by a 5-1 margin on the NYSE and by more than a 3-1 margin on the Nasdaq exchange. The reported volume totals were lighter than the prior session totals on the NYSE and on the Nasdaq exchange. Leadership waned as 14 high-ranked companies from the Leaders List hit new 52-week highs and were listed on the BreakOuts Page, versus 21 on the prior session. New 52-week lows outnumbered the new 52-week highs on the NYSE while the highs and new lows totals were evenly matched on the Nasdaq exchange. The major indices (M criteria) are in a new confirmed uptrend. Any sustainable rally requires a healthy crop of new leaders. Charts used courtesy of www.stockcharts.com
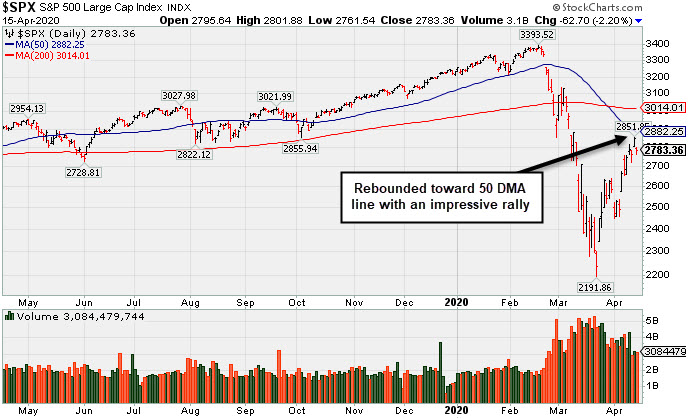
PICTURED: The S&P 500 Index has been rebounding toward its 50-day moving average (DMA) line. The follow-through day of big confirming gains on Monday, April 6th from the major indices on higher volume, coupled with an increase in the number of stocks hitting new highs, signaled a valid new market uptrend (M criteria).
U.S. equities finished lower Wednesday, attributed to investor sentiment shaken by disappointing corporate earnings results and downbeat economic data. All 11 S&P 500 sectors ended the session in negative territory, with Energy and Financials losing more than 4%. Some of Wall Street’s biggest banks reported a 40% drop in profit during the first quarter, citing sizeable cash reserves for potential loan defaults. Bank of America (BAC -6.49%), and Citigroup (C -5.64%) fell while Goldman Sachs (GS +0.16%) eked out a small gain after posting profits before the open. Elsewhere, airline companies reached a deal with the Treasury Department on a $25 billion relief package. Ten of the largest 12 airline operators intend to utilize the funds, which will require the companies to not furlough employees or cut pay through September 30th.
On the data front, retail sales slumped 8.7% in March, the worst contraction on record. A separate release revealed homebuilder sentiment plummeted in April to its worst level since June 2012. In central bank news, the Federal Reserve released its Beige Book, which showed the economy contracted “sharply and abruptly” with all 12 districts reporting “uncertain outlooks.” Treasuries strengthened, with the yield on the 10-year note dipping 11 basis points to 0.63%.
In commodities, WTI crude gained 1.3% to $20.37/barrel, despite tumbling more than 6% to its lowest point since 2002 in early trading. Oil prices endured a volatile session amid a report from the International Energy Agency (IEA), which projected a record 9.3 million barrel per day decline in 2020 demand. |
 Kenneth J. Gruneisen started out as a licensed stockbroker in August 1987, a couple of months prior to the historic stock market crash that took the Dow Jones Industrial Average down -22.6% in a single day. He has published daily fact-based fundamental and technical analysis on high-ranked stocks online for two decades. Through FACTBASEDINVESTING.COM, Kenneth provides educational articles, news, market commentary, and other information regarding proven investment systems that work in good times and bad.
Comments contained in the body of this report are technical opinions only and are not necessarily those of Gruneisen Growth Corp. The material herein has been obtained from sources believed to be reliable and accurate, however, its accuracy and completeness cannot be guaranteed. Our firm, employees, and customers may effect transactions, including transactions contrary to any recommendation herein, or have positions in the securities mentioned herein or options with respect thereto. Any recommendation contained in this report may not be suitable for all investors and it is not to be deemed an offer or solicitation on our part with respect to the purchase or sale of any securities. |
|
 |
Energy, Financial, Tech, and Retail Indexes Fell
Kenneth J. Gruneisen - Passed the CAN SLIM® Master's Exam
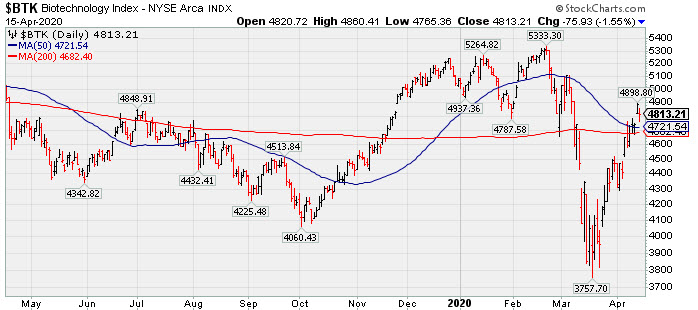
Energy-linked groups were standout decliners as the Oil Services Index ($OSX -6.90%) and the Integrated Oil Index ($XOI -5.84%) lost ground. The Broker/Dealer Index ($XBD -3.03%) and the Bank Index ($BKX -6.26%) both outpaced the Retail Index ($RLX -0.83%) to the downside. The tech sector had a negative bias as the Semiconductor Index ($SOX -2.82%), Biotech Index ($BTK -1.55%), and the Networking Index ($NWX -3.30%) unanimously lost ground. The Gold & Silver Index ($XAU -1.82%) also fell. PICTURED: The Biotech Index ($BTK -1.55%) has rebounded above its 50-day and 200-day moving average (DMA) lines from its March 2020 low.
| Oil Services |
$OSX |
25.83 |
-1.92 |
-6.92% |
-67.01% |
| Integrated Oil |
$XOI |
653.56 |
-40.52 |
-5.84% |
-48.56% |
| Semiconductor |
$SOX |
1,647.91 |
-47.85 |
-2.82% |
-10.91% |
| Networking |
$NWX |
494.08 |
-16.87 |
-3.30% |
-15.31% |
| Broker/Dealer |
$XBD |
227.32 |
-7.10 |
-3.03% |
-21.72% |
| Retail |
$RLX |
2,491.14 |
-20.89 |
-0.83% |
+1.71% |
| Gold & Silver |
$XAU |
104.29 |
-1.93 |
-1.82% |
-2.46% |
| Bank |
$BKX |
66.78 |
-4.47 |
-6.27% |
-41.09% |
| Biotech |
$BTK |
4,813.21 |
-75.93 |
-1.55% |
-5.02% |
|
|
|
 |
Featured Stocks
Kenneth J. Gruneisen - Passed the CAN SLIM® Master's Exam
As leadership improves the number of stocks covered in this area should be expected to increase gradually, as superior candidates are added to the Featured Stocks list on a case-by-case basis. Feel free to contact us if you have a need for any additional information. |
|
|
Color Codes Explained :
Y - Better candidates highlighted by our
staff of experts.
G - Previously featured
in past reports as yellow but may no longer be buyable under the
guidelines.
***Last / Change / Volume data in this table is the closing quote data***
|
|
|
THESE ARE NOT BUY RECOMMENDATIONS!
Comments contained in the body of this report are technical
opinions only. The material herein has been obtained
from sources believed to be reliable and accurate, however,
its accuracy and completeness cannot be guaranteed.
This site is not an investment advisor, hence it does
not endorse or recommend any securities or other investments.
Any recommendation contained in this report may not
be suitable for all investors and it is not to be deemed
an offer or solicitation on our part with respect to
the purchase or sale of any securities. All trademarks,
service marks and trade names appearing in this report
are the property of their respective owners, and are
likewise used for identification purposes only.
This report is a service available
only to active Paid Premium Members.
You may opt-out of receiving report notifications
at any time. Questions or comments may be submitted
by writing to Premium Membership Services 665 S.E. 10 Street, Suite 201 Deerfield Beach, FL 33441-5634 or by calling 1-800-965-8307
or 954-785-1121.
|
|
|