You are not logged in.
This means you
CAN ONLY VIEW reports that were published prior to Wednesday, April 9, 2025.
You
MUST UPGRADE YOUR MEMBERSHIP if you want to see any current reports.
AFTER MARKET UPDATE - THURSDAY, APRIL 16TH, 2020
Previous After Market Report Next After Market Report >>>
|
|
|
|
DOW |
+33.33 |
23,537.68 |
+0.14% |
|
Volume |
1,112,620,996 |
-1% |
|
Volume |
3,984,473,400 |
+21% |
|
NASDAQ |
+139.18 |
8,532.36 |
+1.66% |
|
Advancers |
1,084 |
38% |
|
Advancers |
1,462 |
45% |
|
S&P 500 |
+16.19 |
2,799.55 |
+0.58% |
|
Decliners |
1,803 |
62% |
|
Decliners |
1,770 |
55% |
|
Russell 2000 |
-5.89 |
1,178.09 |
-0.50% |
|
52 Wk Highs |
20 |
|
|
52 Wk Highs |
50 |
|
|
S&P 600 |
-4.31 |
691.42 |
-0.62% |
|
52 Wk Lows |
32 |
|
|
52 Wk Lows |
70 |
|
|
 |
Nasdaq Composite Leads Major Indices Higher
Kenneth J. Gruneisen - Passed the CAN SLIM® Master's Exam
The Dow added 33 points, while the S&P 500 gained 0.6%. The Nasdaq Composite jumped 1.7%. Breadth was negative as decliners led advancers by a 9-5 margin on the NYSE and by a 9-7 margin on the Nasdaq exchange. The reported volume totals were near the prior session total on the NYSE and higher on the Nasdaq exchange. Leadership improved as there were 29 high-ranked companies from the Leaders List that hit new 52-week highs and were listed on the BreakOuts Page, versus 14 on the prior session. New 52-week lows outnumbered the new 52-week highs on the NYSE and on the Nasdaq exchange. The major indices (M criteria) are in a new confirmed uptrend. Any sustainable rally requires a healthy crop of new leaders, so it is important to see continued improvement in this area. Charts used courtesy of www.stockcharts.com
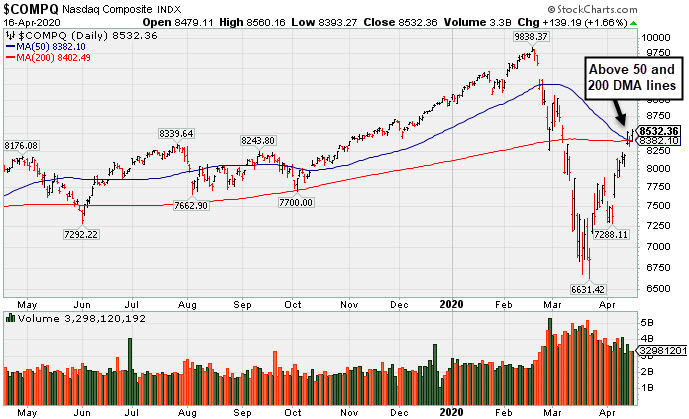
PICTURED: The Nasdaq Composite Index has rebounded above its 50-day and 200-day moving average (DMA) lines. The follow-through day of big confirming gains on Monday, April 6th from the major indices on higher volume, coupled with an increase in the number of stocks hitting new highs, signaled a valid new market uptrend (M criteria).
U.S. equities finished higher Thursday, as investors digested an influx of corporate earnings results, economic reports, and social distancing updates. Market participants are weighing the prospect of business activity resuming sooner than previously anticipated. Federal guidelines issued late Thursday call for states to have a “downward trajectory” in COVID-19 cases before starting a three-phase reopening process. President Trump tweeted that he will be holding a “major news conference” at 6:00 pm ET, which will include “flexible” guidelines for U.S. governors backed by medical experts on the reopening process.
Six of 11 S&P 500 sectors ended the session in positive territory, with Health Care stocks pacing gains. Abbott Laboratories (ABT +5.67%) spiked to a new all-time high following positive quarterly results, along with news that it is developing a mass screening coronavirus test. In other earnings, Morgan Stanley (MS -0.13%) sputtered after the bank’s profit declined 30% during the first quarter. Shares of BlackRock (BLK +3.50%) rose after beating revenue guidance despite a 1% fall in assets under management. Airlines underperformed, with United (UAL -11.46%) falling after stating demand for air travel has fallen to “essentially zero” with no signs of a near-term rebound.
On the data front, initial jobless claims came in at 5.2 million in the most recent week bringing the total number of jobs lost from the coronavirus to more than 22 million. Separate updates revealed housing starts slumped 22.3% in March, while building permits fell by 6.8% during the same period. Treasuries fluctuated, with the yield on the 10-year note ticking down two basis point to 0.61%. |
 Kenneth J. Gruneisen started out as a licensed stockbroker in August 1987, a couple of months prior to the historic stock market crash that took the Dow Jones Industrial Average down -22.6% in a single day. He has published daily fact-based fundamental and technical analysis on high-ranked stocks online for two decades. Through FACTBASEDINVESTING.COM, Kenneth provides educational articles, news, market commentary, and other information regarding proven investment systems that work in good times and bad.
Comments contained in the body of this report are technical opinions only and are not necessarily those of Gruneisen Growth Corp. The material herein has been obtained from sources believed to be reliable and accurate, however, its accuracy and completeness cannot be guaranteed. Our firm, employees, and customers may effect transactions, including transactions contrary to any recommendation herein, or have positions in the securities mentioned herein or options with respect thereto. Any recommendation contained in this report may not be suitable for all investors and it is not to be deemed an offer or solicitation on our part with respect to the purchase or sale of any securities. |
|
 |
Retail and Tech Indexes Rose; Energy-Linked Groups Fell Hard Again
Kenneth J. Gruneisen - Passed the CAN SLIM® Master's Exam
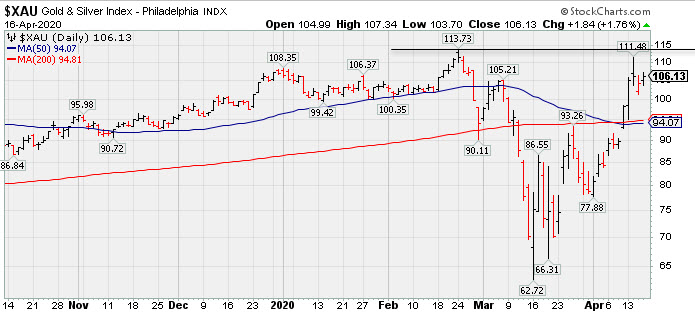
The Retail Index ($RLX +2.62%) posted a solid gain, but weakness in financials created a drag on the major indices as the Bank Index ($BKX -3.31%) outpaced the Broker/Dealer Index ($XBD -0.71%) to the downside. The Semiconductor Index ($SOX +2.61%) and Biotech Index ($BTK +3.13%) both posted solid gains while the Networking Index ($NWX +0.77%) posted a smaller gain. The Gold & Silver Index ($XAU +1.76%) also rose. Energy-linked groups were standout decliners as the Oil Services Index ($OSX -5.99%) and the Integrated Oil Index ($XOI -4.88%) lost ground. PICTURED: The Gold & Silver Index ($XAU +1.76%) has rebounded above its 50-day and 200-day moving average (DMA) lines from its March 2020 low, nearly challenging its 52-week high.
| Oil Services |
$OSX |
24.29 |
-1.54 |
-5.96% |
-68.97% |
| Integrated Oil |
$XOI |
621.67 |
-31.90 |
-4.88% |
-51.07% |
| Semiconductor |
$SOX |
1,690.87 |
+42.96 |
+2.61% |
-8.58% |
| Networking |
$NWX |
497.88 |
+3.80 |
+0.77% |
-14.66% |
| Broker/Dealer |
$XBD |
225.71 |
-1.61 |
-0.71% |
-22.27% |
| Retail |
$RLX |
2,556.40 |
+65.26 |
+2.62% |
+4.37% |
| Gold & Silver |
$XAU |
106.13 |
+1.84 |
+1.76% |
-0.74% |
| Bank |
$BKX |
64.57 |
-2.21 |
-3.31% |
-43.04% |
| Biotech |
$BTK |
4,963.97 |
+150.76 |
+3.13% |
-2.04% |
|
|
|
 |
Featured Stocks
Kenneth J. Gruneisen - Passed the CAN SLIM® Master's Exam
As leadership improves the number of stocks covered in this area should be expected to increase gradually, as superior candidates are added to the Featured Stocks list on a case-by-case basis. Feel free to contact us if you have a need for any additional information. |
|
|
Color Codes Explained :
Y - Better candidates highlighted by our
staff of experts.
G - Previously featured
in past reports as yellow but may no longer be buyable under the
guidelines.
***Last / Change / Volume data in this table is the closing quote data***
|
|
|
THESE ARE NOT BUY RECOMMENDATIONS!
Comments contained in the body of this report are technical
opinions only. The material herein has been obtained
from sources believed to be reliable and accurate, however,
its accuracy and completeness cannot be guaranteed.
This site is not an investment advisor, hence it does
not endorse or recommend any securities or other investments.
Any recommendation contained in this report may not
be suitable for all investors and it is not to be deemed
an offer or solicitation on our part with respect to
the purchase or sale of any securities. All trademarks,
service marks and trade names appearing in this report
are the property of their respective owners, and are
likewise used for identification purposes only.
This report is a service available
only to active Paid Premium Members.
You may opt-out of receiving report notifications
at any time. Questions or comments may be submitted
by writing to Premium Membership Services 665 S.E. 10 Street, Suite 201 Deerfield Beach, FL 33441-5634 or by calling 1-800-965-8307
or 954-785-1121.
|
|
|