You are not logged in.
This means you
CAN ONLY VIEW reports that were published prior to Monday, April 14, 2025.
You
MUST UPGRADE YOUR MEMBERSHIP if you want to see any current reports.
AFTER MARKET UPDATE - THURSDAY, APRIL 15TH, 2010
Previous After Market Report Next After Market Report >>>
|
|
|
|
DOW |
+21.46 |
11,144.57 |
+0.19% |
|
Volume |
1,198,622,960 |
+5% |
|
Volume |
2,697,578,210 |
-10% |
|
NASDAQ |
+10.83 |
2,515.69 |
+0.43% |
|
Advancers |
1,458 |
46% |
|
Advancers |
1,520 |
54% |
|
S&P 500 |
+1.02 |
1,211.67 |
+0.08% |
|
Decliners |
1,560 |
49% |
|
Decliners |
1,197 |
42% |
|
Russell 2000 |
+1.81 |
724.21 |
+0.25% |
|
52 Wk Highs |
510 |
|
|
52 Wk Highs |
367 |
|
|
S&P 600 |
+0.56 |
382.88 |
+0.15% |
|
52 Wk Lows |
4 |
|
|
52 Wk Lows |
9 |
|
|
 |
Stocks Rise As Earnings News Encourages Buyers
Adam Sarhan, Contributing Writer,
Stocks ended higher on Thursday as investors digested Wednesday's large move and the latest round of earnings and economic data. The volume total on the NYSE was reported slightly higher, yet the Nasdaq exchange volume was lower compared to Wednesday's totals. Advancers led decliners by a 5-to-4 ratio on the Nasdaq exchange while on the NYSE decliners slightly outnumbered advancers. New 52-week highs easily trumped new lows on both exchanges. There were 89 high-ranked companies from the CANSLIM.net Leaders List that made a new 52-week high and appeared on the CANSLIM.net BreakOuts Page, higher than the 86 issues that appeared on the prior session. A healthy crop of new leaders making new highs bodes well for any market rally. Regular readers know we have repeatedly noted in this commentary -"the recent expansion in leadership has been a welcome improvement."
Before Thursday's open, the Labor Department said weekly jobless claims unexpectedly climbed to 484,000, which is a two month high. The four-week moving average of initial claims, which smooths out the weekly data, rose to 457,750 last week, from 450,250. Elsewhere, the Federal Reserve said factory production rose +0.9% after rising +0.2% in February which topped analyst estimates.
At this point, earnings have been positive, evidenced by the slew of stronger than expected results from several high profile companies. After Thursday's close, tech giant, Google Inc. (GOOG +1.07%) released another robust quarterly report but traded slightly lower in the after market as investors digest the numbers. Google's Q1 earnings rose +31% vs the same period in 2009 while sales jumped +23%. Medical giant, Intuitive Surgical, Inc. (ISRG +1.06%) easily topped estimates when they reported another outstanding quarter. The company said earnings surged +194% versus Q1 2009 while sales jumped a very impressive +74%.
Professional Money Management Services- Free Portfolio Review:
Our skilled team of portfolio managers knows how to follow the rules of this fact-based investment system. If your portfolio is greater than $100,000 and you would like a free portfolio review, Click Here to get connected with one of our portfolio managers. ** Serious inquires only, please.
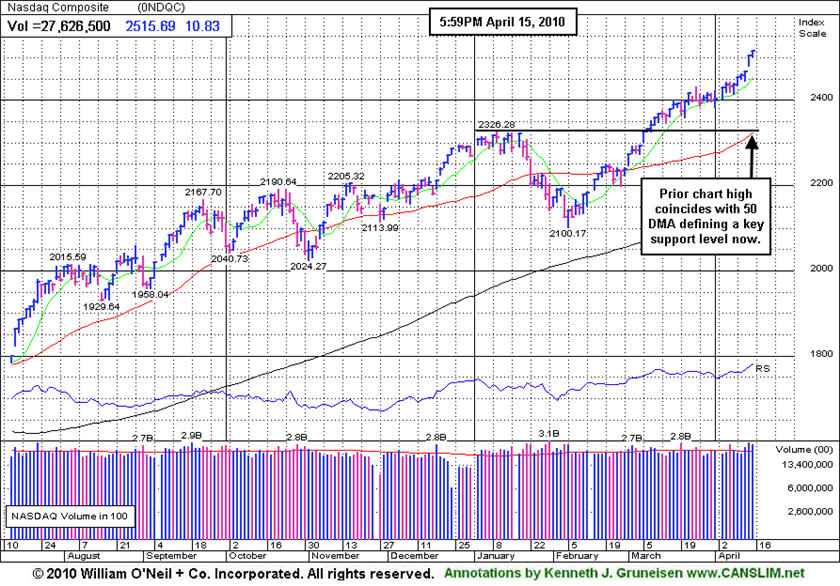
PICTURED: The Nasdaq Composite Index posted a 6th consecutive gain on Thursday and it was its 3rd straight session with above average volume while climbing to new recovery highs. Since the March 1, 2010 follow-though-day (FTD) a handful of distribution days has not been the least bit damaging to the market's confirmed rally.
|
|
|
 |
Broker/Dealer Index Edged Higher For 10th Straight Gain
Kenneth J. Gruneisen - Passed the CAN SLIM® Master's Exam
The Bank Index ($BKX -0.91%) ended with a small loss on Thursday while the Broker/Dealer Index ($XBD +0.03%) held its ground. The tech sector was mixed as the Biotechnology Index ($BTK -0.52%) and Networking Index ($NWX -0.29%) closed modestly lower, the Internet Index ($IIX +0.27%) and Semiconductor Index ($SOX +0.28%) posted modest gains. There were small gains for the Retail Index ($RLX +0.41%) and Healthcare Index ($HMO +0.41%) and energy shares' slightly positive bias helped the Integrated Oil Index ($XOI +0.15%) and Oil Services Index ($OSX +0.32%) edged higher. Meanwhile, the Gold & Silver Index ($XAU -1.04%) was a laggard.
Charts courtesy www.stockcharts.com
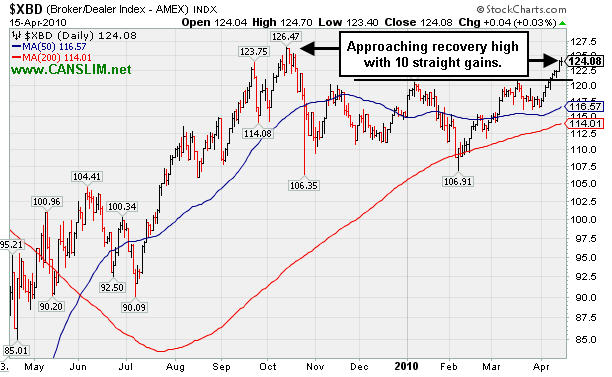
PICTURED: The Broker/Dealer Index ($XBD +0.03%) has been approaching its recovery high, with a small gain extending its winning streak to 10 straight gains.
| Oil Services |
$OSX |
216.06 |
+0.68 |
+0.32% |
+10.85% |
| Healthcare |
$HMO |
1,517.91 |
+6.27 |
+0.41% |
+3.05% |
| Integrated Oil |
$XOI |
1,130.47 |
+1.69 |
+0.15% |
+5.83% |
| Semiconductor |
$SOX |
398.86 |
+1.13 |
+0.28% |
+10.82% |
| Networking |
$NWX |
274.53 |
-0.82 |
-0.30% |
+18.81% |
| Internet |
$IIX |
261.14 |
+0.71 |
+0.27% |
+11.67% |
| Broker/Dealer |
$XBD |
124.15 |
+0.11 |
+0.09% |
+7.91% |
| Retail |
$RLX |
482.23 |
+1.98 |
+0.41% |
+17.30% |
| Gold & Silver |
$XAU |
173.06 |
-1.81 |
-1.04% |
+2.86% |
| Bank |
$BKX |
56.71 |
-0.52 |
-0.91% |
+32.78% |
| Biotech |
$BTK |
1,237.86 |
-6.76 |
-0.54% |
+31.39% |
|
|
|
 |
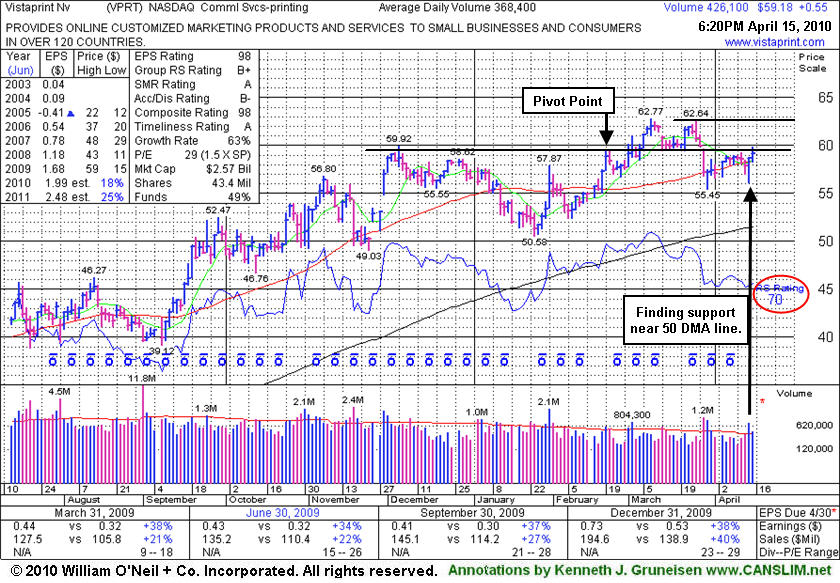
Finding Support Near 50-Day Average; Possible New Base Forming
Kenneth J. Gruneisen - Passed the CAN SLIM® Master's Exam
Vistaprint Nv. (VPRT +$0.55 or +0.94% to $59.18) posted a gain today, and it recently has been finding impressive support near its 50-day moving average (DMA) line. A subsequent violation of the short-term average or recent chart low ($55.45) would raise concerns and trigger technical sell signals. It is still too early to consider its $62.64 high a valid new pivot point for a "double bottom" type base, as it has only been consolidating for 6 weeks since peaking at $62.77. The minimum length for a proper double bottom base is 8 weeks. If it undercuts the recent chart low ($55.45) and then rebounds, today's high may end up being the pivot point of a double bottom base of sufficient length. In a proper double bottom base, the second low undercuts an earlier low, and the pivot point its the middle high of the "W" pattern formed.
The Netherlands headquartered high-ranked Commercial Services - Printing firm is known for its aggressive online advertising for a small order of free business cards. The C and A criteria are satisfied as the company has demonstrated solid quarterly sales revenues and earnings increases (above the +25% minimum guideline) and it has a good annual earnings history. Technically, however, its Relative Strength rank (see red circle) has slumped to 70 from 82 since it was featured in the March 2010 CANSLIM.net News monthly newsletter (read here). As previously noted, "Its gain on 3/02/10 was below the volume guidelines for buyable breakouts under the investment system. The stock needed to produce gains above its $59.70 pivot point with +50% above average volume or greater to trigger a solid technical buy signal.
|
|
|
Color Codes Explained :
Y - Better candidates highlighted by our
staff of experts.
G - Previously featured
in past reports as yellow but may no longer be buyable under the
guidelines.
***Last / Change / Volume quote data in this table corresponds with the timestamp on the note***
Symbol/Exchange
Company Name
Industry Group |
Last |
Chg. |
Vol
% DAV |
Date Featured |
Price Featured |
Latest Pivot Point
Featured |
Status |
| Latest Max Buy Price |
ARUN
- NASDAQ
Aruba Networks Inc
COMPUTER HARDWARE - Networking & Communication Dev
|
$13.56
|
-0.33
|
1,415,718
88% DAV
1,607,200
|
2/19/2010
(Date
Featured) |
$12.71
(Price
Featured) |
PP = $11.94 |
G |
| MB = $12.54 |
Most Recent Note - 4/15/2010 4:41:50 PM
G - Gapped down today after an analyst downgrade, yet finished near the session high with a small loss on below average volume. Its 50 DMA line and recent chart low ($12.21 on 3/19/10) are support levels to watch.
>>> The latest Featured Stock Update with an annotated graph appeared on 3/31/2010. click here.
|
|
C
A
S
I |
News |
Chart |
SEC
View all notes Alert
me of new notes
Company
Profile
|
BIDU
- NASDAQ
Baidu Inc Ads
INTERNET - Internet Information Providers
|
$648.96
|
+11.30
|
1,686,388
104% DAV
1,627,700
|
1/13/2010
(Date
Featured) |
$431.25
(Price
Featured) |
PP = $426.75 |
G |
| MB = $448.09 |
Most Recent Note - 4/15/2010 4:45:16 PM
G - Today it hit another new all-time high with its 6th consecutive gain. It has been repeatedly noted as extended from any sound base after 10 consecutive weekly gains, however it could produce more climactic gains, especially due to the small supply (S criteria) of shares outstanding.
>>> The latest Featured Stock Update with an annotated graph appeared on 3/24/2010. click here.
|
|
C
A
S
I |
News |
Chart |
SEC
View all notes Alert
me of new notes
Company
Profile
|
BPI
- NYSE
Bridgepoint Education
DIVERSIFIED SERVICES - Education &; Training Services
|
$26.28
|
+0.02
|
173,526
42% DAV
415,700
|
4/13/2010
(Date
Featured) |
$25.59
(Price
Featured) |
PP = $25.76 |
Y |
| MB = $27.05 |
Most Recent Note - 4/15/2010 4:47:19 PM
Y- Holding its ground since hitting a new 52 week high and appearing in yellow in the 4/13/10 mid-day report (read here), when it triggered a new technical buy signal as it rose from a cup-with-high-handle
>>> The latest Featured Stock Update with an annotated graph appeared on 4/13/2010. click here.
|
|
C
A
S
I |
News |
Chart |
SEC
View all notes Alert
me of new notes
Company
Profile
|
BRLI
- NASDAQ
Bio Reference Labs Inc
HEALTH SERVICES - Medical Laboratories & Researc
|
$46.71
|
+0.12
|
54,841
55% DAV
98,900
|
2/12/2010
(Date
Featured) |
$39.02
(Price
Featured) |
PP = $40.97 |
G |
| MB = $43.02 |
Most Recent Note - 4/15/2010 4:52:25 PM
G - Today's gain on light volume for a new high close was its 7th consecutive gain after consolidating for 4 weeks well above its 50 DMA line. Its recent chart low ($42.54 on 3/26/10) is an initial support level to watch near its short-term average.
>>> The latest Featured Stock Update with an annotated graph appeared on 3/22/2010. click here.
|
|
C
A
S
I |
News |
Chart |
SEC
View all notes Alert
me of new notes
Company
Profile
|
CISG
- NASDAQ
Cninsure Inc Ads
INSURANCE - Insurance Brokers
|
$28.49
|
+0.22
|
166,327
71% DAV
234,500
|
3/3/2010
(Date
Featured) |
$24.38
(Price
Featured) |
PP = $23.10 |
G |
| MB = $24.26 |
Most Recent Note - 4/15/2010 4:56:10 PM
G - After a small gap down today it rebounded to close with a small gain for a new all-time high. Recently noted -"extended from a sound base, yet no overhead supply remains to act as resistance." It has traded up as much as +17.4% since featured in yellow in the 3/03/10 mid-day report (read here).
>>> The latest Featured Stock Update with an annotated graph appeared on 3/23/2010. click here.
|
|
C
A
S
I |
News |
Chart |
SEC
View all notes Alert
me of new notes
Company
Profile
|
CRM
- NYSE
Salesforce.com Inc
INTERNET - Internet Software & Services
|
$83.73
|
-0.14
|
1,382,883
78% DAV
1,776,100
|
3/5/2010
(Date
Featured) |
$72.28
(Price
Featured) |
PP = $75.53 |
G |
| MB = $79.31 |
Most Recent Note - 4/15/2010 4:57:08 PM
G - Held its ground today at its all-time high. Extended from prior chart highs and well above its "max buy" level now, the volume totals were below the investment system guidelines as it rallied above its latest pivot point.
>>> The latest Featured Stock Update with an annotated graph appeared on 3/25/2010. click here.
|
|
C
A
S
I |
News |
Chart |
SEC
View all notes Alert
me of new notes
Company
Profile
|
CTRP
- NASDAQ
Ctrip.com Intl Ltd Adr
LEISURE - Resorts & Casinos
|
$39.98
|
+0.57
|
1,371,033
66% DAV
2,070,800
|
3/25/2010
(Date
Featured) |
$40.74
(Price
Featured) |
PP = $39.40 |
Y |
| MB = $41.37 |
Most Recent Note - 4/15/2010 4:58:18 PM
Y - Small gain today on light volume, inching back above its previously cited pivot point. Encountered mild distributional pressure since 3/25/10 when a detailed Stock Bulletin with annotated graph and expert analysis was published (read here).
>>> The latest Featured Stock Update with an annotated graph appeared on 4/12/2010. click here.
|
|
C
A
S
I |
News |
Chart |
SEC
View all notes Alert
me of new notes
Company
Profile
|
EZPW
- NASDAQ
Ezcorp Inc Cl A
SPECIALTY RETAIL - Specialty Retail, Other
|
$22.06
|
+0.26
|
385,864
76% DAV
507,400
|
4/14/2010
(Date
Featured) |
$21.80
(Price
Featured) |
PP = $22.29 |
Y |
| MB = $23.40 |
Most Recent Note - 4/15/2010 5:00:03 PM
Y - Today's 4th consecutive gain on light volume led to its best ever close. It is now on the right side of a 5-week base with no overhead supply to act as resistance. Color code was changed to yellow with new pivot point noted. Its 50 DMA line and its recent chart low ($19.73 on 3/16/10) define near-term support for this high-ranked Finance - Consumer/Commercial Loans firm.
>>> The latest Featured Stock Update with an annotated graph appeared on 3/29/2010. click here.
|
|
C
A
S
I |
News |
Chart |
SEC
View all notes Alert
me of new notes
Company
Profile
|
GMCR
- NASDAQ
Green Mtn Coffee Roastrs
FOOD & BEVERAGE - Processed & Packaged Goods
|
$95.20
|
-0.40
|
1,695,069
169% DAV
1,003,100
|
2/26/2010
(Date
Featured) |
$84.39
(Price
Featured) |
PP = $88.75 |
G |
| MB = $93.19 |
Most Recent Note - 4/15/2010 5:02:06 PM
G - Gapped down today and traded near its 10-week average, then rebounded promptly and closed near the session high. While hovering in a tight trading range, this high-ranked leader may be building a late-stage base after rallying more than 6-fold from its November '08 low. Support to watch on pullbacks is at prior chart highs and its 50-day moving average (DMA) line now coinciding in the $88 area.
>>> The latest Featured Stock Update with an annotated graph appeared on 4/5/2010. click here.
|
|
C
A
S
I |
News |
Chart |
SEC
View all notes Alert
me of new notes
Company
Profile
|
ISRG
- NASDAQ
Intuitive Surgical Inc
HEALTH SERVICES - Medical Appliances & Equipment
|
$388.01
|
+4.06
|
1,504,312
306% DAV
492,300
|
4/13/2010
(Date
Featured) |
$363.46
(Price
Featured) |
PP = $367.10 |
G |
| MB = $385.46 |
Most Recent Note - 4/15/2010 5:07:46 PM
G - Hit a new all-time high today and closed above its "max buy" level with above average volume behind its 6th consecutive gain. Color code is changed to green. Reported strong earnings news after the close for the quarter ended Mar 31, 2020. ISRG was featured again in the 4/13/10 mid-day report (read here) with new pivot point cited based on its 3/03/10 high.
>>> The latest Featured Stock Update with an annotated graph appeared on 4/7/2010. click here.
|
|
C
A
S
I |
News |
Chart |
SEC
View all notes Alert
me of new notes
Company
Profile
|
LOPE
- NASDAQ
Grand Canyon Education
DIVERSIFIED SERVICES - Education &; Training Services
|
$27.02
|
-0.14
|
302,576
85% DAV
355,700
|
4/13/2010
(Date
Featured) |
$27.71
(Price
Featured) |
PP = $27.33 |
Y |
| MB = $28.70 |
Most Recent Note - 4/15/2010 5:11:44 PM
Y - Second consecutive small loss today, closing below its pivot point. Subsequent weakness leading to a close below its old high close ($26.64 on 3/25/10) would raise concerns. Featured in the 4/13/10 mid-day report (read here), its gain triggered a technical buy after an advanced "3-weeks tight" type pattern.
>>> The latest Featured Stock Update with an annotated graph appeared on 4/14/2010. click here.
|
|
C
A
S
I |
News |
Chart |
SEC
View all notes Alert
me of new notes
Company
Profile
|
PCLN
- NASDAQ
Priceline.com Inc
INTERNET - Internet Software & Services
|
$399.55
|
-4.72
|
584,812
N/A
|
11/1/2002
(Date
Featured) |
$399.55
(Price
Featured) |
PP = $428.20 |
Y |
| MB = $449.61 |
Most Recent Note - 1/2/2011
Y - Returns to Featured Stocks list with its appearance in the January 2011 CANSLIM.net News including detailed analysis and annotated daily and weekly graphs.
>>> The latest Featured Stock Update with an annotated graph appeared on 3/30/2010. click here.
|
|
C
A
S
I |
News |
Chart |
SEC
View all notes Alert
me of new notes
Company
Profile
|
PEGA
- NASDAQ
Pegasystems Inc
COMPUTER SOFTWARE & SERVICES - Business Software & Services
|
$38.16
|
+0.09
|
100,819
54% DAV
185,700
|
2/26/2010
(Date
Featured) |
$36.00
(Price
Featured) |
PP = $38.55 |
Y |
| MB = $40.48 |
Most Recent Note - 4/15/2010 5:20:57 PM
Y - Ended near the session low with another small gain today on light volume. Volume has dried up while consolidating since 3/15/10, staying in a tight trading range near support. A violation of its 50 DMA line or its recent low ($36.42 on 4/12/10) would raise concerns and trigger technical sell signals.
>>> The latest Featured Stock Update with an annotated graph appeared on 4/6/2010. click here.
|
|
C
A
S
I |
News |
Chart |
SEC
View all notes Alert
me of new notes
Company
Profile
|
ROVI
- NASDAQ
Rovi Corp
COMPUTER SOFTWARE & SERVICES - Security Software & Services
|
$38.21
|
+0.08
|
611,803
45% DAV
1,352,000
|
2/25/2010
(Date
Featured) |
$33.54
(Price
Featured) |
PP = $34.87 |
G |
| MB = $36.61 |
Most Recent Note - 4/15/2010 5:40:59 PM
G - Today's 5th consecutive small gain with below average volume lifted it further above its "max buy" level near its best ever close. Prior chart highs and its 50 DMA line coinciding in the $34 area define an important support level to watch on pullbacks.
>>> The latest Featured Stock Update with an annotated graph appeared on 4/8/2010. click here.
|
|
C
A
S
I |
News |
Chart |
SEC
View all notes Alert
me of new notes
Company
Profile
|
SIRO
- NASDAQ
Sirona Dental Systems
HEALTH SERVICES - Medical Instruments & Supplies
|
$39.13
|
+0.11
|
260,330
44% DAV
594,700
|
2/16/2010
(Date
Featured) |
$36.43
(Price
Featured) |
PP = $36.15 |
G |
| MB = $37.96 |
Most Recent Note - 4/15/2010 5:42:00 PM
G - Inched higher today for another new high close. Volume totals have been cooling while holding its ground near its 52-week high. Prior chart highs and its 50 DMA line in the $36 area define an initial support level to watch.
>>> The latest Featured Stock Update with an annotated graph appeared on 3/26/2010. click here.
|
|
C
A
S
I |
News |
Chart |
SEC
View all notes Alert
me of new notes
Company
Profile
|
ULTA
- NASDAQ
Ulta Salon Cosm & Frag
SPECIALTY RETAIL - Specialty Retail, Other
|
$23.81
|
+0.55
|
269,625
69% DAV
391,500
|
3/12/2010
(Date
Featured) |
$22.81
(Price
Featured) |
PP = $21.72 |
G |
| MB = $22.81 |
Most Recent Note - 4/15/2010 5:44:00 PM
G - Gain today on light volume its best close ever. Held its ground stubbornly near its 52-week high, yet it has made very little progress since the detailed Stock Bulletin and 3/12/10 mid-day report appearance.
>>> The latest Featured Stock Update with an annotated graph appeared on 4/1/2010. click here.
|
|
C
A
S
I |
News |
Chart |
SEC
View all notes Alert
me of new notes
Company
Profile
|
VIT
-
|
$24.38
|
-0.69
|
823,251
130% DAV
634,800
|
4/9/2010
(Date
Featured) |
$23.79
(Price
Featured) |
PP = $23.95 |
Y |
| MB = $25.15 |
Most Recent Note - 4/15/2010 5:50:22 PM
Y - Closed in the upper half of its range after slumping below its pivot point intra-day, but today's loss with above average volume was indicative of distributional pressure. On 4/09/10 it triggered a technical buy signal as a solid gain with heavy volume more than 4 times average helped it trade above its pivot point after a 5-week consolidation. Color code was yellow with new pivot point noted in the 4/09/10 mid-day report (read here).
>>> The latest Featured Stock Update with an annotated graph appeared on 4/9/2010. click here.
|
|
C
A
S
I |
News |
Chart |
SEC
View all notes Alert
me of new notes
Company
Profile
|
VPRT
- NASDAQ
Vistaprint Nv
DIVERSIFIED SERVICES - Business/Management Services
|
$59.18
|
+0.55
|
426,156
116% DAV
368,400
|
3/1/2010
(Date
Featured) |
$57.72
(Price
Featured) |
PP = $59.70 |
G |
| MB = $62.69 |
Most Recent Note - 4/15/2010 5:58:42 PM
G - Gain today, and recently finding impressive support near its 50 DMA line. A subsequent violation of the short-term average or recent chart low ($55.45) would raise concerns and trigger technical sell signals. It did not trigger a new technical buy signal since it was featured in the March 2010 CANSLIM.net News monthly newsletter (read here).
>>> The latest Featured Stock Update with an annotated graph appeared on 4/15/2010. click here.
|
|
C
A
S
I |
News |
Chart |
SEC
View all notes Alert
me of new notes
Company
Profile
|
|
|
|
THESE ARE NOT BUY RECOMMENDATIONS!
Comments contained in the body of this report are technical
opinions only. The material herein has been obtained
from sources believed to be reliable and accurate, however,
its accuracy and completeness cannot be guaranteed.
This site is not an investment advisor, hence it does
not endorse or recommend any securities or other investments.
Any recommendation contained in this report may not
be suitable for all investors and it is not to be deemed
an offer or solicitation on our part with respect to
the purchase or sale of any securities. All trademarks,
service marks and trade names appearing in this report
are the property of their respective owners, and are
likewise used for identification purposes only.
This report is a service available
only to active Paid Premium Members.
You may opt-out of receiving report notifications
at any time. Questions or comments may be submitted
by writing to Premium Membership Services 665 S.E. 10 Street, Suite 201 Deerfield Beach, FL 33441-5634 or by calling 1-800-965-8307
or 954-785-1121.
|
|
|


