***Last / Change / Volume quote data in this table corresponds with the timestamp on the note***
Symbol/Exchange
Company Name
Industry Group |
Last |
Chg. |
Vol
% DAV |
Date Featured |
Price Featured |
Latest Pivot Point
Featured |
Status |
| Latest Max Buy Price |
ARUN
- NASDAQ
Aruba Networks Inc
COMPUTER HARDWARE - Networking & Communication Dev
|
$13.89
|
+0.26
|
745,517
46% DAV
1,605,200
|
2/19/2010
(Date
Featured) |
$12.71
(Price
Featured) |
PP = $11.94 |
G |
| MB = $12.54 |
Most Recent Note - 4/14/2010 4:24:31 PM
G - Gain today with light volume for a new high close. It is clear of resistance due to overhead supply. Prior chart highs and its 50 DMA line in the $12 area are support levels to watch.
>>> The latest Featured Stock Update with an annotated graph appeared on 3/31/2010. click here.
|
|
C
A
S
I |
News |
Chart |
SEC
View all notes Alert
me of new notes
Company
Profile
|
BIDU
- NASDAQ
Baidu Inc Ads
INTERNET - Internet Information Providers
|
$637.66
|
+11.00
|
1,362,201
83% DAV
1,634,400
|
1/13/2010
(Date
Featured) |
$431.25
(Price
Featured) |
PP = $426.75 |
G |
| MB = $448.09 |
Most Recent Note - 4/14/2010 4:37:03 PM
G - Gapped up today for another new all-time high while posting its 5th consecutive gain. It has been repeatedly noted as extended from any sound base after 10 consecutive weekly gains, however it could produce more climactic gains, especially due to the small supply (S criteria) of shares outstanding.
>>> The latest Featured Stock Update with an annotated graph appeared on 3/24/2010. click here.
|
|
C
A
S
I |
News |
Chart |
SEC
View all notes Alert
me of new notes
Company
Profile
|
BPI
- NYSE
Bridgepoint Education
DIVERSIFIED SERVICES - Education &; Training Services
|
$26.26
|
-0.08
|
397,111
97% DAV
409,900
|
4/13/2010
(Date
Featured) |
$25.59
(Price
Featured) |
PP = $25.76 |
Y |
| MB = $27.05 |
Most Recent Note - 4/14/2010 4:44:33 PM
Y- Held its ground today after hitting a new 52 week high and appearing in yellow in the 4/13/10 mid-day report (read here). Its strong close for a considerable gain with twice average volume triggered a new technical buy signal as it rose from a cup-with-high-handle, with its pivot point based upon the 3/24/10 high. It has an impressive history of very strong annual and quarterly increases in sales revenues and earnings above the +25% guideline which is good concerning the C & A criteria. Leadership in the Commercial Services - Schools group is a nice reassurance concerning the L criteria.
>>> The latest Featured Stock Update with an annotated graph appeared on 4/13/2010. click here.
|
|
C
A
S
I |
News |
Chart |
SEC
View all notes Alert
me of new notes
Company
Profile
|
BRLI
- NASDAQ
Bio Reference Labs Inc
HEALTH SERVICES - Medical Laboratories & Researc
|
$46.59
|
+0.23
|
102,280
105% DAV
97,800
|
2/12/2010
(Date
Featured) |
$39.02
(Price
Featured) |
PP = $40.97 |
G |
| MB = $43.02 |
Most Recent Note - 4/14/2010 4:45:40 PM
G - Today's gain on average volume for a new high close was its 6th consecutive gain after consolidating for 4 weeks well above its 50 DMA line. Its recent chart low ($42.54 on 3/26/10) is an initial support level to watch near its short-term average.
>>> The latest Featured Stock Update with an annotated graph appeared on 3/22/2010. click here.
|
|
C
A
S
I |
News |
Chart |
SEC
View all notes Alert
me of new notes
Company
Profile
|
CISG
- NASDAQ
Cninsure Inc Ads
INSURANCE - Insurance Brokers
|
$28.27
|
-0.06
|
218,992
94% DAV
233,100
|
3/3/2010
(Date
Featured) |
$24.38
(Price
Featured) |
PP = $23.10 |
G |
| MB = $24.26 |
Most Recent Note - 4/14/2010 4:52:28 PM
G - Holding its ground near its all-time high, recently noted -"extended from a sound base, yet no overhead supply remains to act as resistance." It has traded up as much as +16.9% since featured in yellow in the 3/03/10 mid-day report (read here).
>>> The latest Featured Stock Update with an annotated graph appeared on 3/23/2010. click here.
|
|
C
A
S
I |
News |
Chart |
SEC
View all notes Alert
me of new notes
Company
Profile
|
CRM
- NYSE
Salesforce.com Inc
INTERNET - Internet Software & Services
|
$83.87
|
+3.44
|
2,205,019
125% DAV
1,760,200
|
3/5/2010
(Date
Featured) |
$72.28
(Price
Featured) |
PP = $75.53 |
G |
| MB = $79.31 |
Most Recent Note - 4/14/2010 4:58:54 PM
G - Gapped up today, hitting a new all-time high with +25% above average volume. Extended from prior chart highs and well above its "max buy" level now, the volume totals were below the investment system guidelines as it rallied above its latest pivot point.
>>> The latest Featured Stock Update with an annotated graph appeared on 3/25/2010. click here.
|
|
C
A
S
I |
News |
Chart |
SEC
View all notes Alert
me of new notes
Company
Profile
|
CTRP
- NASDAQ
Ctrip.com Intl Ltd Adr
LEISURE - Resorts & Casinos
|
$39.41
|
+0.74
|
1,280,510
61% DAV
2,094,700
|
3/25/2010
(Date
Featured) |
$40.74
(Price
Featured) |
PP = $39.40 |
Y |
| MB = $41.37 |
Most Recent Note - 4/14/2010 5:14:20 PM
Y - Gapped up today for a gain on light volume, closing near its previously cited pivot point. Encountered mild distributional pressure since 3/25/10 when a detailed Stock Bulletin with annotated graph and expert analysis was published (read here).
>>> The latest Featured Stock Update with an annotated graph appeared on 4/12/2010. click here.
|
|
C
A
S
I |
News |
Chart |
SEC
View all notes Alert
me of new notes
Company
Profile
|
EZPW
- NASDAQ
Ezcorp Inc Cl A
SPECIALTY RETAIL - Specialty Retail, Other
|
$21.80
|
+0.14
|
343,934
67% DAV
512,300
|
4/14/2010
(Date
Featured) |
$21.80
(Price
Featured) |
PP = $22.29 |
Y |
| MB = $23.40 |
Most Recent Note - 4/14/2010 5:24:02 PM
Y - Closed at the session high for its third consecutive gain with below average volume, finishing only 17 cents below its best ever close. It is now on the right side of a 5-week base with no overhead supply to act as resistance. Color code is changed to yellow with new pivot point noted. Its 50 DMA line and its recent chart low ($19.73 on 3/16/10) define near-term support. This high-ranked Finance - Consumer/Commercial Loans firm
>>> The latest Featured Stock Update with an annotated graph appeared on 3/29/2010. click here.
|
|
C
A
S
I |
News |
Chart |
SEC
View all notes Alert
me of new notes
Company
Profile
|
GMCR
- NASDAQ
Green Mtn Coffee Roastrs
FOOD & BEVERAGE - Processed & Packaged Goods
|
$95.60
|
-0.23
|
912,329
90% DAV
1,009,500
|
2/26/2010
(Date
Featured) |
$84.39
(Price
Featured) |
PP = $88.75 |
G |
| MB = $93.19 |
Most Recent Note - 4/14/2010 5:42:20 PM
G - Holding its ground in a tight trading range, this high-ranked leader may be building a late-stage base after rallying more than 6-fold from its November '08 low. Support to watch on pullbacks is at prior chart highs and its 50-day moving average (DMA) line now coinciding in the $88 area.
>>> The latest Featured Stock Update with an annotated graph appeared on 4/5/2010. click here.
|
|
C
A
S
I |
News |
Chart |
SEC
View all notes Alert
me of new notes
Company
Profile
|
ISRG
- NASDAQ
Intuitive Surgical Inc
HEALTH SERVICES - Medical Appliances & Equipment
|
$383.95
|
+16.52
|
1,248,543
262% DAV
476,900
|
4/13/2010
(Date
Featured) |
$363.46
(Price
Featured) |
PP = $367.10 |
Y |
| MB = $385.46 |
Most Recent Note - 4/14/2010 5:48:42 PM
Y - Considerable gain today with heavy volume, nearing its "max buy" level while trading to a new all-time high with above average volume behind its 5th consecutive gain. Earnings news is due, with a conference call scheduled following Thursday's close. ISRG was featured again in the 4/13/10 mid-day report (read here) with new pivot point cited based on its 3/03/10 high. Its considerable gain above its pivot point with more than 3 times average volume triggered a new technical buy signal. It rebounded back above its 50 DMA line after triggering recent technical sell signals, a sign of prompt support. Based on weak action it was dropped from the Featured Stocks list when last noted on 4/07/10.
>>> The latest Featured Stock Update with an annotated graph appeared on 4/7/2010. click here.
|
|
C
A
S
I |
News |
Chart |
SEC
View all notes Alert
me of new notes
Company
Profile
|
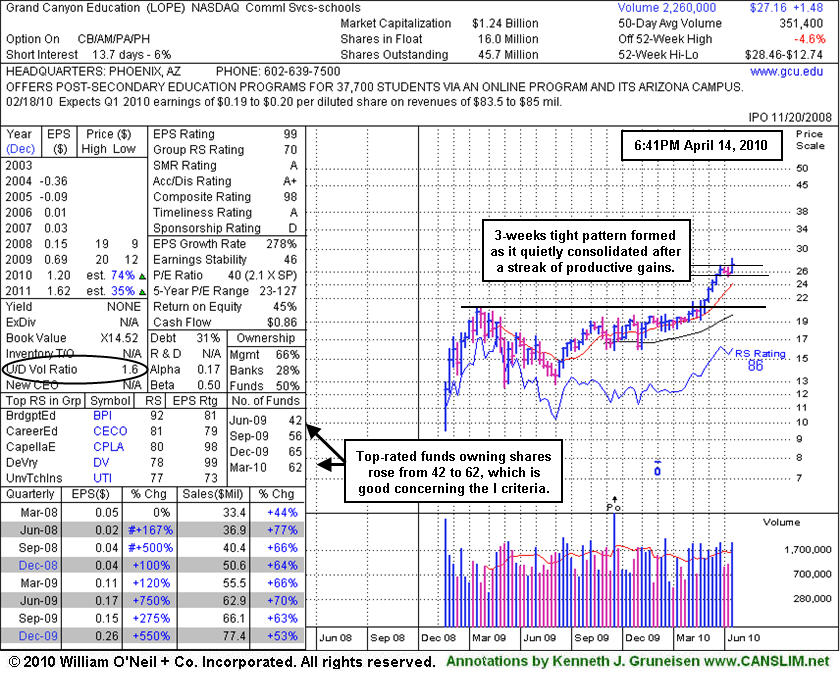
LOPE
- NASDAQ
Grand Canyon Education
DIVERSIFIED SERVICES - Education &; Training Services
|
$27.16
|
-0.19
|
421,727
120% DAV
351,400
|
4/13/2010
(Date
Featured) |
$27.71
(Price
Featured) |
PP = $27.33 |
Y |
| MB = $28.70 |
Most Recent Note - 4/14/2010 6:11:00 PM
Y - Small loss today, closing just below its pivot point. Featured in the 4/13/10 mid-day report (read here), its gain triggered a technical buy after an advanced "3-weeks tight" type pattern. Leadership in the Commercial Services - Schools group is a nice reassurance for the L criteria. As noted in the 3/24/10 mid-day report appearance, "Patient investors may watch for an ideal entry point on pullbacks toward prior highs, of whenever a new base forms."
>>> The latest Featured Stock Update with an annotated graph appeared on 4/14/2010. click here.
|
|
C
A
S
I |
News |
Chart |
SEC
View all notes Alert
me of new notes
Company
Profile
|
PCLN
- NASDAQ
Priceline.com Inc
INTERNET - Internet Software & Services
|
$399.55
|
-4.72
|
584,812
N/A
|
11/1/2002
(Date
Featured) |
$399.55
(Price
Featured) |
PP = $428.20 |
Y |
| MB = $449.61 |
Most Recent Note - 1/2/2011
Y - Returns to Featured Stocks list with its appearance in the January 2011 CANSLIM.net News including detailed analysis and annotated daily and weekly graphs.
>>> The latest Featured Stock Update with an annotated graph appeared on 3/30/2010. click here.
|
|
C
A
S
I |
News |
Chart |
SEC
View all notes Alert
me of new notes
Company
Profile
|
PEGA
- NASDAQ
Pegasystems Inc
COMPUTER SOFTWARE & SERVICES - Business Software & Services
|
$38.07
|
+0.97
|
100,754
53% DAV
190,200
|
2/26/2010
(Date
Featured) |
$36.00
(Price
Featured) |
PP = $38.55 |
Y |
| MB = $40.48 |
Most Recent Note - 4/14/2010 6:17:56 PM
Y - Gain today on light volume, still consolidating in a tight trading range near support at prior chart highs and its 50 DMA line. A violation of its 50 DMA line or its recent low ($36.42) would raise concerns and trigger technical sell signals. Its Relative Strength rank has been slumping while it has failed to follow through with any confirming gains with above average volume since its considerable gap up gain on 3/15/10 triggered a technical buy signal.
>>> The latest Featured Stock Update with an annotated graph appeared on 4/6/2010. click here.
|
|
C
A
S
I |
News |
Chart |
SEC
View all notes Alert
me of new notes
Company
Profile
|
ROVI
- NASDAQ
Rovi Corp
COMPUTER SOFTWARE & SERVICES - Security Software & Services
|
$38.13
|
+0.22
|
1,099,780
81% DAV
1,351,400
|
2/25/2010
(Date
Featured) |
$33.54
(Price
Featured) |
PP = $34.87 |
G |
| MB = $36.61 |
Most Recent Note - 4/14/2010 6:20:11 PM
G - Today's 4th consecutive gain with below average volume lifted it further above its "max buy" level, finishing the session 20 cents below its best ever close. Prior chart highs and its 50 DMA line coinciding in the $34 area define an important support level to watch on pullbacks.
>>> The latest Featured Stock Update with an annotated graph appeared on 4/8/2010. click here.
|
|
C
A
S
I |
News |
Chart |
SEC
View all notes Alert
me of new notes
Company
Profile
|
SIRO
- NASDAQ
Sirona Dental Systems
HEALTH SERVICES - Medical Instruments & Supplies
|
$39.02
|
+0.78
|
405,203
68% DAV
591,900
|
2/16/2010
(Date
Featured) |
$36.43
(Price
Featured) |
PP = $36.15 |
G |
| MB = $37.96 |
Most Recent Note - 4/14/2010 6:23:45 PM
G - Finished today at a new high close. Volume totals have been cooling while holding its ground near its 52-week high. Prior chart highs and its 50 DMA line in the $36 area define an initial support level to watch.
>>> The latest Featured Stock Update with an annotated graph appeared on 3/26/2010. click here.
|
|
C
A
S
I |
News |
Chart |
SEC
View all notes Alert
me of new notes
Company
Profile
|
ULTA
- NASDAQ
Ulta Salon Cosm & Frag
SPECIALTY RETAIL - Specialty Retail, Other
|
$23.26
|
+0.42
|
240,730
62% DAV
391,300
|
3/12/2010
(Date
Featured) |
$22.81
(Price
Featured) |
PP = $21.72 |
G |
| MB = $22.81 |
Most Recent Note - 4/14/2010 6:28:26 PM
G - Gain today on light volume for is second best close ever. Recently noted signs of distributional "churning" near its 52-week high since the detailed Stock Bulletin and 3/12/10 mid-day report appearance.
>>> The latest Featured Stock Update with an annotated graph appeared on 4/1/2010. click here.
|
|
C
A
S
I |
News |
Chart |
SEC
View all notes Alert
me of new notes
Company
Profile
|
VIT
-
|
$25.07
|
+0.25
|
491,131
77% DAV
635,500
|
4/9/2010
(Date
Featured) |
$23.79
(Price
Featured) |
PP = $23.95 |
Y |
| MB = $25.15 |
Most Recent Note - 4/14/2010 6:30:07 PM
Y - Held its ground today. On 4/09/10 it triggered a technical buy signal as a solid gain with heavy volume more than 4 times average helped it trade above its pivot point after a 5-week consolidation. Color code was yellow with new pivot point noted in the 4/09/10 mid-day report (read here).
>>> The latest Featured Stock Update with an annotated graph appeared on 4/9/2010. click here.
|
|
C
A
S
I |
News |
Chart |
SEC
View all notes Alert
me of new notes
Company
Profile
|
VPRT
- NASDAQ
Vistaprint Nv
DIVERSIFIED SERVICES - Business/Management Services
|
$58.63
|
+0.72
|
756,214
205% DAV
368,500
|
3/1/2010
(Date
Featured) |
$57.72
(Price
Featured) |
PP = $59.70 |
G |
| MB = $62.69 |
Most Recent Note - 4/14/2010 6:34:12 PM
G - Today it gapped down then positively reversed, finding impressive support near its 50 DMA line once again. It did not trigger a technical buy signal since it was featured in the March 2010 CANSLIM.net News monthly newsletter (read here).
>>> The latest Featured Stock Update with an annotated graph appeared on 3/19/2010. click here.
|
|
C
A
S
I |
News |
Chart |
SEC
View all notes Alert
me of new notes
Company
Profile
|