***Last / Change / Volume quote data in this table corresponds with the timestamp on the note***
Symbol/Exchange
Company Name
Industry Group |
Last |
Chg. |
Vol
% DAV |
Date Featured |
Price Featured |
Latest Pivot Point
Featured |
Status |
| Latest Max Buy Price |
ARUN
- NASDAQ
Aruba Networks Inc
COMPUTER HARDWARE - Networking & Communication Dev
|
$13.63
|
-0.21
|
660,718
41% DAV
1,600,400
|
2/19/2010
(Date
Featured) |
$12.71
(Price
Featured) |
PP = $11.94 |
G |
| MB = $12.54 |
Most Recent Note - 4/13/2010 6:13:48 PM
G - Loss on light volume today, still perched only -2.8% under its 52-week high. Support to watch is defined by prior chart highs and its 50 DMA line in the upper $11 area.
>>> The latest Featured Stock Update with an annotated graph appeared on 3/31/2010. click here.
|
|
C
A
S
I |
News |
Chart |
SEC
View all notes Alert
me of new notes
Company
Profile
|
BIDU
- NASDAQ
Baidu Inc Ads
INTERNET - Internet Information Providers
|
$626.66
|
+0.50
|
884,807
54% DAV
1,650,000
|
1/13/2010
(Date
Featured) |
$431.25
(Price
Featured) |
PP = $426.75 |
G |
| MB = $448.09 |
Most Recent Note - 4/13/2010 6:15:36 PM
G - Small gain on below average volume today, touching and closing at yet another new all-time high. It is extended from any sound base after 10 consecutive weekly gains.
>>> The latest Featured Stock Update with an annotated graph appeared on 3/24/2010. click here.
|
|
C
A
S
I |
News |
Chart |
SEC
View all notes Alert
me of new notes
Company
Profile
|
BPI
- NYSE
Bridgepoint Education
DIVERSIFIED SERVICES - Education &; Training Services
|
$26.34
|
+2.26
|
792,699
202% DAV
392,300
|
4/13/2010
(Date
Featured) |
$25.59
(Price
Featured) |
PP = $25.76 |
Y |
| MB = $27.05 |
Most Recent Note - 4/13/2010 6:21:46 PM
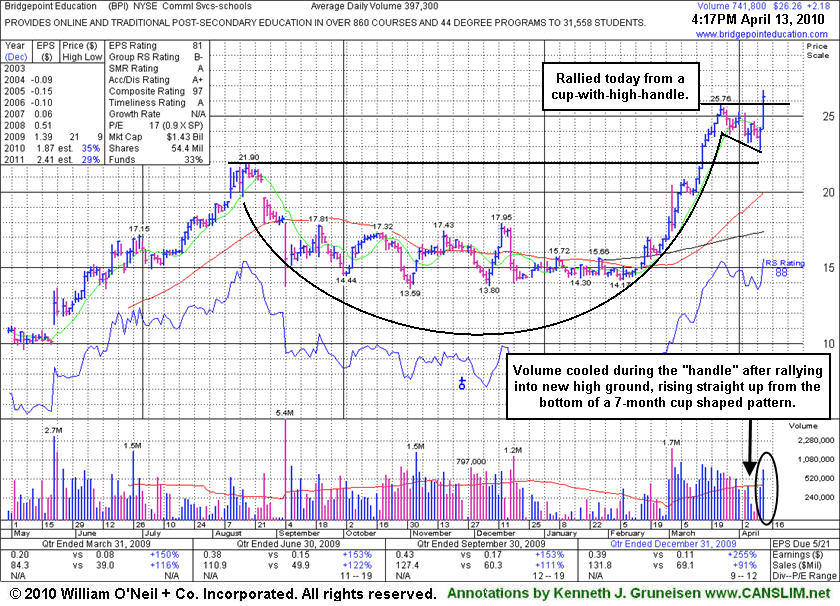
Y- Hit a new 52 week high and it appeared in yellow in today's mid-day report after a brief consolidation above its old chart high (read here). Its strong close for a considerable gain with twice average volume triggered a new technical buy signal. BPI was last noted in the mid-day report on 3/24/10 after it had rallied straight up from the bottom of a 7-month cup shaped pattern -"Patient investors may watch for future buy points near a sound base or wait for the opportunity to accumulate shares on light volume pullbacks." Now its pattern resembles a cup-with-high handle, with its pivot point based upon the 3/24/10 high. It has an impressive history of very strong annual and quarterly increases in sales revenues and earnings above the +25% guideline which is good concerning the C & A criteria. Leadership in the Commercial Services - Schools group is a nice reassurance concerning the L criteria.
>>> The latest Featured Stock Update with an annotated graph appeared on 4/13/2010. click here.
|
|
C
A
S
I |
News |
Chart |
SEC
View all notes Alert
me of new notes
Company
Profile
|
BRLI
- NASDAQ
Bio Reference Labs Inc
HEALTH SERVICES - Medical Laboratories & Researc
|
$46.36
|
+0.62
|
64,104
66% DAV
97,700
|
2/12/2010
(Date
Featured) |
$39.02
(Price
Featured) |
PP = $40.97 |
G |
| MB = $43.02 |
Most Recent Note - 4/13/2010 6:24:16 PM
G - Today's gain on light volume for a new high close was its 5th consecutive gain after consolidating for 4 weeks well above its 50 DMA line. Its recent chart low ($42.54 on 3/26/10) is an initial support level to watch near its short-term average.
>>> The latest Featured Stock Update with an annotated graph appeared on 3/22/2010. click here.
|
|
C
A
S
I |
News |
Chart |
SEC
View all notes Alert
me of new notes
Company
Profile
|
CISG
- NASDAQ
Cninsure Inc Ads
INSURANCE - Insurance Brokers
|
$28.33
|
+0.02
|
123,603
53% DAV
233,100
|
3/3/2010
(Date
Featured) |
$24.38
(Price
Featured) |
PP = $23.10 |
G |
| MB = $24.26 |
Most Recent Note - 4/13/2010 6:46:57 PM
G - Finished at a new high close with a small gain on light volume after a small gap down today. Recently noted as "extended from a sound base, yet no overhead supply remains to act as resistance." It has traded up as much as +16.9% since featured in yellow in the 3/03/10 mid-day report (read here).
>>> The latest Featured Stock Update with an annotated graph appeared on 3/23/2010. click here.
|
|
C
A
S
I |
News |
Chart |
SEC
View all notes Alert
me of new notes
Company
Profile
|
CRM
- NYSE
Salesforce.com Inc
INTERNET - Internet Software & Services
|
$80.43
|
-0.08
|
1,307,810
75% DAV
1,744,600
|
3/5/2010
(Date
Featured) |
$72.28
(Price
Featured) |
PP = $75.53 |
G |
| MB = $79.31 |
Most Recent Note - 4/13/2010 6:49:49 PM
G - Quietly held its ground today after its gain on 4/12/10 came with +40% above average volume for another new all-time high above its "max buy" level. It did not recently trigger a proper technical buy signal within the strict investment system guidelines.
>>> The latest Featured Stock Update with an annotated graph appeared on 3/25/2010. click here.
|
|
C
A
S
I |
News |
Chart |
SEC
View all notes Alert
me of new notes
Company
Profile
|
CTRP
- NASDAQ
Ctrip.com Intl Ltd Adr
LEISURE - Resorts & Casinos
|
$38.67
|
-0.02
|
1,004,970
47% DAV
2,148,700
|
3/25/2010
(Date
Featured) |
$40.74
(Price
Featured) |
PP = $39.40 |
Y |
| MB = $41.37 |
Most Recent Note - 4/13/2010 6:53:33 PM
Y - Trading under its pivot point and -8.6% from its high now, CTRP recently stalled. It has encountered mild distributional pressure since 3/25/10 when a detailed Stock Bulletin with annotated graph and expert analysis was published (read here).
>>> The latest Featured Stock Update with an annotated graph appeared on 4/12/2010. click here.
|
|
C
A
S
I |
News |
Chart |
SEC
View all notes Alert
me of new notes
Company
Profile
|
EZPW
- NASDAQ
Ezcorp Inc Cl A
SPECIALTY RETAIL - Specialty Retail, Other
|
$21.66
|
+0.08
|
395,988
77% DAV
514,300
|
2/19/2010
(Date
Featured) |
$19.03
(Price
Featured) |
PP = $18.80 |
G |
| MB = $19.74 |
Most Recent Note - 4/13/2010 6:57:21 PM
G - Consolidating for the past 4 weeks well above its 50 DMA line and its recent chart low ($19.73 on 3/16/10) defining near-term support. This high-ranked Finance - Consumer/Commercial Loans firm is only -2.4% below its all-time high and has no overhead supply to act as resistance.
>>> The latest Featured Stock Update with an annotated graph appeared on 3/29/2010. click here.
|
|
C
A
S
I |
News |
Chart |
SEC
View all notes Alert
me of new notes
Company
Profile
|
GMCR
- NASDAQ
Green Mtn Coffee Roastrs
FOOD & BEVERAGE - Processed & Packaged Goods
|
$95.83
|
-0.28
|
574,808
51% DAV
1,121,000
|
2/26/2010
(Date
Featured) |
$84.39
(Price
Featured) |
PP = $88.75 |
G |
| MB = $93.19 |
Most Recent Note - 4/13/2010 7:24:30 PM
G - This high-ranked leader may be building a late-stage base after rallying more than 6-fold from its November '08 low. Support to watch on pullbacks is at prior chart highs and its 50-day moving average (DMA) line now coinciding in the $88 area.
>>> The latest Featured Stock Update with an annotated graph appeared on 4/5/2010. click here.
|
|
C
A
S
I |
News |
Chart |
SEC
View all notes Alert
me of new notes
Company
Profile
|
ISRG
- NASDAQ
Intuitive Surgical Inc
HEALTH SERVICES - Medical Appliances & Equipment
|
$367.43
|
+13.22
|
1,576,179
344% DAV
458,200
|
4/13/2010
(Date
Featured) |
$363.46
(Price
Featured) |
PP = $367.10 |
Y |
| MB = $385.46 |
Most Recent Note - 4/13/2010 7:31:24 PM
Y - Featured again in today's mid-day report (read here) with new pivot point cited based on its all-time high. Its considerable gain above its pivot point with more than 3 times average volume triggered a new technical buy signal. It rebounded back above its 50 DMA line after triggering recent technical sell signals, a sign of prompt support. Based on weak action it was dropped from the Featured Stocks list when last noted on 4/07/10.
>>> The latest Featured Stock Update with an annotated graph appeared on 4/7/2010. click here.
|
|
C
A
S
I |
News |
Chart |
SEC
View all notes Alert
me of new notes
Company
Profile
|
LOPE
- NASDAQ
Grand Canyon Education
DIVERSIFIED SERVICES - Education &; Training Services
|
$27.35
|
+1.07
|
1,544,498
476% DAV
324,800
|
4/13/2010
(Date
Featured) |
$27.71
(Price
Featured) |
PP = $27.33 |
Y |
| MB = $28.70 |
Most Recent Note - 4/13/2010 7:39:12 PM
Y - It was featured in today's mid-day report (read here) and finished the session near the middle of its intra-day range with a gain above its pivot point backed by more than 4 times average volume. The considerable gain triggered a technical buy after an advanced "3-weeks tight" type pattern. Leadership in the Commercial Services - Schools group is a nice reassurance for the L criteria. As noted in the 3/24/10 mid-day report appearance, "Patient investors may watch for an ideal entry point on pullbacks toward prior highs, of whenever a new base forms."
There are no Featured Stock Updates™ available for this stock at this time. You may request one by clicking here
|
|
C
A
S
I |
News |
Chart |
SEC
View all notes Alert
me of new notes
Company
Profile
|
PCLN
- NASDAQ
Priceline.com Inc
INTERNET - Internet Software & Services
|
$399.55
|
-4.72
|
584,812
N/A
|
11/1/2002
(Date
Featured) |
$399.55
(Price
Featured) |
PP = $428.20 |
Y |
| MB = $449.61 |
Most Recent Note - 1/2/2011
Y - Returns to Featured Stocks list with its appearance in the January 2011 CANSLIM.net News including detailed analysis and annotated daily and weekly graphs.
>>> The latest Featured Stock Update with an annotated graph appeared on 3/30/2010. click here.
|
|
C
A
S
I |
News |
Chart |
SEC
View all notes Alert
me of new notes
Company
Profile
|
PEGA
- NASDAQ
Pegasystems Inc
COMPUTER SOFTWARE & SERVICES - Business Software & Services
|
$37.10
|
-0.16
|
65,809
33% DAV
200,200
|
2/26/2010
(Date
Featured) |
$36.00
(Price
Featured) |
PP = $38.55 |
Y |
| MB = $40.48 |
Most Recent Note - 4/13/2010 7:44:05 PM
Y - Quietly consolidating still, holding its ground in as tight range near support at prior chart highs and just above its 50 DMA line which coincides in the $37 area. Its Relative Strength rank has been slumping while it has failed to follow through with any confirming gains with above average volume since its considerable gap up gain on 3/15/10 triggered a technical buy signal.
>>> The latest Featured Stock Update with an annotated graph appeared on 4/6/2010. click here.
|
|
C
A
S
I |
News |
Chart |
SEC
View all notes Alert
me of new notes
Company
Profile
|
ROVI
- NASDAQ
Rovi Corp
COMPUTER SOFTWARE & SERVICES - Security Software & Services
|
$37.91
|
+0.45
|
807,272
60% DAV
1,352,800
|
2/25/2010
(Date
Featured) |
$33.54
(Price
Featured) |
PP = $34.87 |
G |
| MB = $36.61 |
Most Recent Note - 4/13/2010 7:47:07 PM
G - Today's 3rd consecutive gain with below average volume lifted it further above its "max buy" level to a close just -1.5% below its 52-week high. Prior chart highs and its 50 DMA line coinciding in the $34 area define an important support level to watch on pullbacks.
>>> The latest Featured Stock Update with an annotated graph appeared on 4/8/2010. click here.
|
|
C
A
S
I |
News |
Chart |
SEC
View all notes Alert
me of new notes
Company
Profile
|
SIRO
- NASDAQ
Sirona Dental Systems
HEALTH SERVICES - Medical Instruments & Supplies
|
$38.24
|
+0.19
|
185,554
31% DAV
592,400
|
2/16/2010
(Date
Featured) |
$36.43
(Price
Featured) |
PP = $36.15 |
G |
| MB = $37.96 |
Most Recent Note - 4/13/2010 7:48:50 PM
G - Volume totals have been cooling while hovering in a tight range near all-time highs. Prior chart highs and its 50 DMA line in the $36 area define an initial support level to watch.
>>> The latest Featured Stock Update with an annotated graph appeared on 3/26/2010. click here.
|
|
C
A
S
I |
News |
Chart |
SEC
View all notes Alert
me of new notes
Company
Profile
|
ULTA
- NASDAQ
Ulta Salon Cosm & Frag
SPECIALTY RETAIL - Specialty Retail, Other
|
$22.84
|
-0.38
|
248,223
65% DAV
379,200
|
3/12/2010
(Date
Featured) |
$22.81
(Price
Featured) |
PP = $21.72 |
G |
| MB = $22.81 |
Most Recent Note - 4/13/2010 7:54:06 PM
G - Down on lighter volume today, pulling back near its "max buy" level. The prior session's weak close was a sign of distributional "churning" after early gains for a new 52-week high. A detailed Stock Bulletin with annotated graph was published soon after it was featured in the 3/12/10 mid-day report.
>>> The latest Featured Stock Update with an annotated graph appeared on 4/1/2010. click here.
|
|
C
A
S
I |
News |
Chart |
SEC
View all notes Alert
me of new notes
Company
Profile
|
VIT
-
|
$24.82
|
-0.32
|
937,408
154% DAV
607,200
|
4/9/2010
(Date
Featured) |
$23.79
(Price
Featured) |
PP = $23.95 |
Y |
| MB = $25.15 |
Most Recent Note - 4/13/2010 7:56:03 PM
Y - Closed near the session high today after dipping intra-day near its pivot point. On 4/09/10 it triggered a technical buy signal as a solid gain with heavy volume more than 4 times average helped it trade above its pivot point after a 5-week consolidation. Color code was yellow with new pivot point noted in the 4/09/10 mid-day report (read here).
>>> The latest Featured Stock Update with an annotated graph appeared on 4/9/2010. click here.
|
|
C
A
S
I |
News |
Chart |
SEC
View all notes Alert
me of new notes
Company
Profile
|
VPRT
- NASDAQ
Vistaprint Nv
DIVERSIFIED SERVICES - Business/Management Services
|
$57.91
|
-0.70
|
337,285
82% DAV
413,700
|
3/1/2010
(Date
Featured) |
$57.72
(Price
Featured) |
PP = $59.70 |
G |
| MB = $62.69 |
Most Recent Note - 4/13/2010 7:57:42 PM
G - Today's 3rd consecutive loss on lighter than average volume led to a close just under its 50 DMA line. Distributional action recently pressured it near that short-term average line, raising concerns. It did not trigger a technical buy signal since it was featured in the March 2010 CANSLIM.net News monthly newsletter (read here). As previously noted, "Its gain on 3/02/10 was below the volume guidelines for buyable breakouts under the investment system."
>>> The latest Featured Stock Update with an annotated graph appeared on 3/19/2010. click here.
|
|
C
A
S
I |
News |
Chart |
SEC
View all notes Alert
me of new notes
Company
Profile
|