You are not logged in.
This means you
CAN ONLY VIEW reports that were published prior to Monday, April 14, 2025.
You
MUST UPGRADE YOUR MEMBERSHIP if you want to see any current reports.
AFTER MARKET UPDATE - FRIDAY, APRIL 12TH, 2013
Previous After Market Report Next After Market Report >>>
|
|
|
|
DOW |
-0.08 |
14,865.06 |
-0.00% |
|
Volume |
700,196,960 |
+9% |
|
Volume |
1,419,481,230 |
-20% |
|
NASDAQ |
-5.21 |
3,294.95 |
-0.16% |
|
Advancers |
1,171 |
38% |
|
Advancers |
1,009 |
39% |
|
S&P 500 |
-4.52 |
1,588.85 |
-0.28% |
|
Decliners |
1,787 |
57% |
|
Decliners |
1,474 |
57% |
|
Russell 2000 |
-4.20 |
942.85 |
-0.44% |
|
52 Wk Highs |
182 |
|
|
52 Wk Highs |
97 |
|
|
S&P 600 |
-2.38 |
526.64 |
-0.45% |
|
52 Wk Lows |
33 |
|
|
52 Wk Lows |
20 |
|
|
 |
Major Averages Close Winning Week With a Small Pullback
Kenneth J. Gruneisen - Passed the CAN SLIM® Master's Exam
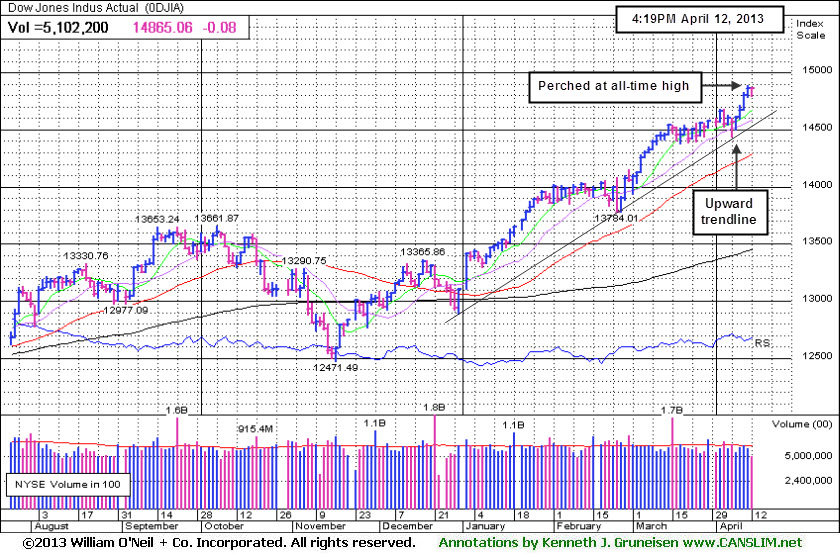
Despite Friday’s small losses, the major averages posted impressive weekly gains. For the week, the Dow Jones Industrial Average was up +2.1%. The S&P 500 Index had its best week in over a month as it rallied +2.3% and the Nasdaq Composite Index increased +2.8%. Friday's volume totals on the exchanges were reported mixed, higher than the prior session total on the NYSE and lower on the Nasdaq exchange. Breadth was negative as decliners led advancers by 3 to 2 on the NYSE and on the Nasdaq exchange. New 52-week highs totals contracted but still easily outnumbered new 52-week lows on the NYSE and on the Nasdaq exchange. There were 35 high-ranked companies from the CANSLIM.net Leaders List making new 52-week highs and appearing on the CANSLIM.net BreakOuts Page, down from the prior session total of 87 stocks. There were gains for 6 of the 16 high-ranked companies currently included on the Featured Stocks Page.
A batch of economic data and earnings results prompted some profit taking follow the market's spurt of gains. Retail sales experienced the biggest drop in nine months as sales fell by -0.4% in March. In addition, the preliminary April reading on the University of Michigan's consumer confidence survey surprisingly fell to its lowest level since July of last year. Meanwhile, a slump in energy costs led to a -0.6% decline in the producer price index, its largest retreat since May 2012.
Overall, most sectors were lower, led by losses in Materials. The group declined as copper fell nearly -3% and gold plunged to its lowest price since July 2011. In turn, BHP Billiton (BHP -1.53%) and Freeport-McMoRan Copper & Gold Inc (FCX -2.65%) fell. Energy stocks also lost ground as crude oil dropped over -2% to a one-month low. ConocoPhillips (COP -1.33%) and Halliburton Co (HAL -0.75%) were lower. The Financial group fell after its first-quarter earnings season kicked off on a down note. JPMorgan Chase & Co (JPM -0.61%) beat profit expectations, but fell short of revenue estimates.
In fixed-income, Treasuries were up for only the second time this week. The 10-year note increased 19/32 to yield 1.72% and the 30-year bond gained over a full point and a half to yield 2.92%.
The market's (M criteria) strength and solid leadership (stocks hitting new 52-week highs) helped the major indices to rally persistently into new high territory, providing investors encouraging signs for fans of the fact-based investment system. New buying efforts are only justified in stocks meeting all key criteria. The most noteworthy and actionable leaders are listed on the Featured Stocks page.
Watch for an announcement via email concerning the next WEBCAST. The webcast will also be available via an updated link highlighted at the top of the Premium Member Homepage.
PICTURED: The Dow Jones Industrial Average has rallied above its October 2007 all-time high into new high territory.
|
 Kenneth J. Gruneisen started out as a licensed stockbroker in August 1987, a couple of months prior to the historic stock market crash that took the Dow Jones Industrial Average down -22.6% in a single day. He has published daily fact-based fundamental and technical analysis on high-ranked stocks online for two decades. Through FACTBASEDINVESTING.COM, Kenneth provides educational articles, news, market commentary, and other information regarding proven investment systems that work in good times and bad.
Comments contained in the body of this report are technical opinions only and are not necessarily those of Gruneisen Growth Corp. The material herein has been obtained from sources believed to be reliable and accurate, however, its accuracy and completeness cannot be guaranteed. Our firm, employees, and customers may effect transactions, including transactions contrary to any recommendation herein, or have positions in the securities mentioned herein or options with respect thereto. Any recommendation contained in this report may not be suitable for all investors and it is not to be deemed an offer or solicitation on our part with respect to the purchase or sale of any securities. |
|
 |
Gold & Silver Index Dives; Energy and Financial Indexes Retreat
Kenneth J. Gruneisen - Passed the CAN SLIM® Master's Exam
The Gold & Silver Index ($XAU -5.64%) was a standout decliner on Friday. Weakness in energy-related shares pushed the Oil Services Index ($OSX -1.68%) and the Integrated Oil Index ($XOI -1.23%) both lower. The Retail Index ($RLX +0.80%) was a positive influence, meanwhile the Bank Index ($BKX -1.11%) and the Broker/Dealer Index ($XBD -0.73%) pulled back. The Networking Index ($NWX -1.04%) led the tech sector lower and the Semiconductor Index ($SOX -0.46%) posted a small loss while the Internet Index ($IIX -0.11%) and the Healthcare Index ($HMO -0.01%) finished flat. The Biotechnology Index ($BTK +0.23%) eked out a small gain.
Charts courtesy www.stockcharts.com
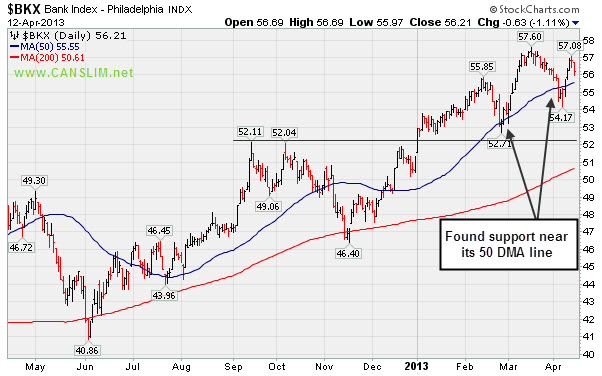
PICTURED: The Bank Index ($BKX -1.11%) pulled back on Friday. It found recent support near its 50-day moving average (DMA) line.
| Oil Services |
$OSX |
249.42 |
-4.27 |
-1.68% |
+13.29% |
| Healthcare |
$HMO |
2,982.10 |
-0.18 |
-0.01% |
+18.61% |
| Integrated Oil |
$XOI |
1,337.44 |
-16.66 |
-1.23% |
+7.70% |
| Semiconductor |
$SOX |
433.63 |
-2.00 |
-0.46% |
+12.91% |
| Networking |
$NWX |
234.64 |
-2.47 |
-1.04% |
+3.57% |
| Internet |
$IIX |
363.30 |
-0.39 |
-0.11% |
+11.10% |
| Broker/Dealer |
$XBD |
112.34 |
-0.83 |
-0.73% |
+19.09% |
| Retail |
$RLX |
753.33 |
+5.99 |
+0.80% |
+15.35% |
| Gold & Silver |
$XAU |
116.37 |
-6.96 |
-5.64% |
-29.73% |
| Bank |
$BKX |
56.21 |
-0.63 |
-1.11% |
+9.61% |
| Biotech |
$BTK |
1,876.13 |
+4.33 |
+0.23% |
+21.27% |
|
|
|
 |
Finding Support Near 50-Day Average Following Distributional Pressure
Kenneth J. Gruneisen - Passed the CAN SLIM® Master's Exam
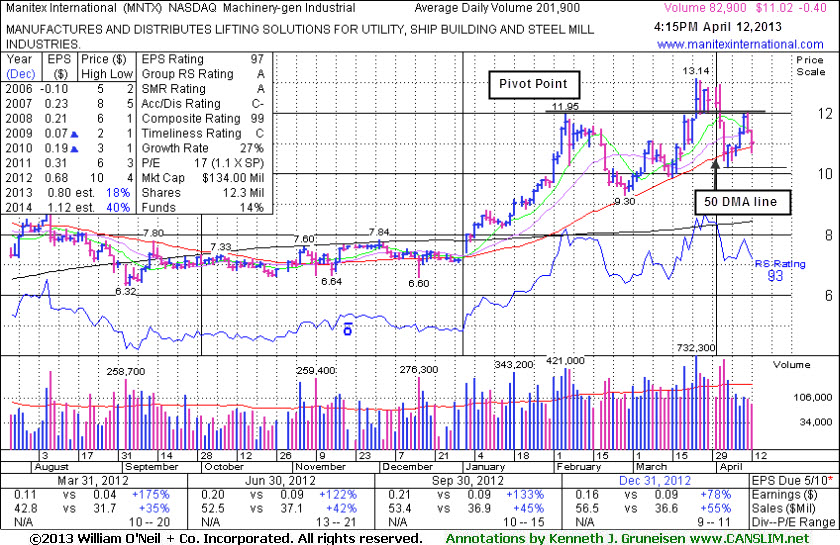
Manitex International (MNTX +$0.40 or +3.50% to $11.02) has been testing support at its 50-day moving average (DMA) line. The recent low ($10.21 on 4/04/13) defines important near-term support below its 50 DMA line. The high-ranked leader from the Machinery - General industrial group promptly encountered distributional pressure after a considerable gain with heavy volume on 3/25/13 cleared its pivot point and triggered a technical buy signal. Members have been repeatedly reminded - "Disciplined investors avoid chasing extended stocks and always limit losses by selling if any stock falls more than -7% from their purchase price."
After a stock is sold it can always be bought back again if strength returns, but following the investment system's sell rules is critical to investors' success. MNTX was last shown in this FSU section on 3/20/13 with an annotated graph under the headline, "Finished Strong While Rallying Toward its Pivot Point", after highlighted in yellow in that day's mid-day report (read here) while building on a choppy 7-week base with pivot point cited based on its 2/06/13 high plus 10 cents.
It reported earnings +78% on +55% sales revenues for the quarter ended December 31, 2012 versus the year ago period, marking its 4th consecutive quarter with earnings increasing by well above the +25% minimum earnings guideline (C criteria). Annual earnings (A criteria) growth has improved since a downturn in FY '08 and '09 earnings.
The number of top-rated funds owning its shares rose from 24 in Mar '12 to 40 in Mar '13, a reassuring sign concerning the I criteria. Its current Up/Down Volume Ratio of 1.2 also provides an unbiased indication that its shares have been under mild accumulation over the past 50 days. Its small supply (S criteria) of only 10.3 million shares in the public float can contribute to greater price volatility in the event of any institutional buying or selling. Low-priced stocks are discouraged from consideration unless all key criteria are solidly satisfied.
|
|
|
Color Codes Explained :
Y - Better candidates highlighted by our
staff of experts.
G - Previously featured
in past reports as yellow but may no longer be buyable under the
guidelines.
***Last / Change / Volume data in this table is the closing quote data***
Symbol/Exchange
Company Name
Industry Group |
PRICE |
CHANGE
(%Change) |
Day High |
Volume
(% DAV)
(% 50 day avg vol) |
52 Wk Hi
% From Hi |
Featured
Date |
Price
Featured |
Pivot Featured |
|
Max Buy |
AMBA
-
NASDAQ
Ambarella Inc
ELECTRONICS - Semiconductor - Specialized
|
$13.99
|
+0.69
5.19% |
$14.08
|
451,773
128.67% of 50 DAV
50 DAV is 351,100
|
$16.00
-12.56%
|
3/26/2013
|
$15.31
|
PP = $14.83
|
|
MB = $15.57
|
 Most Recent Note - 4/12/2013 3:33:06 PM
Y - Rebounding today after enduring more distributional pressure this week. Disciplined investors always limit losses by selling if any stock falls more than -7% from their purchase price.
>>> The latest Featured Stock Update with an annotated graph appeared on 3/26/2013. Click here.
View all notes |
Alert me of new notes |
CANSLIM.net Company Profile |
SEC |
Zacks Reports |
StockTalk |
News |
Chart |
Request a new note
C
A N
S L
I M


|
CELG
-
NASDAQ
Celgene Corp
DRUGS - Drug Manufacturers - Major
|
$123.00
|
+0.01
0.01% |
$124.10
|
2,787,644
88.27% of 50 DAV
50 DAV is 3,158,200
|
$123.80
-0.65%
|
3/27/2013
|
$113.24
|
PP = $115.54
|
|
MB = $121.32
|
Most Recent Note - 4/12/2013 3:09:14 PM
G - Color code is changed to green as it is now extended from any sound base pattern after wedging to new highs from an advanced "3-weeks tight" base with only average volume behind its gains
>>> The latest Featured Stock Update with an annotated graph appeared on 3/28/2013. Click here.
View all notes |
Alert me of new notes |
CANSLIM.net Company Profile |
SEC |
Zacks Reports |
StockTalk |
News |
Chart |
Request a new note
C
A N
S L
I M
|
CFNL
-
NASDAQ
Cardinal Financial Corp
BANKING - Regional - Southeast Banks
|
$17.24
|
-0.18
-1.03% |
$17.41
|
169,799
85.67% of 50 DAV
50 DAV is 198,200
|
$18.40
-6.30%
|
3/22/2013
|
$17.99
|
PP = $18.29
|
|
MB = $19.20
|
Most Recent Note - 4/12/2013 3:10:31 PM
Y - Consolidating above its 50 DMA line after encountering distributional pressure. Previously noted - "Gains above the pivot point must have at least the bare minimum +40% above average volume, preferably more, to trigger a proper new (or add-on) technical buy signal."
>>> The latest Featured Stock Update with an annotated graph appeared on 4/10/2013. Click here.
View all notes |
Alert me of new notes |
CANSLIM.net Company Profile |
SEC |
Zacks Reports |
StockTalk |
News |
Chart |
Request a new note
C
A N
S L
I M
|
CMCSA
-
NASDAQ
Comcast Corp Cl A
MEDIA - CATV Systems
|
$42.00
|
+0.19
0.45% |
$42.12
|
16,968,968
118.24% of 50 DAV
50 DAV is 14,350,700
|
$42.61
-1.43%
|
12/3/2012
|
$37.08
|
PP = $38.06
|
|
MB = $39.96
|
Most Recent Note - 4/12/2013 3:12:51 PM
G - Hovering near its 52-week high after finding recent support and rallying from its 50 DMA line. Relative Strength Rating slumped to 79, just under the 80+ guideline for buy candidates. Fundamental concerns remain since it reported earnings +11% on +6% sales revenues for the Dec '12 quarter, below the +25% minimum guideline (C criteria).
>>> The latest Featured Stock Update with an annotated graph appeared on 3/19/2013. Click here.
View all notes |
Alert me of new notes |
CANSLIM.net Company Profile |
SEC |
Zacks Reports |
StockTalk |
News |
Chart |
Request a new note
C
A N
S L
I M
|
EVER
-
NYSE
Everbank Financial Corp
BANKING
|
$15.13
|
-0.10
-0.66% |
$15.16
|
184,690
19.51% of 50 DAV
50 DAV is 946,700
|
$17.29
-12.49%
|
3/4/2013
|
$15.38
|
PP = $15.83
|
|
MB = $16.62
|
Most Recent Note - 4/12/2013 3:14:16 PM
G - Still holding its ground near its 50 DMA line ($15.15 now). That important short-term average has acted as support since damaging losses violated prior highs in the $16 area raising concerns while completely negating its prior technical breakout. Its Relative Strength (RS) rating has slumped to 70, below the 80+ minimum guideline for buy candidates.
>>> The latest Featured Stock Update with an annotated graph appeared on 4/2/2013. Click here.
View all notes |
Alert me of new notes |
CANSLIM.net Company Profile |
SEC |
Zacks Reports |
StockTalk |
News |
Chart |
Request a new note
C
A N
S L
I M
|
Symbol/Exchange
Company Name
Industry Group |
PRICE |
CHANGE
(%Change) |
Day High |
Volume
(% DAV)
(% 50 day avg vol) |
52 Wk Hi
% From Hi |
Featured
Date |
Price
Featured |
Pivot Featured |
|
Max Buy |
FLT
-
NYSE
Fleetcor Technologies
DIVERSIFIED SERVICES - Business/Management Services
|
$77.03
|
-0.54
-0.70% |
$77.84
|
516,384
63.17% of 50 DAV
50 DAV is 817,400
|
$78.87
-2.33%
|
3/21/2013
|
$71.14
|
PP = $73.00
|
|
MB = $76.65
|
Most Recent Note - 4/12/2013 3:16:03 PM
Y - Quietly hovering near its "max buy" level, stubbornly holding its ground. Prior high in the $72 area defines near-term support to watch above its 50 DMA line on pullbacks.
>>> The latest Featured Stock Update with an annotated graph appeared on 3/21/2013. Click here.
View all notes |
Alert me of new notes |
CANSLIM.net Company Profile |
SEC |
Zacks Reports |
StockTalk |
News |
Chart |
Request a new note
C
A N
S L
I M
|
LNKD
-
NYSE
Linkedin Corp Class A
INTERNET - Internet Information Providers
|
$185.39
|
+5.21
2.89% |
$186.06
|
2,602,428
106.07% of 50 DAV
50 DAV is 2,453,500
|
$184.15
0.67%
|
4/12/2013
|
$182.69
|
PP = $184.25
|
|
MB = $193.46
|
Most Recent Note - 4/12/2013 3:20:48 PM
Y - Color code is changed to yellow with a new pivot point cited based on its 3/14/18 high plus 10 cents while forming a short 5-week flat base pattern. Volume-driven gains above the pivot point may trigger a new (or add-on) technical buy signal. Its 50 DMA line and recent low define important near-term chart support to watch.
>>> The latest Featured Stock Update with an annotated graph appeared on 4/5/2013. Click here.
View all notes |
Alert me of new notes |
CANSLIM.net Company Profile |
SEC |
Zacks Reports |
StockTalk |
News |
Chart |
Request a new note
C
A N
S L
I M
|
MIDD
-
NASDAQ
Middleby Corp
MANUFACTURING - Diversified Machinery
|
$147.34
|
-0.14
-0.09% |
$147.86
|
35,175
38.48% of 50 DAV
50 DAV is 91,400
|
$154.74
-4.78%
|
10/8/2012
|
$118.46
|
PP = $122.67
|
|
MB = $128.80
|
Most Recent Note - 4/12/2013 3:24:15 PM
G - Its Relative Strength rating is 86 today, but the longer a stock lingers below its 50 DMA line the worse its outlook gets. Recent lows in the $144 area define important support to watch where violation may raise greater concerns. Fundamental concerns were recently noted.
>>> The latest Featured Stock Update with an annotated graph appeared on 3/25/2013. Click here.
View all notes |
Alert me of new notes |
CANSLIM.net Company Profile |
SEC |
Zacks Reports |
StockTalk |
News |
Chart |
Request a new note
C
A N
S L
I M
|
MNTX
-
NASDAQ
Manitex International
MANUFACTURING - Diversified Machinery
|
$11.02
|
-0.40
-3.50% |
$11.43
|
82,934
41.08% of 50 DAV
50 DAV is 201,900
|
$13.14
-16.13%
|
3/20/2013
|
$11.29
|
PP = $12.05
|
|
MB = $12.65
|
Most Recent Note - 4/12/2013 5:48:30 PM
Y - Testing support at its 50 DMA line again today. Recent low ($10.21 on 4/04/13) defines important near-term support below its 50 DMA line. See latest FSU analysis for more details and a new annotated graph.
>>> The latest Featured Stock Update with an annotated graph appeared on 4/12/2013. Click here.
View all notes |
Alert me of new notes |
CANSLIM.net Company Profile |
SEC |
Zacks Reports |
StockTalk |
News |
Chart |
Request a new note
C
A N
S L
I M
|
MRLN
-
NASDAQ
Marlin Business Services
DIVERSIFIED SERVICES - Rental and Leasing Services
|
$22.91
|
-0.33
-1.42% |
$23.52
|
49,786
208.31% of 50 DAV
50 DAV is 23,900
|
$23.98
-4.46%
|
3/15/2013
|
$22.29
|
PP = $23.18
|
|
MB = $24.34
|
Most Recent Note - 4/12/2013 3:27:27 PM
Y - Trading above average volume today but not making meaningful price progress, a sign of distributional pressure. Found support above its 50 DMA line, and it remains perched within close striking distance of its 52-week high. Previously noted - "Subsequent volume-driven gains above the pivot point could help clinch a more convincing technical buy signal."
>>> The latest Featured Stock Update with an annotated graph appeared on 4/9/2013. Click here.
View all notes |
Alert me of new notes |
CANSLIM.net Company Profile |
SEC |
Zacks Reports |
StockTalk |
News |
Chart |
Request a new note
C
A N
S L
I M
|
Symbol/Exchange
Company Name
Industry Group |
PRICE |
CHANGE
(%Change) |
Day High |
Volume
(% DAV)
(% 50 day avg vol) |
52 Wk Hi
% From Hi |
Featured
Date |
Price
Featured |
Pivot Featured |
|
Max Buy |
MWIV
-
NASDAQ
M W I Veterinary Supply
HEALTH SERVICES - Medical Instruments and; Supplies
|
$128.87
|
+0.82
0.64% |
$129.65
|
52,709
88.14% of 50 DAV
50 DAV is 59,800
|
$137.18
-6.06%
|
3/4/2013
|
$130.90
|
PP = $129.45
|
|
MB = $135.92
|
Most Recent Note - 4/12/2013 3:29:46 PM
Y - Consolidating at its 50 DMA line and near its pivot point, still staying in a very tight trading range building on a base-on-base type pattern. Its Relative Strength rating has slumped to 80, the minimum for buy candidates under the fact-based investment system.
>>> The latest Featured Stock Update with an annotated graph appeared on 4/4/2013. Click here.
View all notes |
Alert me of new notes |
CANSLIM.net Company Profile |
SEC |
Zacks Reports |
StockTalk |
News |
Chart |
Request a new note
C
A N
S L
I M
|
N
-
NYSE
Netsuite Inc
DIVERSIFIED SERVICES - Business/Management Services
|
$79.10
|
+0.53
0.67% |
$79.34
|
281,261
73.30% of 50 DAV
50 DAV is 383,700
|
$80.33
-1.53%
|
12/12/2012
|
$64.75
|
PP = $67.12
|
|
MB = $70.48
|
Most Recent Note - 4/12/2013 3:31:14 PM
G - Perched at all-time highs, extended after a recent streak of 7 consecutive weekly gains. Its 50 DMA line ($73.74 now) defines important near-term support to watch.
>>> The latest Featured Stock Update with an annotated graph appeared on 4/1/2013. Click here.
View all notes |
Alert me of new notes |
CANSLIM.net Company Profile |
SEC |
Zacks Reports |
StockTalk |
News |
Chart |
Request a new note
C
A N
S L
I M
|
NSR
-
NYSE
Neustar Inc
TELECOMMUNICATIONS - Diversified Communication Serv
|
$43.72
|
-0.03
-0.07% |
$43.84
|
233,577
49.69% of 50 DAV
50 DAV is 470,100
|
$47.24
-7.45%
|
3/8/2013
|
$44.99
|
PP = $47.34
|
|
MB = $49.71
|
Most Recent Note - 4/12/2013 3:04:27 PM
G - It is lingering below its 50 DMA line but only -7.5% off its 52-week high. Building a possible "double bottom" base pattern, but no new pivot point is being cited. Its Relative Strength rating has slumped to 63, well below the 80+ minimum guideline for buy candidates.
>>> The latest Featured Stock Update with an annotated graph appeared on 3/27/2013. Click here.
View all notes |
Alert me of new notes |
CANSLIM.net Company Profile |
SEC |
Zacks Reports |
StockTalk |
News |
Chart |
Request a new note
C
A N
S L
I M
|
PRLB
-
NYSE
Proto Labs Inc
MANUFACTURING - Small Tools and Accessories
|
$50.15
|
-2.08
-3.98% |
$52.21
|
1,037,928
204.48% of 50 DAV
50 DAV is 507,600
|
$55.23
-9.20%
|
4/10/2013
|
$49.97
|
PP = $54.01
|
|
MB = $56.71
|
Most Recent Note - 4/12/2013 11:27:10 AM
Y - Encountering more distributional pressure today. Reversed its gain on the prior session after hitting a new 52-week high and trading above the pivot point cited based on its 2/13/13 high plus 10 cents. The latest FSU analysis includes more details and a new annotated graph under the headline, "Encountered Distributional Pressure After Trading Above Pivot Point"
>>> The latest Featured Stock Update with an annotated graph appeared on 4/11/2013. Click here.
View all notes |
Alert me of new notes |
CANSLIM.net Company Profile |
SEC |
Zacks Reports |
StockTalk |
News |
Chart |
Request a new note
C
A N
S L
I M
|
RRTS
-
NYSE
Roadrunner Trans Systems
TRANSPORTATION - Air Delivery and Freight Service
|
$23.50
|
-0.14
-0.59% |
$23.73
|
222,321
114.84% of 50 DAV
50 DAV is 193,600
|
$23.88
-1.59%
|
4/3/2013
|
$22.77
|
PP = $23.75
|
|
MB = $24.94
|
Most Recent Note - 4/12/2013 12:24:29 PM
Y - Perched at its 52-week high today after churning heavy volume recently but encountering resistance near prior highs. A solid volume-driven gain above its pivot point is still needed to trigger a new technical buy signal. Fundamentals remain strong enough to still satisfy the C and A criteria, however decelerating sales revenues and earnings increases in sequential quarterly comparisons through the Dec '12 quarter is a concern. Completed a new Public Offering on 12/06/12 and, technically, it broke out above previously stubborn resistance in $19 area with volume-driven gains in January.
>>> The latest Featured Stock Update with an annotated graph appeared on 4/3/2013. Click here.
View all notes |
Alert me of new notes |
CANSLIM.net Company Profile |
SEC |
Zacks Reports |
StockTalk |
News |
Chart |
Request a new note
C
A N
S L
I M
|
Symbol/Exchange
Company Name
Industry Group |
PRICE |
CHANGE
(%Change) |
Day High |
Volume
(% DAV)
(% 50 day avg vol) |
52 Wk Hi
% From Hi |
Featured
Date |
Price
Featured |
Pivot Featured |
|
Max Buy |
VRX
-
NYSE
Valeant Pharmaceuticals
DRUGS - Drug Manufacturers - Other
|
$73.17
|
-0.62
-0.84% |
$73.81
|
928,102
66.76% of 50 DAV
50 DAV is 1,390,300
|
$76.56
-4.43%
|
12/20/2012
|
$60.24
|
PP = $61.21
|
|
MB = $64.27
|
Most Recent Note - 4/8/2013 5:51:08 PM
G - Consolidating above its 50 DMA line defining important near term support following loss with heavy volume on M&A news. See latest FSU analysis for more details and a new annotated graph.
>>> The latest Featured Stock Update with an annotated graph appeared on 4/8/2013. Click here.
View all notes |
Alert me of new notes |
CANSLIM.net Company Profile |
SEC |
Zacks Reports |
StockTalk |
News |
Chart |
Request a new note
C
A N
S L
I M
|
|
|
|
THESE ARE NOT BUY RECOMMENDATIONS!
Comments contained in the body of this report are technical
opinions only. The material herein has been obtained
from sources believed to be reliable and accurate, however,
its accuracy and completeness cannot be guaranteed.
This site is not an investment advisor, hence it does
not endorse or recommend any securities or other investments.
Any recommendation contained in this report may not
be suitable for all investors and it is not to be deemed
an offer or solicitation on our part with respect to
the purchase or sale of any securities. All trademarks,
service marks and trade names appearing in this report
are the property of their respective owners, and are
likewise used for identification purposes only.
This report is a service available
only to active Paid Premium Members.
You may opt-out of receiving report notifications
at any time. Questions or comments may be submitted
by writing to Premium Membership Services 665 S.E. 10 Street, Suite 201 Deerfield Beach, FL 33441-5634 or by calling 1-800-965-8307
or 954-785-1121.
|
|
|

