***Last / Change / Volume data in this table is the closing quote data***
Symbol/Exchange
Company Name
Industry Group |
PRICE |
CHANGE
(%Change) |
Day High |
Volume
(% DAV)
(% 50 day avg vol) |
52 Wk Hi
% From Hi |
Featured
Date |
Price
Featured |
Pivot Featured |
|
Max Buy |
AIXG
-
NASDAQ
Aixtron Se
ELECTRONICS - Semiconductor Equipment andamp; Mate
|
$42.47
|
-0.93
-2.14% |
$43.45
|
263,031
109.55% of 50 DAV
50 DAV is 240,100
|
$44.96
-5.54%
|
4/5/2011
|
$44.14
|
PP = $44.64
|
|
MB = $46.87
|
 Most Recent Note - 4/12/2011 12:01:57 PM
Y - Slumping near its 50 DMA line today, yet still perched only -5.7% off its 52-week high with no overhead supply to act as resistance. Volume driven gains above its pivot point may trigger a technical buy signal. Disciplined investors watch for proof of institutional buying demand and avoid the urge to get in "early".
>>> The latest Featured Stock Update with an annotated graph appeared on 4/5/2011. Click here.
View all notes |
Alert me of new notes |
CANSLIM.net Company Profile |
SEC |
Zacks Reports |
StockTalk |
News |
Chart |
Request a new note
C
A N
S L
I M


|
BIDU
-
NASDAQ
Baidu Inc Ads
INTERNET - Internet Information Providers
|
$140.71
|
-4.97
-3.41% |
$145.28
|
9,149,096
127.58% of 50 DAV
50 DAV is 7,171,000
|
$148.92
-5.51%
|
3/17/2011
|
$121.97
|
PP = $131.73
|
|
MB = $138.32
|
Most Recent Note - 4/12/2011 12:08:29 PM
G - Pulling back today, completely erasing the prior session's gap up and volume-driven gain for a new all-time high. It is extended from its latest base. Prior high near $131 defines initial chart support to watch above its 50 DMA line.
>>> The latest Featured Stock Update with an annotated graph appeared on 4/7/2011. Click here.
View all notes |
Alert me of new notes |
CANSLIM.net Company Profile |
SEC |
Zacks Reports |
StockTalk |
News |
Chart |
Request a new note
C
A N
S L
I M
|
CMG
-
NYSE
Chipotle Mexican Grill
LEISURE - Restaurants
|
$274.30
|
+5.89
2.19% |
$277.15
|
1,151,565
104.41% of 50 DAV
50 DAV is 1,102,900
|
$282.00
-2.73%
|
4/1/2011
|
$274.00
|
PP = $275.10
|
|
MB = $288.86
|
Most Recent Note - 4/12/2011 6:47:57 PM
Y - After gapping down today it managed a positive reversal and finished in the upper half of its intra-day range. Disciplined investors know to watch for confirming gains with well above average volume to trigger a new (or add-on) technical buy signal. It recently stalled after reaching a new all-time high without triggering a new technical buy signal.
>>> The latest Featured Stock Update with an annotated graph appeared on 3/14/2011. Click here.
View all notes |
Alert me of new notes |
CANSLIM.net Company Profile |
SEC |
Zacks Reports |
StockTalk |
News |
Chart |
Request a new note
C
A N
S L
I M
|
CTCT
-
NASDAQ
Constant Contact Inc
MEDIA - Advertising Services
|
$34.40
|
-0.65
-1.84% |
$34.98
|
193,188
45.47% of 50 DAV
50 DAV is 424,900
|
$36.33
-5.31%
|
3/22/2011
|
$33.59
|
PP = $32.49
|
|
MB = $34.11
|
Most Recent Note - 4/8/2011 6:15:05 PM
G - Holding its ground near its all-time high after enduring distributional pressure this week. Prior highs in the $32 area define support to watch above its 50 DMA line.
>>> The latest Featured Stock Update with an annotated graph appeared on 3/22/2011. Click here.
View all notes |
Alert me of new notes |
CANSLIM.net Company Profile |
SEC |
Zacks Reports |
StockTalk |
News |
Chart |
Request a new note
C
A N
S L
I M
|
CTSH
-
NASDAQ
Cognizant Tech Sol Cl A
COMPUTER SOFTWARE and SERVICES - Business Software and Services
|
$79.92
|
-0.58
-0.72% |
$80.58
|
1,667,194
73.69% of 50 DAV
50 DAV is 2,262,500
|
$82.86
-3.55%
|
2/7/2011
|
$75.09
|
PP = $76.46
|
|
MB = $80.28
|
Most Recent Note - 4/8/2011 6:17:31 PM
G - Down today for a 5th consecutive loss on below average volume, consolidating near its "max buy" level above prior highs in the $77-78 area that define chart support to watch above its 50 DMA line. No resistance remains due to overhead supply.
>>> The latest Featured Stock Update with an annotated graph appeared on 3/17/2011. Click here.
View all notes |
Alert me of new notes |
CANSLIM.net Company Profile |
SEC |
Zacks Reports |
StockTalk |
News |
Chart |
Request a new note
C
A N
S L
I M
|
Symbol/Exchange
Company Name
Industry Group |
PRICE |
CHANGE
(%Change) |
Day High |
Volume
(% DAV)
(% 50 day avg vol) |
52 Wk Hi
% From Hi |
Featured
Date |
Price
Featured |
Pivot Featured |
|
Max Buy |
DECK
-
NASDAQ
Deckers Outdoor Corp
CONSUMER NON-DURABLES - Textile - Apparel Footwear
|
$87.86
|
-0.62
-0.70% |
$89.72
|
1,033,973
78.46% of 50 DAV
50 DAV is 1,317,800
|
$94.70
-7.22%
|
2/3/2011
|
$79.61
|
PP = $82.67
|
|
MB = $86.80
|
Most Recent Note - 4/8/2011 6:18:40 PM
G - Quietly hovering within close striking distance of its all-time high. Its choppy consolidation in recent weeks is not recognized as a sound base pattern. Its 50 DMA line defines initial chart support to watch. See the latest FSU analysis for more details and a new annotated graph.
>>> The latest Featured Stock Update with an annotated graph appeared on 4/6/2011. Click here.
View all notes |
Alert me of new notes |
CANSLIM.net Company Profile |
SEC |
Zacks Reports |
StockTalk |
News |
Chart |
Request a new note
C
A N
S L
I M
|
EZPW
-
NASDAQ
Ezcorp Inc Cl A
SPECIALTY RETAIL - Specialty Retail, Other
|
$28.98
|
+0.04
0.14% |
$29.30
|
324,322
94.33% of 50 DAV
50 DAV is 343,800
|
$33.08
-12.39%
|
2/18/2011
|
$27.94
|
PP = $30.04
|
|
MB = $31.54
|
Most Recent Note - 4/11/2011 4:17:28 PM
G - Down today with above average volume, it closed near its 50 DMA line. A considerable loss on 4/08/11 with three times average volume raised concerns while it slumped below its prior high closes in the $29-30 area previously noted as important support to watch. More damaging losses may trigger more worrisome technical sell signals.
>>> The latest Featured Stock Update with an annotated graph appeared on 4/11/2011. Click here.
View all notes |
Alert me of new notes |
CANSLIM.net Company Profile |
SEC |
Zacks Reports |
StockTalk |
News |
Chart |
Request a new note
C
A N
S L
I M
|
FOSL
-
NASDAQ
Fossil Inc
CONSUMER DURABLES - Recreational Goods, Other
|
$92.51
|
-0.81
-0.87% |
$94.63
|
852,287
87.21% of 50 DAV
50 DAV is 977,300
|
$95.39
-3.02%
|
2/1/2011
|
$73.30
|
PP = $74.44
|
|
MB = $78.16
|
Most Recent Note - 4/8/2011 6:21:56 PM
G - Touched a new all-time high today but finished with a small loss on light volume. It has rallied as much as +108% higher in 8 months since first featured in yellow in the 8/10/10 mid-day report (read here). It could produce more climactic gains, but recently it has been noted - "Extended from any sound base. Prior highs in the $83-85 area define chart support to watch above its 50 DMA line."
>>> The latest Featured Stock Update with an annotated graph appeared on 3/30/2011. Click here.
View all notes |
Alert me of new notes |
CANSLIM.net Company Profile |
SEC |
Zacks Reports |
StockTalk |
News |
Chart |
Request a new note
C
A N
S L
I M
|
HMSY
-
NASDAQ
H M S Holdings Corp
COMPUTER SOFTWARE and SERVICES - Healthcare Information Service
|
$80.90
|
-0.20
-0.25% |
$81.48
|
124,233
77.94% of 50 DAV
50 DAV is 159,400
|
$84.82
-4.62%
|
11/19/2010
|
$61.89
|
PP = $63.01
|
|
MB = $66.16
|
Most Recent Note - 4/8/2011 6:23:55 PM
G - Pulling back from its all-time high with a 4th consecutive loss on below average volume. It is extended from any sound base pattern. Its 50 DMA line ($75.83 now) defines support to watch on pullbacks.
>>> The latest Featured Stock Update with an annotated graph appeared on 3/25/2011. Click here.
View all notes |
Alert me of new notes |
CANSLIM.net Company Profile |
SEC |
Zacks Reports |
StockTalk |
News |
Chart |
Request a new note
C
A N
S L
I M
|
HS
-
NYSE
Healthspring Inc
HEALTH SERVICES - Health Care Plans
|
$38.18
|
-0.82
-2.10% |
$39.15
|
818,513
98.51% of 50 DAV
50 DAV is 830,900
|
$40.78
-6.38%
|
3/22/2011
|
$38.29
|
PP = $38.85
|
|
MB = $40.79
|
Most Recent Note - 4/12/2011 6:01:01 PM
Y - Down again today on higher (near average) volume, sinking further below its pivot point. Prior high closes define initial support above its 50 DMA line, with the next support at recent lows in the $35.50 area.
>>> The latest Featured Stock Update with an annotated graph appeared on 3/23/2011. Click here.
View all notes |
Alert me of new notes |
CANSLIM.net Company Profile |
SEC |
Zacks Reports |
StockTalk |
News |
Chart |
Request a new note
C
A N
S L
I M
|
Symbol/Exchange
Company Name
Industry Group |
PRICE |
CHANGE
(%Change) |
Day High |
Volume
(% DAV)
(% 50 day avg vol) |
52 Wk Hi
% From Hi |
Featured
Date |
Price
Featured |
Pivot Featured |
|
Max Buy |
INFA
-
NASDAQ
Informatica Corp
COMPUTER SOFTWARE and SERVICES - Business Software and Services
|
$51.38
|
+0.18
0.35% |
$52.71
|
899,526
105.94% of 50 DAV
50 DAV is 849,100
|
$52.96
-2.98%
|
3/24/2011
|
$50.04
|
PP = $49.86
|
|
MB = $52.35
|
Most Recent Note - 4/12/2011 6:05:12 PM
Y - Still holding its ground, consolidating above prior highs in the $49 area defining initial support to watch above its 50 DMA line. Subsequent violations would raise concerns and may trigger technical sell signals.
>>> The latest Featured Stock Update with an annotated graph appeared on 3/28/2011. Click here.
View all notes |
Alert me of new notes |
CANSLIM.net Company Profile |
SEC |
Zacks Reports |
StockTalk |
News |
Chart |
Request a new note
C
A N
S L
I M
|
LULU
-
NASDAQ
Lululemon Athletica
MANUFACTURING - Textile Manufacturing
|
$89.30
|
+0.59
0.67% |
$90.14
|
1,989,435
85.20% of 50 DAV
50 DAV is 2,335,100
|
$94.98
-5.98%
|
3/28/2011
|
$68.11
|
PP = $85.38
|
|
MB = $89.65
|
Most Recent Note - 4/12/2011 6:24:37 PM
G - After gapping down today it managed a positive reversal and closed in the upper third of its intra-day range. Prior highs in the $85 area define initial chart support to watch.
>>> The latest Featured Stock Update with an annotated graph appeared on 3/31/2011. Click here.
View all notes |
Alert me of new notes |
CANSLIM.net Company Profile |
SEC |
Zacks Reports |
StockTalk |
News |
Chart |
Request a new note
C
A N
S L
I M
|
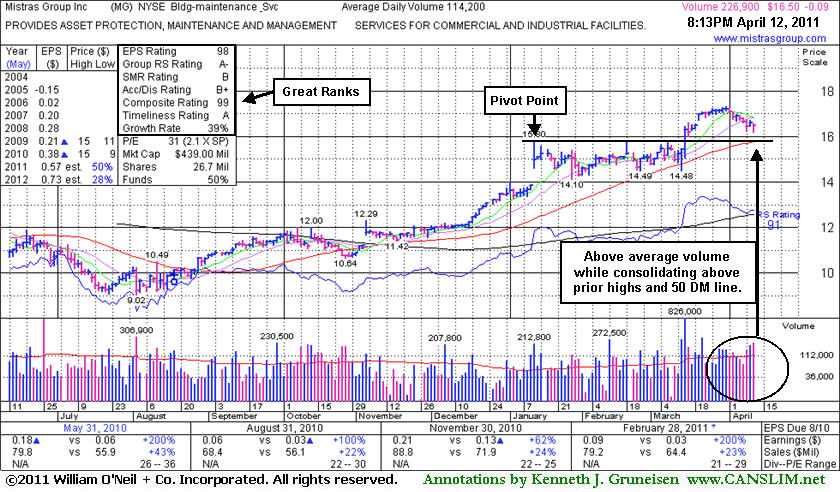
MG
-
NYSE
Mistras Group Inc
DIVERSIFIED SERVICES - Bulding and Faci;ity Management Services
|
$16.50
|
-0.09
-0.54% |
$16.54
|
228,900
200.44% of 50 DAV
50 DAV is 114,200
|
$17.33
-4.79%
|
3/15/2011
|
$15.48
|
PP = $15.90
|
|
MB = $16.70
|
Most Recent Note - 4/12/2011 6:41:35 PM
Y - Closed near the session high today with a small loss on heavy volume while consolidating above prior highs. Its 50 DMA line also defines important support, and subsequent violations may trigger technical sell signals. Its color code was changed to yellow after dipping under its "max buy" level.
>>> The latest Featured Stock Update with an annotated graph appeared on 4/12/2011. Click here.
View all notes |
Alert me of new notes |
CANSLIM.net Company Profile |
SEC |
Zacks Reports |
StockTalk |
News |
Chart |
Request a new note
C
A N
S L
I M
|
MWIV
-
NASDAQ
M W I Veterinary Supply
HEALTH SERVICES - Medical Instruments and; Supplies
|
$78.48
|
+0.57
0.73% |
$79.10
|
68,785
73.33% of 50 DAV
50 DAV is 93,800
|
$80.86
-2.94%
|
11/4/2010
|
$61.79
|
PP = $59.60
|
|
MB = $62.58
|
Most Recent Note - 4/8/2011 6:31:16 PM
G - Pulled back today for a 3rd consecutive loss. Its 50 DMA line defines important support to watch. It has been repeatedly noted - "Extended from any sound base pattern."
>>> The latest Featured Stock Update with an annotated graph appeared on 4/8/2011. Click here.
View all notes |
Alert me of new notes |
CANSLIM.net Company Profile |
SEC |
Zacks Reports |
StockTalk |
News |
Chart |
Request a new note
C
A N
S L
I M
|
OPEN
-
NASDAQ
Opentable Inc
INTERNET - Internet Software and Services
|
$106.28
|
-1.56
-1.45% |
$107.62
|
952,878
74.39% of 50 DAV
50 DAV is 1,281,000
|
$112.78
-5.76%
|
3/17/2011
|
$90.71
|
PP = $96.07
|
|
MB = $100.87
|
Most Recent Note - 4/8/2011 6:42:26 PM
G - Quiet gain today for its second best close ever. It is extended from its latest base, and prior highs near $96 define initial support to watch on pullbacks.
>>> The latest Featured Stock Update with an annotated graph appeared on 3/24/2011. Click here.
View all notes |
Alert me of new notes |
CANSLIM.net Company Profile |
SEC |
Zacks Reports |
StockTalk |
News |
Chart |
Request a new note
C
A N
S L
I M
|
Symbol/Exchange
Company Name
Industry Group |
PRICE |
CHANGE
(%Change) |
Day High |
Volume
(% DAV)
(% 50 day avg vol) |
52 Wk Hi
% From Hi |
Featured
Date |
Price
Featured |
Pivot Featured |
|
Max Buy |
PAY
-
NYSE
Verifone Systems Inc
COMPUTER HARDWARE - Transaction Automation Systems
|
$54.02
|
+2.03
3.90% |
$54.10
|
3,387,182
153.67% of 50 DAV
50 DAV is 2,204,200
|
$58.88
-8.25%
|
1/27/2011
|
$41.77
|
PP = $44.97
|
|
MB = $47.22
|
Most Recent Note - 4/12/2011 6:44:22 PM
G - Overcame early weakness after a gap down today. It managed a positive reversal and closed near the session with a solid gain on above average volume. Its 50 DMA line ($49.36 now) defines important chart support to watch.
>>> The latest Featured Stock Update with an annotated graph appeared on 4/4/2011. Click here.
View all notes |
Alert me of new notes |
CANSLIM.net Company Profile |
SEC |
Zacks Reports |
StockTalk |
News |
Chart |
Request a new note
C
A N
S L
I M
|
PCLN
-
NASDAQ
Priceline.Com Inc
INTERNET - Internet Software and Services
|
$512.14
|
-0.31
-0.06% |
$515.00
|
946,078
79.48% of 50 DAV
50 DAV is 1,190,300
|
$522.00
-1.89%
|
1/3/2011
|
$399.55
|
PP = $428.20
|
|
MB = $449.61
|
Most Recent Note - 4/8/2011 6:37:19 PM
G - Still hovering near its 52-week high with volume totals cooling while it has been noted as extended from any sound base pattern. Its 50 DMA line has defined support throughout its advance.
>>> The latest Featured Stock Update with an annotated graph appeared on 3/21/2011. Click here.
View all notes |
Alert me of new notes |
CANSLIM.net Company Profile |
SEC |
Zacks Reports |
StockTalk |
News |
Chart |
Request a new note
C
A N
S L
I M
|
RAX
-
NYSE
Rackspace Hosting Inc
INTERNET - Internet Software and; Services
|
$41.04
|
-1.58
-3.71% |
$42.49
|
1,350,247
76.52% of 50 DAV
50 DAV is 1,764,600
|
$44.19
-7.13%
|
3/16/2011
|
$36.28
|
PP = $40.72
|
|
MB = $42.76
|
Most Recent Note - 4/12/2011 10:27:05 AM
G - Down considerably today, slumping again toward prior highs near $40 defining important chart support to watch above its 50 DMA line.
>>> The latest Featured Stock Update with an annotated graph appeared on 3/16/2011. Click here.
View all notes |
Alert me of new notes |
CANSLIM.net Company Profile |
SEC |
Zacks Reports |
StockTalk |
News |
Chart |
Request a new note
C
A N
S L
I M
|
TIBX
-
NASDAQ
Tibco Software Inc
COMPUTER SOFTWARE and SERVICES - Business Software and Services
|
$28.05
|
+1.06
3.93% |
$29.85
|
7,030,199
295.37% of 50 DAV
50 DAV is 2,380,100
|
$28.31
-0.90%
|
3/18/2011
|
$23.88
|
PP = $26.04
|
|
MB = $27.34
|
Most Recent Note - 4/12/2011 1:41:00 PM
G - Off earlier highs after a gap up today for a new 52-week high. Found support above prior highs in the $25-26 area during its consolidation. Color code was changed to green again after getting extended from a sound base.
>>> The latest Featured Stock Update with an annotated graph appeared on 3/18/2011. Click here.
View all notes |
Alert me of new notes |
CANSLIM.net Company Profile |
SEC |
Zacks Reports |
StockTalk |
News |
Chart |
Request a new note
C
A N
S L
I M
|
UA
-
NYSE
Under Armour Inc Cl A
CONSUMER NON-DURABLES - Textile - Apparel Clothing
|
$73.97
|
+0.68
0.93% |
$75.00
|
987,025
124.47% of 50 DAV
50 DAV is 793,000
|
$76.85
-3.75%
|
3/31/2011
|
$68.04
|
PP = $70.79
|
|
MB = $74.33
|
Most Recent Note - 4/12/2011 1:42:38 PM
Y - Still consolidating above its pivot point and below its "max buy" level, with no overhead supply remaining to act as resistance. Following its 4/01/11 technical breakout, its prior highs in the $70 area define support to watch.
>>> The latest Featured Stock Update with an annotated graph appeared on 4/1/2011. Click here.
View all notes |
Alert me of new notes |
CANSLIM.net Company Profile |
SEC |
Zacks Reports |
StockTalk |
News |
Chart |
Request a new note
C
A N
S L
I M
|
Symbol/Exchange
Company Name
Industry Group |
PRICE |
CHANGE
(%Change) |
Day High |
Volume
(% DAV)
(% 50 day avg vol) |
52 Wk Hi
% From Hi |
Featured
Date |
Price
Featured |
Pivot Featured |
|
Max Buy |
ULTA
-
NASDAQ
Ulta Salon Cosm & Frag
SPECIALTY RETAIL - Specialty Retail, Other
|
$50.51
|
-0.61
-1.19% |
$51.72
|
503,808
80.13% of 50 DAV
50 DAV is 628,700
|
$51.82
-2.53%
|
1/6/2011
|
$36.12
|
PP = $37.34
|
|
MB = $39.21
|
Most Recent Note - 4/8/2011 6:43:58 PM
G - Touched another new all-time high today before puling back and closing with a small loss on light volume. Extended from any sound base now, its prior highs and its 50 DMA line define chart support to watch near the $44 level on pullbacks.
>>> The latest Featured Stock Update with an annotated graph appeared on 3/29/2011. Click here.
View all notes |
Alert me of new notes |
CANSLIM.net Company Profile |
SEC |
Zacks Reports |
StockTalk |
News |
Chart |
Request a new note
C
A N
S L
I M
|