You are not logged in.
This means you
CAN ONLY VIEW reports that were published prior to Monday, April 14, 2025.
You
MUST UPGRADE YOUR MEMBERSHIP if you want to see any current reports.
AFTER MARKET UPDATE - THURSDAY, APRIL 10TH, 2014
Previous After Market Report Next After Market Report >>>
|
|
|
|
DOW |
-266.96 |
16,170.22 |
-1.62% |
|
Volume |
785,655,080 |
+14% |
|
Volume |
2,258,016,530 |
+24% |
|
NASDAQ |
-129.79 |
4,054.11 |
-3.10% |
|
Advancers |
663 |
21% |
|
Advancers |
352 |
11% |
|
S&P 500 |
-39.09 |
1,833.09 |
-2.09% |
|
Decliners |
2,408 |
76% |
|
Decliners |
2,707 |
87% |
|
Russell 2000 |
-32.30 |
1,127.66 |
-2.78% |
|
52 Wk Highs |
61 |
|
|
52 Wk Highs |
29 |
|
|
S&P 600 |
-16.13 |
650.77 |
-2.42% |
|
52 Wk Lows |
30 |
|
|
52 Wk Lows |
55 |
|
|
 |
Correction Prompting Members to Reduce Market Exposure
Kenneth J. Gruneisen - Passed the CAN SLIM® Master's Exam
Stocks suffered a setback on Thursday. The volume totals behind the damaging losses were reported higher on the NYSE and on the Nasdaq exchange, a sign of heavier selling pressure coming from the institutional crowd. Decliners led advancers by nearly a 4-1 margin on the NYSE and by more than 7-1 on the Nasdaq exchange. There were 5 high-ranked companies from the CANSLIM.net Leaders List that made new 52-week highs and appeared on the CANSLIM.net BreakOuts Page, down from the total of 15 stocks on the prior session. The list of stocks hitting new 52-week highs outnumbered new 52-week lows on the NYSE but new lows outnumbered new highs on the Nasdaq exchange. There were losses for all 5 high-ranked companies currently included on the Featured Stocks Page, a list that has grown shorter as numerous leaders have broken down in recent weeks. The Market (M criteria) pullback earned the label of a "correction" as a result of recent pressure on the indices, especially the tech-heavy Nasdaq Composite Index, coupled with waning leadership (fewer stocks hitting new 52-week highs). Investors are reminded to limit losses by always selling any stock that falls more than -7% from their purchase price. This is precisely how the fact-based investment system prompts investors to reduce their overall market exposure during weak periods.
The Dow was down 266 points to 16,170. The S&P 500 fell 39 points to 1,833. The NASDAQ lost 129 points to 4,054, its largest decline since November 2011. The major averages dropped and erased a two-day advance amid a resumed selloff in momentum stocks. Health care was the worst performing group as biotechnology stocks including Gilead Sciences (GILD -6.7%) and Amgen (AMGN -4.4%) fell hard. Losses in technology also dragged the market lower as Microsoft (MSFT -2.6%) and Facebook (FB -4.8%) both lost ground. Consumer stocks were also under pressure. Bed Bath & Beyond (BBBY -6.3%) fell after the retailer reported weak same-store sales and delivered a disappointing first-quarter outlook.
Earnings results will stay in focus as Friday's profit tally from JP Morgan Chase & Co (JPM )kicks off the reporting season for banks. The defensive telecommunications sector was the relative outperformer as it finished only marginally lower. AT&T (T +0.9%) and Windstream Holdings (WIN +2.5%) rose.
Treasury prices rallied and a government auction of 30-year debt attracted above average demand. The 10-year note gained 12/32 to yield 2.64%. The 30-year bond rose by a full point to yield 3.52%.
The CANSLIM.net Featured Stocks Page shows the most action-worthy candidates and their latest notes and a Headline Link directs members to the latest detailed analysis with data-packed graphs annotated by a Certified expert along with links to additional resources. The Premium Member Homepage includes "dynamic archives" to all prior pay reports published. Watch for an announcement via email concerning the next WEBCAST.
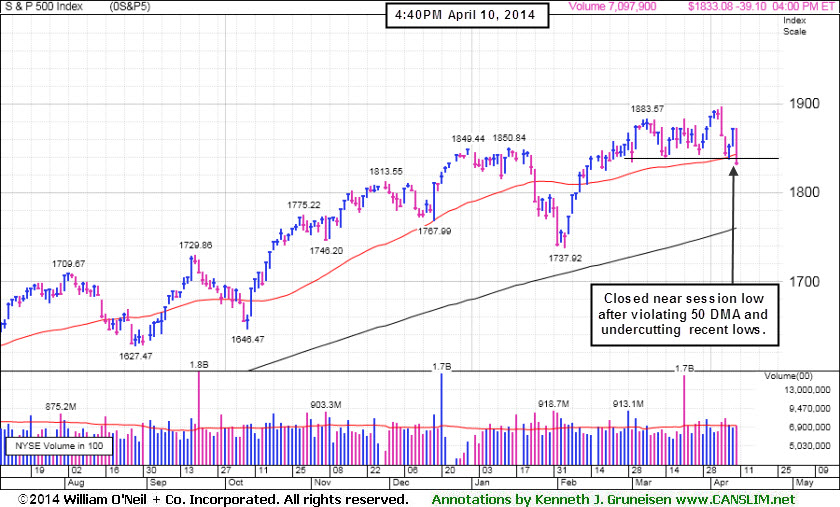
PICTURED: The S&P 500 Index ended near the session low after violating its 50-day moving average (DMA) line and undercutting prior lows. The technical deterioration added emphasis on the importance for investors to use caution and currently aim toward reducing market exposure.
|
 Kenneth J. Gruneisen started out as a licensed stockbroker in August 1987, a couple of months prior to the historic stock market crash that took the Dow Jones Industrial Average down -22.6% in a single day. He has published daily fact-based fundamental and technical analysis on high-ranked stocks online for two decades. Through FACTBASEDINVESTING.COM, Kenneth provides educational articles, news, market commentary, and other information regarding proven investment systems that work in good times and bad.
Comments contained in the body of this report are technical opinions only and are not necessarily those of Gruneisen Growth Corp. The material herein has been obtained from sources believed to be reliable and accurate, however, its accuracy and completeness cannot be guaranteed. Our firm, employees, and customers may effect transactions, including transactions contrary to any recommendation herein, or have positions in the securities mentioned herein or options with respect thereto. Any recommendation contained in this report may not be suitable for all investors and it is not to be deemed an offer or solicitation on our part with respect to the purchase or sale of any securities. |
|
 |
Tech Sector Leads Broad Declines in All Groups
Kenneth J. Gruneisen - Passed the CAN SLIM® Master's Exam
The Biotechnology Index ($BTK -5.64%) led the tech sector's pullback as the Semiconductor Index ($SOX -3.16%) and the Networking Index ($NWX -3.05%) also suffered large losses on Thursday. The Retail Index ($RLX -2.98%) was a negative influence along with weakness in financial shares as the Bank Index ($BKX -2.95%) and the Broker/Dealer Index ($XBD -2.79%) tumbled. Commodity-linked groups also had a negative bias as the Integrated Oil Index ($XOI -1.71%), Oil Services Index ($OSX -1.49%), and the Gold & Silver Index ($XAU -1.66%) fell.
Charts courtesy www.stockcharts.com
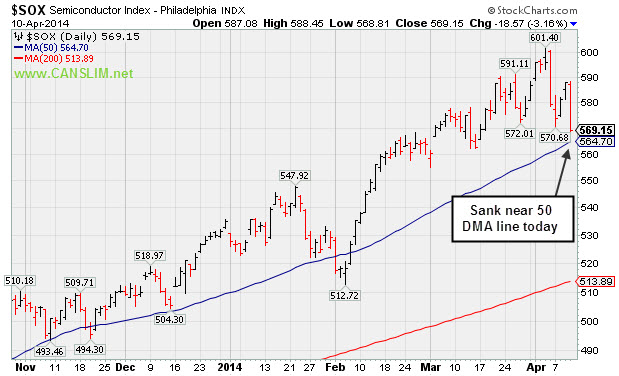
PICTURED: The Semiconductor Index ($SOX -3.16%) sank near its 50-day moving average (DMA) line with a big loss.
| Oil Services |
$OSX |
284.34 |
-4.31 |
-1.49% |
+1.18% |
| Integrated Oil |
$XOI |
1,522.38 |
-26.54 |
-1.71% |
+1.28% |
| Semiconductor |
$SOX |
569.15 |
-18.57 |
-3.16% |
+6.38% |
| Networking |
$NWX |
327.38 |
-10.31 |
-3.05% |
+1.06% |
| Broker/Dealer |
$XBD |
149.81 |
-4.30 |
-2.79% |
-6.69% |
| Retail |
$RLX |
860.66 |
-26.40 |
-2.98% |
-8.42% |
| Gold & Silver |
$XAU |
94.19 |
-1.59 |
-1.66% |
+11.93% |
| Bank |
$BKX |
68.86 |
-2.09 |
-2.95% |
-0.58% |
| Biotech |
$BTK |
2,438.35 |
-145.68 |
-5.64% |
+4.63% |
|
|
|
 |
Violated 50-Day Average and Relative Strength Rank Fell
Kenneth J. Gruneisen - Passed the CAN SLIM® Master's Exam
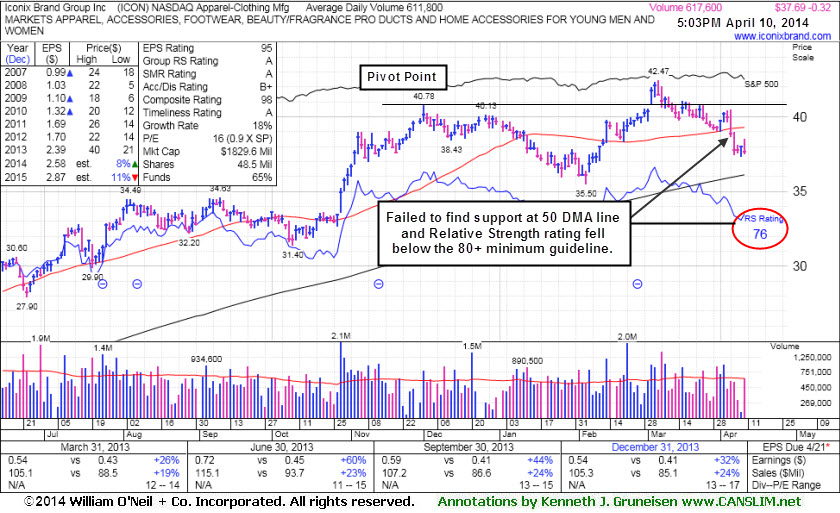
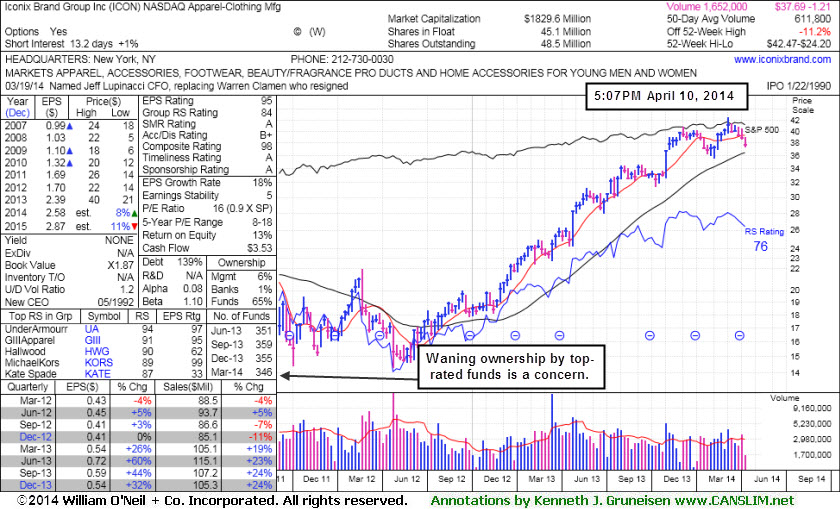
Iconix Brand Group Inc (ICON -$0.32 or -0.84% to $37.69) erased an early gain today and ended near the session low with a loss. After slumping back into its prior base weeks ago it had initially found support at its 50-day moving average (DMA) line. However, the recent deterioration below its 50 DMA line raised more concerns and triggered a technical sell signal. A rebound above the 50 DMA line would help its outlook. Meanwhile, its Relative Strength rating (see red circle on weekly graph below) has slumped to 76, below the 80+ minimum guideline for buy candidates. Also, the number of top-rated funds owning its shares fell from 359 in Sep '13 to 346 in Mar '14, not a reassuring sign concerning the I criteria.
ICON was last shown in this FSU section on 3/25/14 with annotated graphs under the headline, "Falling Back Under Prior Highs Raises Concerns", while a loss on higher (above average) volume indicated that it was encountering distributional pressure. Members were reminded - "Disciplined investors always limit losses by selling any stock that falls more than -7% from their purchase price."
Fundamentals remain strong for the high-ranked Apparel - Clothing Manufacturing firm. It reported earnings +32% on +24% sales revenues for the Dec '13 quarter, marking its 4th consecutive quarterly earnings increase above the +25% guideline (C criteria). Its annual earnings (A criteria) history has been steady.
|
|
|
Color Codes Explained :
Y - Better candidates highlighted by our
staff of experts.
G - Previously featured
in past reports as yellow but may no longer be buyable under the
guidelines.
***Last / Change / Volume data in this table is the closing quote data***
Symbol/Exchange
Company Name
Industry Group |
PRICE |
CHANGE
(%Change) |
Day High |
Volume
(% DAV)
(% 50 day avg vol) |
52 Wk Hi
% From Hi |
Featured
Date |
Price
Featured |
Pivot Featured |
|
Max Buy |
EQM
-
NYSE
E Q T Midstream Partners
ENERGY - Oil and Gas Pipelines
|
$70.92
|
-0.52
-0.73% |
$72.30
|
96,916
86.53% of 50 DAV
50 DAV is 112,000
|
$73.43
-3.42%
|
12/12/2013
|
$53.17
|
PP = $56.51
|
|
MB = $59.34
|
Most Recent Note - 4/9/2014 5:23:14 PM
G - Still holding its ground and in strong shape, technically, despite fundamental concerns recently noted. Its 50 DMA line defines near-term support where a violation may trigger a technical sell signal. See the latest FSU analysis for more details and new annotated graphs.
>>> FEATURED STOCK ARTICLE : Technical Strength Continues Despite Fundamental Concerns - 4/9/2014
View all notes |
Set NEW NOTE alert |
CANSLIM.net Company Profile |
SEC
News |
Chart |
Request a new note
C
A N
S L
I M


|
GNRC
-
NYSE
Generac Hldgs Inc
Electrical-Power/Equipmt
|
$57.49
|
-1.38
-2.34% |
$58.90
|
554,115
69.26% of 50 DAV
50 DAV is 800,000
|
$62.50
-8.02%
|
2/14/2014
|
$56.50
|
PP = $57.39
|
|
MB = $60.26
|
Most Recent Note - 4/8/2014 6:27:04 PM
Y - Finding support at its 50 DMA line and near prior highs in the $57 area. More damaging losses below its recent low ($56.38 on 3/27/14) would raise greater concerns.
>>> FEATURED STOCK ARTICLE : Perched Near Highs With Mostly Quiet Volume Totals - 3/31/2014
View all notes |
Set NEW NOTE alert |
CANSLIM.net Company Profile |
SEC
News |
Chart |
Request a new note
C
A N
S L
I M
|
ICON
-
NASDAQ
Iconix Brand Group Inc
CONSUMER NON-DURABLES - Textile - Apparel Footwear
|
$37.69
|
-0.32
-0.84% |
$38.51
|
608,899
99.53% of 50 DAV
50 DAV is 611,800
|
$42.47
-11.25%
|
3/7/2014
|
$41.46
|
PP = $40.88
|
|
MB = $42.92
|
 Most Recent Note - 4/10/2014 5:24:37 PM
G - Recently violated its 50 DMA line and prior low triggering technical sell signals. A rebound above the 50 DMA line would help its outlook. See the latest FSU analysis for more details with new annotated graphs.
>>> FEATURED STOCK ARTICLE : Violated 50-Day Average and Relative Strength Rank Fell - 4/10/2014
View all notes |
Set NEW NOTE alert |
CANSLIM.net Company Profile |
SEC
News |
Chart |
Request a new note
C
A N
S L
I M
|
PSIX
-
NASDAQ
Power Solutions Intl Inc
Machinery-Gen Industrial
|
$71.41
|
-2.58
-3.49% |
$76.00
|
82,471
130.91% of 50 DAV
50 DAV is 63,000
|
$87.40
-18.29%
|
2/28/2014
|
$74.65
|
PP = $76.93
|
|
MB = $80.78
|
Most Recent Note - 4/8/2014 6:22:05 PM
Y - Rebounded above its 50 DMA line with today's volume-driven gain and its color code is changed to yellow. The prior session's low ($66.03) defines important near-term support where further deterioration would raise greater concerns.
>>> FEATURED STOCK ARTICLE : Found Prompt Support Near 50-Day Average After Dip Back Into Prior Base - 4/1/2014
View all notes |
Set NEW NOTE alert |
CANSLIM.net Company Profile |
SEC
News |
Chart |
Request a new note
C
A N
S L
I M
|
SILC
-
NASDAQ
Silicom Ltd
COMPUTER HARDWARE - Networking andamp; Communication Dev
|
$58.55
|
-2.06
-3.40% |
$60.78
|
111,969
139.96% of 50 DAV
50 DAV is 80,000
|
$73.44
-20.28%
|
12/23/2013
|
$44.62
|
PP = $46.25
|
|
MB = $48.56
|
Most Recent Note - 4/10/2014 5:27:32 PM
G - Slumped under the recent low ($58.12 on 3/26/14) intra-day yet halted its slide and closed near the middle of the session's trading range. A rebound above its 50 DMA line is needed to help its outlook improve.
>>> FEATURED STOCK ARTICLE : Halted Slide Following 50-Day Moving Average Violation - 4/3/2014
View all notes |
Set NEW NOTE alert |
CANSLIM.net Company Profile |
SEC
News |
Chart |
Request a new note
C
A N
S L
I M
|
Symbol/Exchange
Company Name
Industry Group |
PRICE |
CHANGE
(%Change) |
Day High |
Volume
(% DAV)
(% 50 day avg vol) |
52 Wk Hi
% From Hi |
Featured
Date |
Price
Featured |
Pivot Featured |
|
Max Buy |
|
|
|
THESE ARE NOT BUY RECOMMENDATIONS!
Comments contained in the body of this report are technical
opinions only. The material herein has been obtained
from sources believed to be reliable and accurate, however,
its accuracy and completeness cannot be guaranteed.
This site is not an investment advisor, hence it does
not endorse or recommend any securities or other investments.
Any recommendation contained in this report may not
be suitable for all investors and it is not to be deemed
an offer or solicitation on our part with respect to
the purchase or sale of any securities. All trademarks,
service marks and trade names appearing in this report
are the property of their respective owners, and are
likewise used for identification purposes only.
This report is a service available
only to active Paid Premium Members.
You may opt-out of receiving report notifications
at any time. Questions or comments may be submitted
by writing to Premium Membership Services 665 S.E. 10 Street, Suite 201 Deerfield Beach, FL 33441-5634 or by calling 1-800-965-8307
or 954-785-1121.
|
|
|

