***Last / Change / Volume data in this table is the closing quote data***
Symbol/Exchange
Company Name
Industry Group |
PRICE |
CHANGE
(%Change) |
Day High |
Volume
(% DAV)
(% 50 day avg vol) |
52 Wk Hi
% From Hi |
Featured
Date |
Price
Featured |
Pivot Featured |
|
Max Buy |
ACN
-
NYSE
Accenture Plc
DIVERSIFIED SERVICES - Business/Management Services
|
$63.15
|
-0.59
-0.93% |
$63.79
|
3,986,935
124.48% of 50 DAV
50 DAV is 3,202,900
|
$65.89
-4.16%
|
3/23/2012
|
$64.13
|
PP = $63.76
|
|
MB = $66.95
|
Most Recent Note - 4/4/2012 4:14:12 PM
Y - Holding its ground with volume totals cooling since the gain above the pivot point on 3/23/12 backed by +88% above average volume triggered a new (or add-on) technical buy signal. Prior highs in the $62-63 area define initial support to watch above its 50 DMA line.
>>> The latest Featured Stock Update with an annotated graph appeared on 3/23/2012. Click here.
View all notes |
Alert me of new notes |
CANSLIM.net Company Profile |
SEC |
Zacks Reports |
StockTalk |
News |
Chart |
Request a new note
C
A N
S L
I M


|
ADS
-
NYSE
Alliance Data Sys Corp
COMPUTER SOFTWARE and SERVICES - Information and Delivery Service
|
$123.15
|
-3.05
-2.42% |
$126.30
|
583,333
90.58% of 50 DAV
50 DAV is 644,000
|
$127.71
-3.57%
|
1/17/2012
|
$108.24
|
PP = $107.43
|
|
MB = $112.80
|
 Most Recent Note - 4/10/2012 6:16:33 PM
G - Pulling back from its all-time high toward its 50 DMA line with today's 4th consecutive loss. Fundamental concerns were raised by earnings reported +9%, well below the +25% minimum guideline in the latest quarter ended December 31, 2011.
>>> The latest Featured Stock Update with an annotated graph appeared on 2/29/2012. Click here.
View all notes |
Alert me of new notes |
CANSLIM.net Company Profile |
SEC |
Zacks Reports |
StockTalk |
News |
Chart |
Request a new note
C
A N
S L
I M
|
ALLT
-
NASDAQ
Allot Communications Ltd
COMPUTER SOFTWARE andamp; SERVICES - Technical andamp; System Software
|
$23.05
|
-1.38
-5.65% |
$24.57
|
785,169
168.96% of 50 DAV
50 DAV is 464,700
|
$24.96
-7.65%
|
3/13/2012
|
$19.72
|
PP = $18.91
|
|
MB = $19.86
|
Most Recent Note - 4/10/2012 3:57:00 PM
G - Pulling back from its 52-week high amid widespread weakness today. Extended from its prior base, with the prior highs near $18-19 defining initial support to watch on pullbacks.
>>> The latest Featured Stock Update with an annotated graph appeared on 3/19/2012. Click here.
View all notes |
Alert me of new notes |
CANSLIM.net Company Profile |
SEC |
Zacks Reports |
StockTalk |
News |
Chart |
Request a new note
C
A N
S L
I M
|
ALXN
-
NASDAQ
Alexion Pharmaceuticals
DRUGS - Drug Manufacturers - Other
|
$89.22
|
-2.66
-2.90% |
$92.17
|
1,238,304
95.94% of 50 DAV
50 DAV is 1,290,700
|
$95.01
-6.09%
|
3/12/2012
|
$87.87
|
PP = $87.73
|
|
MB = $92.12
|
Most Recent Note - 4/10/2012 6:18:12 PM
G - Down today with higher (near average) volume, encountering profit-taking pressure amid widespread market weakness. Support to watch is at its 50 DMA line ($85.73).
>>> The latest Featured Stock Update with an annotated graph appeared on 2/24/2012. Click here.
View all notes |
Alert me of new notes |
CANSLIM.net Company Profile |
SEC |
Zacks Reports |
StockTalk |
News |
Chart |
Request a new note
C
A N
S L
I M
|
BODY
-
NASDAQ
Body Central Corp
RETAIL - Catalog andamp; Mail Order Houses
|
$26.24
|
-0.59
-2.20% |
$26.82
|
240,764
112.72% of 50 DAV
50 DAV is 213,600
|
$29.49
-11.02%
|
1/27/2012
|
$26.69
|
PP = $25.46
|
|
MB = $26.73
|
Most Recent Note - 4/10/2012 6:19:36 PM
G - Slumped further below its 50 DMA line with higher (near average) volume today, raising concerns. Recent lows during its consolidation are the next important chart support area below its short-term average. Subsequent damaging losses may trigger more worrisome technical sell signals.
>>> The latest Featured Stock Update with an annotated graph appeared on 3/13/2012. Click here.
View all notes |
Alert me of new notes |
CANSLIM.net Company Profile |
SEC |
Zacks Reports |
StockTalk |
News |
Chart |
Request a new note
C
A N
S L
I M
|
Symbol/Exchange
Company Name
Industry Group |
PRICE |
CHANGE
(%Change) |
Day High |
Volume
(% DAV)
(% 50 day avg vol) |
52 Wk Hi
% From Hi |
Featured
Date |
Price
Featured |
Pivot Featured |
|
Max Buy |
CDNS
-
NASDAQ
Cadence Design Systems
COMPUTER SOFTWARE and SERVICES - Technical and System Software
|
$11.24
|
-0.33
-2.85% |
$11.60
|
3,325,006
102.02% of 50 DAV
50 DAV is 3,259,300
|
$12.60
-10.79%
|
2/3/2012
|
$11.66
|
PP = $11.15
|
|
MB = $11.71
|
Most Recent Note - 4/10/2012 6:10:20 PM
G - Volume was higher (near average) today while slumping further below its 50 DMA line, raising concerns. Finished the session at the prior low ($11.24 on 3/06/12) previously noted as the next important support level to watch.
>>> The latest Featured Stock Update with an annotated graph appeared on 3/28/2012. Click here.
View all notes |
Alert me of new notes |
CANSLIM.net Company Profile |
SEC |
Zacks Reports |
StockTalk |
News |
Chart |
Request a new note
C
A N
S L
I M
|
CELG
-
NASDAQ
Celgene Corp
DRUGS - Drug Manufacturers - Major
|
$79.20
|
-0.05
-0.06% |
$79.39
|
4,146,922
150.23% of 50 DAV
50 DAV is 2,760,400
|
$80.42
-1.52%
|
2/2/2012
|
$74.16
|
PP = $75.21
|
|
MB = $78.97
|
Most Recent Note - 4/4/2012 11:59:23 AM
G - Pulling back today following a gain backed by +52% above average volume that confirmed a technical buy signal. Color code was changed to green after quickly rallying above its "max buy" level. Its 50 DMA line defines support to watch.
>>> The latest Featured Stock Update with an annotated graph appeared on 3/26/2012. Click here.
View all notes |
Alert me of new notes |
CANSLIM.net Company Profile |
SEC |
Zacks Reports |
StockTalk |
News |
Chart |
Request a new note
C
A N
S L
I M
|
COO
-
NYSE
Cooper Companies Inc
HEALTH SERVICES - Medical Instruments and Supplies
|
$81.53
|
-1.17
-1.41% |
$83.13
|
627,608
151.71% of 50 DAV
50 DAV is 413,700
|
$84.20
-3.17%
|
3/9/2012
|
$83.05
|
PP = $81.02
|
|
MB = $85.07
|
Most Recent Note - 4/10/2012 6:12:27 PM
Y - Small loss today on higher volume. Still perched near its 52-week high and above its pivot point with no resistance remaining. While trading sideways in recent weeks its Relative Strength rating slumped, and now at a mediocre 77, that rating is below the 80+ guideline for buy candidates.
>>> The latest Featured Stock Update with an annotated graph appeared on 3/9/2012. Click here.
View all notes |
Alert me of new notes |
CANSLIM.net Company Profile |
SEC |
Zacks Reports |
StockTalk |
News |
Chart |
Request a new note
C
A N
S L
I M
|
DISH
-
NASDAQ
Dish Network Corp Cl A
CONSUMER DURABLES - Electronic Equipment
|
$31.40
|
-0.78
-2.42% |
$32.32
|
1,456,360
55.22% of 50 DAV
50 DAV is 2,637,400
|
$35.64
-11.90%
|
3/7/2012
|
$30.83
|
PP = $30.10
|
|
MB = $31.61
|
Most Recent Note - 4/10/2012 6:14:18 PM
Y - Down today on below average volume. Color code is changed to yellow while consolidating under its "max buy" level and above prior highs in the $30 area defining initial support to watch on pullbacks.
>>> The latest Featured Stock Update with an annotated graph appeared on 3/14/2012. Click here.
View all notes |
Alert me of new notes |
CANSLIM.net Company Profile |
SEC |
Zacks Reports |
StockTalk |
News |
Chart |
Request a new note
C
A N
S L
I M
|
FEIC
-
NASDAQ
F E I Co
ELECTRONICS - Diversified Electronics
|
$46.85
|
-0.68
-1.43% |
$47.60
|
354,205
112.77% of 50 DAV
50 DAV is 314,100
|
$49.92
-6.15%
|
12/7/2011
|
$41.41
|
PP = $42.35
|
|
MB = $44.47
|
Most Recent Note - 4/10/2012 6:21:39 PM
G - Down today with higher (near average) volume, slumping toward its 50 DMA line. The latest quarterly report showed +21% earnings for the Dec '11 quarter, below the +25% minimum guideline for earnings growth.
>>> The latest Featured Stock Update with an annotated graph appeared on 3/12/2012. Click here.
View all notes |
Alert me of new notes |
CANSLIM.net Company Profile |
SEC |
Zacks Reports |
StockTalk |
News |
Chart |
Request a new note
C
A N
S L
I M
|
Symbol/Exchange
Company Name
Industry Group |
PRICE |
CHANGE
(%Change) |
Day High |
Volume
(% DAV)
(% 50 day avg vol) |
52 Wk Hi
% From Hi |
Featured
Date |
Price
Featured |
Pivot Featured |
|
Max Buy |
GNC
-
NYSE
G N C Holdings Inc
RETAIL - Drug Stores
|
$33.93
|
-1.36
-3.85% |
$35.91
|
1,534,938
97.26% of 50 DAV
50 DAV is 1,578,100
|
$36.10
-6.01%
|
1/19/2012
|
$28.99
|
PP = $29.60
|
|
MB = $31.08
|
Most Recent Note - 4/10/2012 5:36:34 PM
G - Down today for its 4th consecutive loss since hitting its all-time high. Its 50 DMA line defines near-term chart support to watch on pullbacks. It completed Secondary Offerings on 10/25/11 and 3/13/12 after making steady progress following its 4/01/11 IPO.
>>> The latest Featured Stock Update with an annotated graph appeared on 3/5/2012. Click here.
View all notes |
Alert me of new notes |
CANSLIM.net Company Profile |
SEC |
Zacks Reports |
StockTalk |
News |
Chart |
Request a new note
C
A N
S L
I M
|
HLF
-
NYSE
Herbalife Ltd
DRUGS - Nutrition and Weight Management
|
$67.88
|
-0.85
-1.24% |
$69.27
|
1,428,012
105.54% of 50 DAV
50 DAV is 1,353,000
|
$72.11
-5.87%
|
2/22/2012
|
$65.90
|
PP = $63.50
|
|
MB = $66.68
|
Most Recent Note - 4/4/2012 4:25:19 PM
G - Hovering only -3.4% off its all-time high today, stubbornly holding its ground after getting extended from its prior base pattern. Prior highs in the $63 area define support to watch on pullbacks.
>>> The latest Featured Stock Update with an annotated graph appeared on 2/22/2012. Click here.
View all notes |
Alert me of new notes |
CANSLIM.net Company Profile |
SEC |
Zacks Reports |
StockTalk |
News |
Chart |
Request a new note
C
A N
S L
I M
|
ISRG
-
NASDAQ
Intuitive Surgical Inc
HEALTH SERVICES - Medical Appliances and Equipment
|
$535.24
|
-3.83
-0.71% |
$538.97
|
347,067
126.16% of 50 DAV
50 DAV is 275,100
|
$550.47
-2.77%
|
12/20/2011
|
$442.43
|
PP = $449.16
|
|
MB = $471.62
|
Most Recent Note - 4/4/2012 4:28:11 PM
G - On track for its 8th consecutive weekly gain. Stubbornly holding its ground and rising, extended from any sound base pattern. Previously noted - "The December '11 quarterly earnings increased by just below the borderline +25% minimum guideline for ideal buy candidates. Rather than compromise, disciplined investors may sooner consider another Featured Stock when a fresh technical buy signal occurs."
>>> The latest Featured Stock Update with an annotated graph appeared on 3/1/2012. Click here.
View all notes |
Alert me of new notes |
CANSLIM.net Company Profile |
SEC |
Zacks Reports |
StockTalk |
News |
Chart |
Request a new note
C
A N
S L
I M
|
LULU
-
NASDAQ
Lululemon Athletica
MANUFACTURING - Textile Manufacturing
|
$71.44
|
-4.53
-5.96% |
$76.08
|
3,296,016
169.78% of 50 DAV
50 DAV is 1,941,400
|
$77.13
-7.38%
|
1/10/2012
|
$60.97
|
PP = $59.46
|
|
MB = $62.43
|
Most Recent Note - 4/10/2012 5:30:17 PM
G - Down considerably today with above average volume, enduring distributional pressure amid widespread market weakness. The damaging loss violated the previously noted upward trendline connecting January-March lows defining initial near-term chart support above its 50 DMA line, raising concerns.
>>> The latest Featured Stock Update with an annotated graph appeared on 2/21/2012. Click here.
View all notes |
Alert me of new notes |
CANSLIM.net Company Profile |
SEC |
Zacks Reports |
StockTalk |
News |
Chart |
Request a new note
C
A N
S L
I M
|
MA
-
NYSE
Mastercard Inc Cl A
DIVERSIFIED SERVICES - Business/Management Services
|
$424.73
|
-14.56
-3.31% |
$440.95
|
1,261,439
134.15% of 50 DAV
50 DAV is 940,300
|
$442.20
-3.95%
|
3/12/2012
|
$419.86
|
PP = $428.67
|
|
MB = $450.10
|
Most Recent Note - 4/10/2012 5:56:37 PM
Y - Down today with volume above average, finishing near the session low amid widespread market weakness. Its 50 DMA line defines near-term support to watch.
>>> The latest Featured Stock Update with an annotated graph appeared on 2/17/2012. Click here.
View all notes |
Alert me of new notes |
CANSLIM.net Company Profile |
SEC |
Zacks Reports |
StockTalk |
News |
Chart |
Request a new note
C
A N
S L
I M
|
Symbol/Exchange
Company Name
Industry Group |
PRICE |
CHANGE
(%Change) |
Day High |
Volume
(% DAV)
(% 50 day avg vol) |
52 Wk Hi
% From Hi |
Featured
Date |
Price
Featured |
Pivot Featured |
|
Max Buy |
MELI
-
NASDAQ
Mercadolibre Inc
INTERNET - Internet Software and; Services
|
$93.28
|
-3.25
-3.37% |
$98.65
|
401,654
80.88% of 50 DAV
50 DAV is 496,600
|
$104.50
-10.74%
|
2/6/2012
|
$97.09
|
PP = $95.58
|
|
MB = $100.36
|
Most Recent Note - 4/10/2012 5:59:12 PM
G - Color code is changed to green after it violated its 50 DMA line with a damaging loss today on below average volume, raising concerns and triggering a technical sell signal. Only a prompt rebound above that short-term average would help its outlook improve. The recent low ($91.38 on 3/06/12) defines the next important support area to watch.
>>> The latest Featured Stock Update with an annotated graph appeared on 3/29/2012. Click here.
View all notes |
Alert me of new notes |
CANSLIM.net Company Profile |
SEC |
Zacks Reports |
StockTalk |
News |
Chart |
Request a new note
C
A N
S L
I M
|
MG
-
NYSE
Mistras Group Inc
DIVERSIFIED SERVICES - Bulding and Faci;ity Management Services
|
$23.30
|
+0.09
0.39% |
$23.50
|
130,068
111.26% of 50 DAV
50 DAV is 116,900
|
$26.24
-11.20%
|
3/22/2012
|
$24.96
|
PP = $26.34
|
|
MB = $27.66
|
Most Recent Note - 4/4/2012 11:07:41 AM
G - Down today, consolidating just above its 50 DMA line. Color code is changed to green, meanwhile gains above its recent chart highs are needed to help its technical stance improve. It has remained below the new pivot point cited in the 3/22/12 mid-day report based on its 52-week high plus 10 cents, not triggering a technical buy signal.
>>> The latest Featured Stock Update with an annotated graph appeared on 4/2/2012. Click here.
View all notes |
Alert me of new notes |
CANSLIM.net Company Profile |
SEC |
Zacks Reports |
StockTalk |
News |
Chart |
Request a new note
C
A N
S L
I M
|
MKTX
-
NASDAQ
Marketaxess Holdings Inc
FINANCIAL SERVICES - Investment Brokerage - Nationa
|
$36.21
|
-0.41
-1.12% |
$36.89
|
191,058
67.16% of 50 DAV
50 DAV is 284,500
|
$37.95
-4.58%
|
3/8/2012
|
$35.80
|
PP = $35.52
|
|
MB = $37.30
|
Most Recent Note - 4/4/2012 4:30:36 PM
Y - Volume totals have been cooling while consolidating near its all-time high. Color code is changed to yellow after quietly dipping just under its "max buy" level. Its 50 DMA line defines important support to watch.
>>> The latest Featured Stock Update with an annotated graph appeared on 3/8/2012. Click here.
View all notes |
Alert me of new notes |
CANSLIM.net Company Profile |
SEC |
Zacks Reports |
StockTalk |
News |
Chart |
Request a new note
C
A N
S L
I M
|
NTES
-
NASDAQ
Netease.Com Inc Adr
INTERNET - Internet Information Providers
|
$55.58
|
-2.17
-3.76% |
$58.69
|
588,495
86.57% of 50 DAV
50 DAV is 679,800
|
$60.47
-8.09%
|
3/19/2012
|
$56.18
|
PP = $55.10
|
|
MB = $57.86
|
Most Recent Note - 4/10/2012 6:03:07 PM
Y - Color code is changed to yellow, however subsequent losses may raise greater concerns. Considerable loss today with below average volume, slumping near its old highs in the $55 area previously noted as initial support to watch on pullbacks.
>>> The latest Featured Stock Update with an annotated graph appeared on 3/27/2012. Click here.
View all notes |
Alert me of new notes |
CANSLIM.net Company Profile |
SEC |
Zacks Reports |
StockTalk |
News |
Chart |
Request a new note
C
A N
S L
I M
|
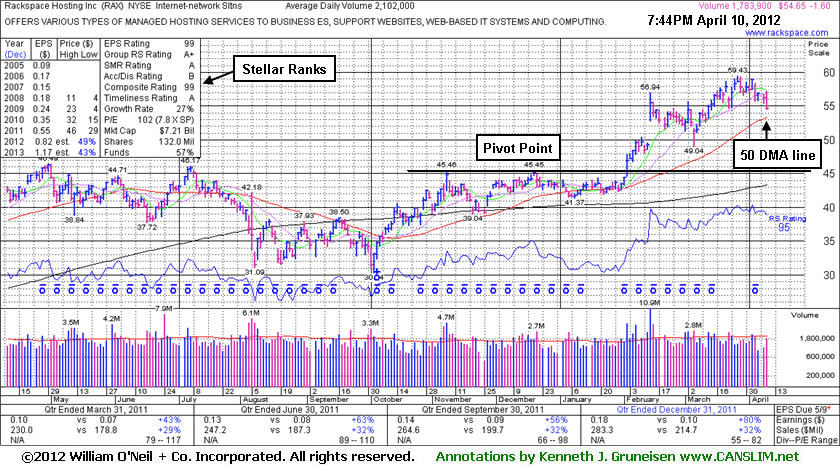
RAX
-
NYSE
Rackspace Hosting Inc
INTERNET - Internet Software and; Services
|
$54.65
|
-1.60
-2.84% |
$57.20
|
2,086,329
99.25% of 50 DAV
50 DAV is 2,102,000
|
$59.43
-8.04%
|
2/2/2012
|
$46.69
|
PP = $45.55
|
|
MB = $47.83
|
Most Recent Note - 4/10/2012 8:00:22 PM
G - Pulled back today with higher (near average) volume. It remains extended from its prior base. Its 50 DMA line ($53.37) defines important near-term support to watch. See the latest FSU analysis for more details and a new annotated graph.
>>> The latest Featured Stock Update with an annotated graph appeared on 4/10/2012. Click here.
View all notes |
Alert me of new notes |
CANSLIM.net Company Profile |
SEC |
Zacks Reports |
StockTalk |
News |
Chart |
Request a new note
C
A N
S L
I M
|
Symbol/Exchange
Company Name
Industry Group |
PRICE |
CHANGE
(%Change) |
Day High |
Volume
(% DAV)
(% 50 day avg vol) |
52 Wk Hi
% From Hi |
Featured
Date |
Price
Featured |
Pivot Featured |
|
Max Buy |
RGR
-
NYSE
Sturm Ruger & Co Inc
CONSUMER DURABLES - Sporting Goods
|
$47.19
|
-3.13
-6.22% |
$50.30
|
875,770
262.13% of 50 DAV
50 DAV is 334,100
|
$53.29
-11.45%
|
3/22/2012
|
$46.49
|
PP = $46.78
|
|
MB = $49.12
|
Most Recent Note - 4/10/2012 5:34:51 PM
G - Damaging loss today with above average volume amid widespread market weakness. As previoulsy noted - "Prior high in the $46 area defines initial chart support to watch on pullbacks toward its 50 DMA line."
>>> The latest Featured Stock Update with an annotated graph appeared on 3/22/2012. Click here.
View all notes |
Alert me of new notes |
CANSLIM.net Company Profile |
SEC |
Zacks Reports |
StockTalk |
News |
Chart |
Request a new note
C
A N
S L
I M
|
RRTS
-
NYSE
Roadrunner Trans Systems
TRANSPORTATION - Air Delivery and Freight Service
|
$16.78
|
-0.67
-3.84% |
$17.43
|
83,841
61.78% of 50 DAV
50 DAV is 135,700
|
$18.59
-9.74%
|
2/10/2012
|
$17.40
|
PP = $17.50
|
|
MB = $18.38
|
Most Recent Note - 4/10/2012 3:54:59 PM
G - Damaging loss today, violating its 50 DMA line and sinking under prior highs, raising concerns and triggering technical sell signals. Color code is changed to green. Only a prompt rebound above the 50 DMA would help its outlook.
>>> The latest Featured Stock Update with an annotated graph appeared on 4/9/2012. Click here.
View all notes |
Alert me of new notes |
CANSLIM.net Company Profile |
SEC |
Zacks Reports |
StockTalk |
News |
Chart |
Request a new note
C
A N
S L
I M
|
SHFL
-
NASDAQ
Shuffle Master Inc
MANUFACTURING - Diversified Machinery
|
$16.51
|
-0.74
-4.29% |
$17.25
|
982,403
153.17% of 50 DAV
50 DAV is 641,400
|
$18.77
-12.04%
|
3/6/2012
|
$17.07
|
PP = $15.25
|
|
MB = $16.01
|
Most Recent Note - 4/10/2012 5:38:47 PM
G - Down today with above average volume for its 4th consecutive loss since hitting its 52-week high. It is extended from any sound base pattern. Its 50 DMA line defines support to watch on pullbacks.
>>> The latest Featured Stock Update with an annotated graph appeared on 3/15/2012. Click here.
View all notes |
Alert me of new notes |
CANSLIM.net Company Profile |
SEC |
Zacks Reports |
StockTalk |
News |
Chart |
Request a new note
C
A N
S L
I M
|
SWI
-
NYSE
Solarwinds Inc
COMPUTER SOFTWARE and SERVICES - Application Software
|
$35.42
|
-1.90
-5.09% |
$37.58
|
1,589,359
124.49% of 50 DAV
50 DAV is 1,276,700
|
$42.22
-16.11%
|
1/26/2012
|
$32.36
|
PP = $33.78
|
|
MB = $35.47
|
Most Recent Note - 4/10/2012 5:54:30 PM
Violated its 50 DMA line and sank to a close below a prior low ($35.72 on 3/06/12) as a damaging loss today with above average volume triggered technical sell signals. Earnings below the +25% guideline for the Dec '11 quarter raised fundamental concerns. A prompt rebound above the short-term average would help its outlook improve, however, based on its recent deterioration it is being dropped from the Featured Stocks list tonight.
>>> The latest Featured Stock Update with an annotated graph appeared on 3/16/2012. Click here.
View all notes |
Alert me of new notes |
CANSLIM.net Company Profile |
SEC |
Zacks Reports |
StockTalk |
News |
Chart |
Request a new note
C
A N
S L
I M
|
SXCI
-
NASDAQ
S X C Health Solutions
COMPUTER SOFTWARE and SERVICES - Healthcare Information Service
|
$75.86
|
-2.00
-2.57% |
$78.37
|
396,584
94.11% of 50 DAV
50 DAV is 421,400
|
$79.26
-4.29%
|
2/23/2012
|
$68.24
|
PP = $66.05
|
|
MB = $69.35
|
Most Recent Note - 4/10/2012 6:23:30 PM
G - Pulled back today with near average volume, consolidating from last week's new 52-week high. Extended from its prior base, its 50 DMA line defines support to watch on pullbacks.
>>> The latest Featured Stock Update with an annotated graph appeared on 3/6/2012. Click here.
View all notes |
Alert me of new notes |
CANSLIM.net Company Profile |
SEC |
Zacks Reports |
StockTalk |
News |
Chart |
Request a new note
C
A N
S L
I M
|
Symbol/Exchange
Company Name
Industry Group |
PRICE |
CHANGE
(%Change) |
Day High |
Volume
(% DAV)
(% 50 day avg vol) |
52 Wk Hi
% From Hi |
Featured
Date |
Price
Featured |
Pivot Featured |
|
Max Buy |
TDG
-
NYSE
Transdigm Group Inc
AEROSPACE/DEFENSE - Aerospace/Defense Products and; Services
|
$111.93
|
-2.77
-2.41% |
$116.26
|
672,981
159.21% of 50 DAV
50 DAV is 422,700
|
$121.48
-7.86%
|
2/29/2012
|
$120.10
|
PP = $118.93
|
|
MB = $124.88
|
Most Recent Note - 4/10/2012 1:11:24 PM
G - Slumping further below its latest pivot point cited, not having triggered a new buy signal. Color code is changed to green as concerns are raised while violating its 50 DMA line today. Only a prompt rebound would help its outlook improve, meanwhile, further deterioration below prior lows ($110.60 on 3/20/12) may trigger a more worrisome technical sell signal.
>>> The latest Featured Stock Update with an annotated graph appeared on 3/30/2012. Click here.
View all notes |
Alert me of new notes |
CANSLIM.net Company Profile |
SEC |
Zacks Reports |
StockTalk |
News |
Chart |
Request a new note
C
A N
S L
I M
|
TIBX
-
NASDAQ
Tibco Software Inc
COMPUTER SOFTWARE and SERVICES - Business Software and Services
|
$31.93
|
-0.89
-2.71% |
$33.09
|
3,232,332
128.80% of 50 DAV
50 DAV is 2,509,600
|
$33.11
-3.56%
|
3/30/2012
|
$31.01
|
PP = $31.25
|
|
MB = $32.81
|
Most Recent Note - 4/10/2012 6:26:44 PM
Y - Volume was higher and slightly above average behind today's loss and close below its "max buy" level after trading near its 52-week high. Color code is changed to yellow, however more damaging losses may raise greater concerns. Recent low ($30.03 on 4/02/12) defines a near-term support level to watch above its 50 DMA line.
>>> The latest Featured Stock Update with an annotated graph appeared on 4/5/2012. Click here.
View all notes |
Alert me of new notes |
CANSLIM.net Company Profile |
SEC |
Zacks Reports |
StockTalk |
News |
Chart |
Request a new note
C
A N
S L
I M
|
TNGO
-
NASDAQ
Tangoe Inc
COMPUTER SOFTWARE and SERVICES - Technical and System Software
|
$17.05
|
-1.49
-8.04% |
$18.70
|
884,567
144.09% of 50 DAV
50 DAV is 613,900
|
$20.05
-14.96%
|
3/27/2012
|
$19.35
|
PP = $20.00
|
|
MB = $21.00
|
Most Recent Note - 4/10/2012 3:26:57 PM
G - Violating its 50 DMA line again with today's damaging loss on higher volume. Color code is changed to green as deterioration below that important short-term average raises concerns.
>>> The latest Featured Stock Update with an annotated graph appeared on 4/3/2012. Click here.
View all notes |
Alert me of new notes |
CANSLIM.net Company Profile |
SEC |
Zacks Reports |
StockTalk |
News |
Chart |
Request a new note
C
A N
S L
I M
|
TSCO
-
NASDAQ
Tractor Supply Co
SPECIALTY RETAIL - Specialty Retail, Other
|
$90.84
|
-2.18
-2.34% |
$93.04
|
1,258,440
193.81% of 50 DAV
50 DAV is 649,300
|
$93.50
-2.84%
|
1/12/2012
|
$79.12
|
PP = $75.58
|
|
MB = $79.36
|
Most Recent Note - 4/10/2012 1:13:21 PM
G - Pulling back today after recently wedging up with light volume for another new all-time high. Its 50 DMA line defines support to watch on pullbacks.
>>> The latest Featured Stock Update with an annotated graph appeared on 2/27/2012. Click here.
View all notes |
Alert me of new notes |
CANSLIM.net Company Profile |
SEC |
Zacks Reports |
StockTalk |
News |
Chart |
Request a new note
C
A N
S L
I M
|
UA
-
NYSE
Under Armour Inc Cl A
CONSUMER NON-DURABLES - Textile - Apparel Clothing
|
$92.25
|
-3.02
-3.17% |
$95.44
|
979,539
95.29% of 50 DAV
50 DAV is 1,028,000
|
$99.35
-7.14%
|
2/15/2012
|
$85.77
|
PP = $84.86
|
|
MB = $89.10
|
Most Recent Note - 4/10/2012 6:28:11 PM
G - Down today on higher (near average) volume, slumping toward its 50 DMA line. Prior gains above its pivot point did not have volume sufficient to trigger a proper technical buy signal, and recent losses on higher volume (near average, but above prior session totals) indicate distributional pressure while working on a possible new base-on-base pattern.
>>> The latest Featured Stock Update with an annotated graph appeared on 4/4/2012. Click here.
View all notes |
Alert me of new notes |
CANSLIM.net Company Profile |
SEC |
Zacks Reports |
StockTalk |
News |
Chart |
Request a new note
C
A N
S L
I M
|
Symbol/Exchange
Company Name
Industry Group |
PRICE |
CHANGE
(%Change) |
Day High |
Volume
(% DAV)
(% 50 day avg vol) |
52 Wk Hi
% From Hi |
Featured
Date |
Price
Featured |
Pivot Featured |
|
Max Buy |
UBNT
-
NASDAQ
Ubiquiti Networks Inc
TELECOMMUNICATIONS - Diversified Communication Serv
|
$31.24
|
+0.74
2.43% |
$32.11
|
447,670
127.91% of 50 DAV
50 DAV is 350,000
|
$33.97
-8.04%
|
1/27/2012
|
$22.25
|
PP = $23.14
|
|
MB = $24.30
|
Most Recent Note - 4/10/2012 6:04:47 PM
G - Posted a gain on higher volume today, bucking widespread market weakness. It is extended from the previous base. Its 50 DMA line defines important near-term support to watch on pullbacks.
>>> The latest Featured Stock Update with an annotated graph appeared on 3/21/2012. Click here.
View all notes |
Alert me of new notes |
CANSLIM.net Company Profile |
SEC |
Zacks Reports |
StockTalk |
News |
Chart |
Request a new note
C
A N
S L
I M
|
ULTA
-
NASDAQ
Ulta Salon Cosm & Frag
SPECIALTY RETAIL - Specialty Retail, Other
|
$91.86
|
-2.51
-2.66% |
$94.37
|
1,223,599
179.76% of 50 DAV
50 DAV is 680,700
|
$95.62
-3.93%
|
1/11/2012
|
$71.97
|
PP = $75.80
|
|
MB = $79.59
|
Most Recent Note - 4/10/2012 6:06:19 PM
G - Down today on higher volume, encountering distributional pressure amid widespread market weakness. Its 50 DMA line defines support to watch well above its prior highs in the $75 area. It is extended from any sound base pattern.
>>> The latest Featured Stock Update with an annotated graph appeared on 2/28/2012. Click here.
View all notes |
Alert me of new notes |
CANSLIM.net Company Profile |
SEC |
Zacks Reports |
StockTalk |
News |
Chart |
Request a new note
C
A N
S L
I M
|
V
-
NYSE
Visa Inc Cl A
DIVERSIFIED SERVICES - Business/Management Services
|
$116.74
|
-2.76
-2.31% |
$119.77
|
2,670,012
74.92% of 50 DAV
50 DAV is 3,563,800
|
$121.15
-3.64%
|
3/12/2012
|
$116.53
|
PP = $119.46
|
|
MB = $125.43
|
Most Recent Note - 4/10/2012 6:08:09 PM
Y - Pulled back from its all-time high with a loss on below average volume today. Wedged higher without great volume conviction behind gains in recent weeks. Its 50 DMA line defines support to watch well above prior highs in the $103-104 area.
>>> The latest Featured Stock Update with an annotated graph appeared on 3/7/2012. Click here.
View all notes |
Alert me of new notes |
CANSLIM.net Company Profile |
SEC |
Zacks Reports |
StockTalk |
News |
Chart |
Request a new note
C
A N
S L
I M
|