You are not logged in.
This means you
CAN ONLY VIEW reports that were published prior to Monday, February 26, 2024.
You
MUST UPGRADE YOUR MEMBERSHIP if you want to see any current reports.
AFTER MARKET UPDATE - THURSDAY, APRIL 7TH, 2022
Previous After Market Report Next After Market Report >>>
|
|
|
|
DOW |
+87.06 |
34,583.57 |
+0.25% |
|
Volume |
1,007,716,358 |
-4% |
|
Volume |
4,711,434,000 |
-10% |
|
NASDAQ |
+8.48 |
13,897.30 |
+0.06% |
|
Advancers |
1,497 |
47% |
|
Advancers |
1,863 |
42% |
|
S&P 500 |
+19.06 |
4,500.21 |
+0.43% |
|
Decliners |
1,662 |
53% |
|
Decliners |
2,624 |
58% |
|
Russell 2000 |
-7.14 |
2,009.80 |
-0.35% |
|
52 Wk Highs |
68 |
|
|
52 Wk Highs |
77 |
|
|
S&P 600 |
-0.81 |
1,280.51 |
-0.06% |
|
52 Wk Lows |
261 |
|
|
52 Wk Lows |
175 |
|
|
 |
Major Indices Erased Early Losses to Close Higher
Kenneth J. Gruneisen - Passed the CAN SLIM® Master's Exam
The Dow climbed 87 points, erasing a nearly 300 point decline seen earlier in the session, while the S&P 500 added 0.4%. The Nasdaq Composite rose 0.1%, but remains on track for a 2.6% weekly drawdown. Volume totals reported were lighter than the prior session on the NYSE and on the Nasdaq exchange, revealing lackluster institutional buying demand. Breadth was slightly negative as decliners led advancers by a narrow margin on the NYSE and decliners led advancers by a 4-3 margin on the Nasdaq exchange. There were 33 high-ranked companies from the Leaders List that hit new 52-week highs and were listed on the BreakOuts Page, versus 34 on the prior session. New 52-week lows totals solidly outnumbered new 52-week highs on the NYSE and on the Nasdaq exchange. The major indices are in an uptrend that has come under pressure (M criteria). Strict followers of the fact-based investment system only buy stocks fitting all key fundamental and technical investment criteria.
Chart courtesy of www.stockcharts.com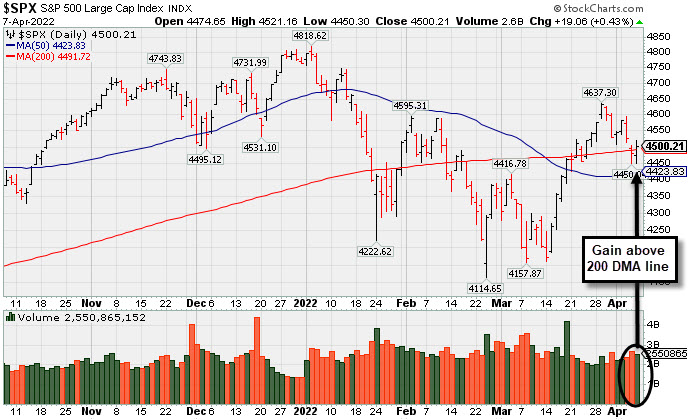 PICTURED: The S&P 500 Index posted a gain with lighter volume and rebounded above its 200-day moving average (DMA) line.
U.S. stocks turned higher on Thursday, rebounding from a two-day losing streak inspired by a decidedly hawkish tone from Federal Reserve (Fed) policymakers. Treasuries were mixed, with the yield curve steepening. The yield on the 10-year note added four basis points (0.04%) to 2.64%, while the two-year note yield slipped four basis points (0.04%) to 2.45%.
Wednesday’s release of the Fed’s March meeting minutes revealed that officials “generally agreed” to reduce the size of its nearly $9 trillion balance sheet by $95 billion per month. They also set the expectation that upcoming interest rate hikes could come in larger 0.50% intervals as the central bank prioritizes its fight against persistent inflation. Earlier today, St. Louis Fed President Bullard stated that he would prefer to see another 300 basis points (3.00%) in rate hikes by year-end. On the data front, weekly initial jobless claims came in at 166,000, dropping to the lowest level since November 1968.
Seven of 11 S&P 500 sectors finished in positive territory, with Health Care stocks outperforming. In corporate news, HP Inc. (HPQ +14.75%) rose after Berkshire Hathaway (BRKB +0.52%) disclosed a 121 million share stake valued at more than $4.2 billion. In earnings, Constellation Brands Inc. (STZ +4.61%) rose after topping earnings estimates. Packaged food company Lamb Weston Holdings Inc. (LW +7.97%) rose following an upbeat profit tally that included an improving margin outlook.
|
 Kenneth J. Gruneisen started out as a licensed stockbroker in August 1987, a couple of months prior to the historic stock market crash that took the Dow Jones Industrial Average down -22.6% in a single day. He has published daily fact-based fundamental and technical analysis on high-ranked stocks online for two decades. Through FACTBASEDINVESTING.COM, Kenneth provides educational articles, news, market commentary, and other information regarding proven investment systems that work in good times and bad.
Comments contained in the body of this report are technical opinions only and are not necessarily those of Gruneisen Growth Corp. The material herein has been obtained from sources believed to be reliable and accurate, however, its accuracy and completeness cannot be guaranteed. Our firm, employees, and customers may effect transactions, including transactions contrary to any recommendation herein, or have positions in the securities mentioned herein or options with respect thereto. Any recommendation contained in this report may not be suitable for all investors and it is not to be deemed an offer or solicitation on our part with respect to the purchase or sale of any securities. |
|
 |
Financials Fell as Retail, Biotech, and Commodity-Linked Groups Rose
Kenneth J. Gruneisen - Passed the CAN SLIM® Master's Exam
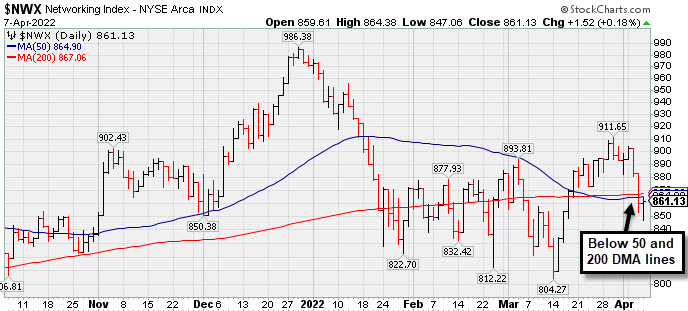
The Broker/Dealer Index ($XBD -0.86%) and Bank Index ($BKX -0.70%) both lost ground and created a drag on the major indices, meanwhile the Retail Index ($RLX +0.45%) posted a small gain. The Biotech Index ($BTK +1.19%) led the tech sector higher while the Semiconductor Index ($SOX +0.11%) and Networking Index ($NWX +0.17%) both inched higher. Commodity-linked groups also had a positive bias as the Gold & Silver Index ($XAU +1.22%) outpaced the Oil Services Index ($OSX +0.73%) and Integrated Oil Index ($XOI +0.94%). PICTURED: The Networking Index ($NWX +0.17%) recently slumped back below its 50-day and 200-day moving average (DMA) lines toward the March 2022 low.
| Oil Services |
$OSX |
79.58 |
+0.58 |
+0.73% |
+50.94% |
| Integrated Oil |
$XOI |
1,589.12 |
+14.80 |
+0.94% |
+34.88% |
| Semiconductor |
$SOX |
3,197.44 |
+3.48 |
+0.11% |
-18.97% |
| Networking |
$NWX |
861.10 |
+1.49 |
+0.17% |
-11.33% |
| Broker/Dealer |
$XBD |
444.31 |
-3.88 |
-0.86% |
-8.74% |
| Retail |
$RLX |
3,765.63 |
+17.04 |
+0.45% |
-10.90% |
| Gold & Silver |
$XAU |
159.92 |
+1.92 |
+1.22% |
+20.74% |
| Bank |
$BKX |
118.82 |
-0.84 |
-0.70% |
-10.13% |
| Biotech |
$BTK |
5,305.73 |
+62.51 |
+1.19% |
-3.85% |
|
|
|
 |
Featured Stocks
Kenneth J. Gruneisen - Passed the CAN SLIM® Master's Exam
|
|
|
Color Codes Explained :
Y - Better candidates highlighted by our
staff of experts.
G - Previously featured
in past reports as yellow but may no longer be buyable under the
guidelines.
***Last / Change / Volume data in this table is the closing quote data***
|
|
|
THESE ARE NOT BUY RECOMMENDATIONS!
Comments contained in the body of this report are technical
opinions only. The material herein has been obtained
from sources believed to be reliable and accurate, however,
its accuracy and completeness cannot be guaranteed.
This site is not an investment advisor, hence it does
not endorse or recommend any securities or other investments.
Any recommendation contained in this report may not
be suitable for all investors and it is not to be deemed
an offer or solicitation on our part with respect to
the purchase or sale of any securities. All trademarks,
service marks and trade names appearing in this report
are the property of their respective owners, and are
likewise used for identification purposes only.
This report is a service available
only to active Paid Premium Members.
You may opt-out of receiving report notifications
at any time. Questions or comments may be submitted
by writing to Premium Membership Services 665 S.E. 10 Street, Suite 201 Deerfield Beach, FL 33441-5634 or by calling 1-800-965-8307
or 954-785-1121.
|
|
|